Pine Castle, FL Map & Demographics
Pine Castle Map
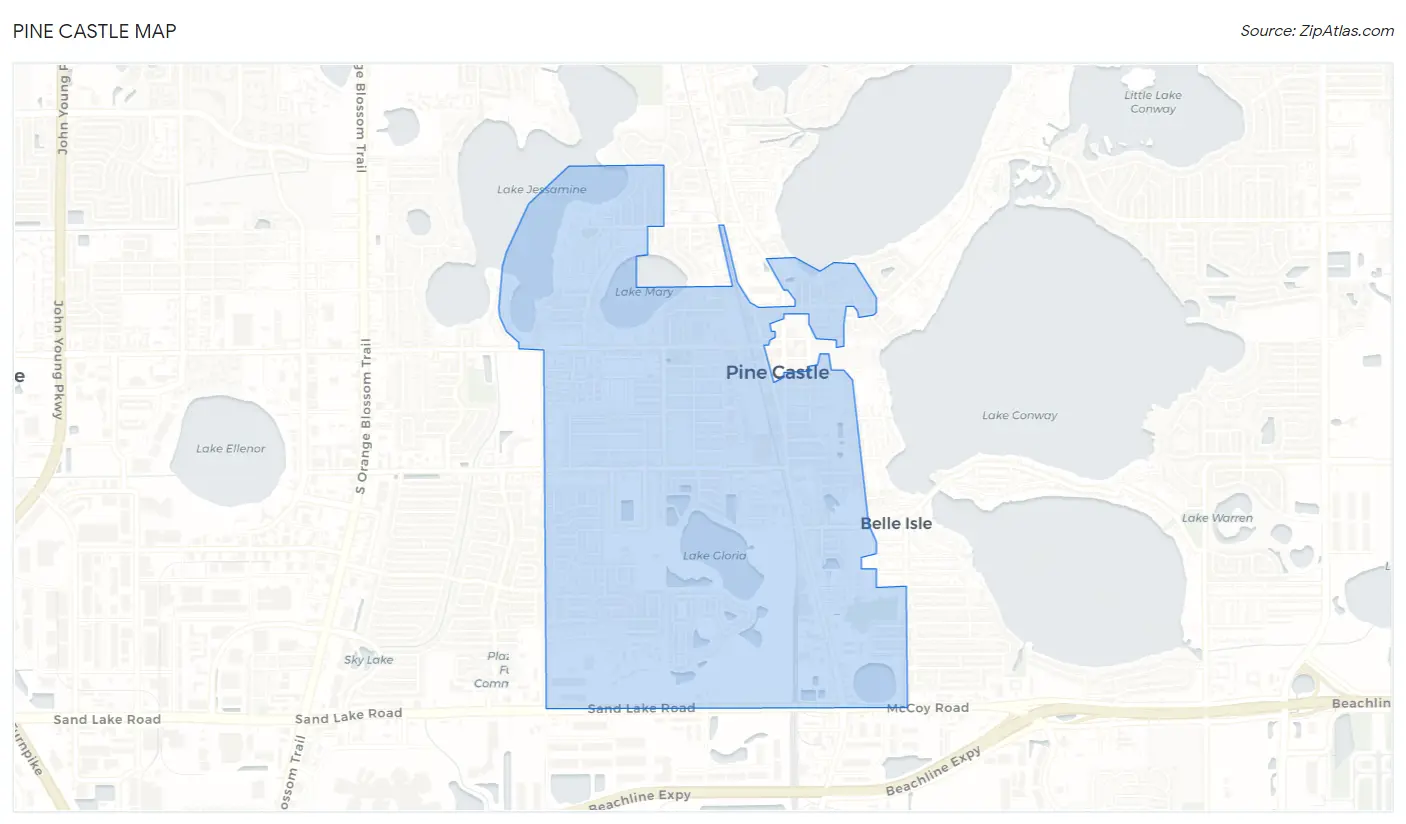
Pine Castle Overview
$20,690
PER CAPITA INCOME
$49,563
AVG FAMILY INCOME
$43,224
AVG HOUSEHOLD INCOME
21.4%
WAGE / INCOME GAP [ % ]
78.6¢/ $1
WAGE / INCOME GAP [ $ ]
0.42
INEQUALITY / GINI INDEX
9,556
TOTAL POPULATION
4,868
MALE POPULATION
4,688
FEMALE POPULATION
103.84
MALES / 100 FEMALES
96.30
FEMALES / 100 MALES
40.1
MEDIAN AGE
3.4
AVG FAMILY SIZE
2.9
AVG HOUSEHOLD SIZE
4,252
LABOR FORCE [ PEOPLE ]
57.4%
PERCENT IN LABOR FORCE
5.0%
UNEMPLOYMENT RATE
Income in Pine Castle
Income Overview in Pine Castle
Per Capita Income in Pine Castle is $20,690, while median incomes of families and households are $49,563 and $43,224 respectively.
| Characteristic | Number | Measure |
| Per Capita Income | 9,556 | $20,690 |
| Median Family Income | 2,271 | $49,563 |
| Mean Family Income | 2,271 | $57,646 |
| Median Household Income | 3,325 | $43,224 |
| Mean Household Income | 3,325 | $54,901 |
| Income Deficit | 2,271 | $0 |
| Wage / Income Gap (%) | 9,556 | 21.43% |
| Wage / Income Gap ($) | 9,556 | 78.57¢ per $1 |
| Gini / Inequality Index | 9,556 | 0.42 |
Earnings by Sex in Pine Castle
Average Earnings in Pine Castle are $30,323, $33,143 for men and $26,042 for women, a difference of 21.4%.
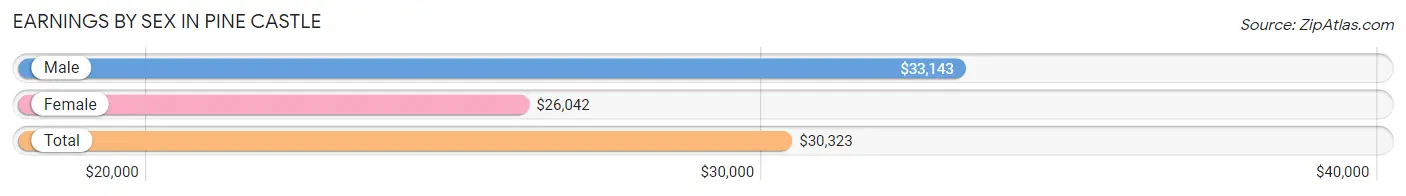
| Sex | Number | Average Earnings |
| Male | 2,629 (56.5%) | $33,143 |
| Female | 2,027 (43.5%) | $26,042 |
| Total | 4,656 (100.0%) | $30,323 |
Earnings by Sex by Income Bracket in Pine Castle
The most common earnings brackets in Pine Castle are $30,000 to $34,999 for men (445 | 16.9%) and $22,500 to $24,999 for women (302 | 14.9%).
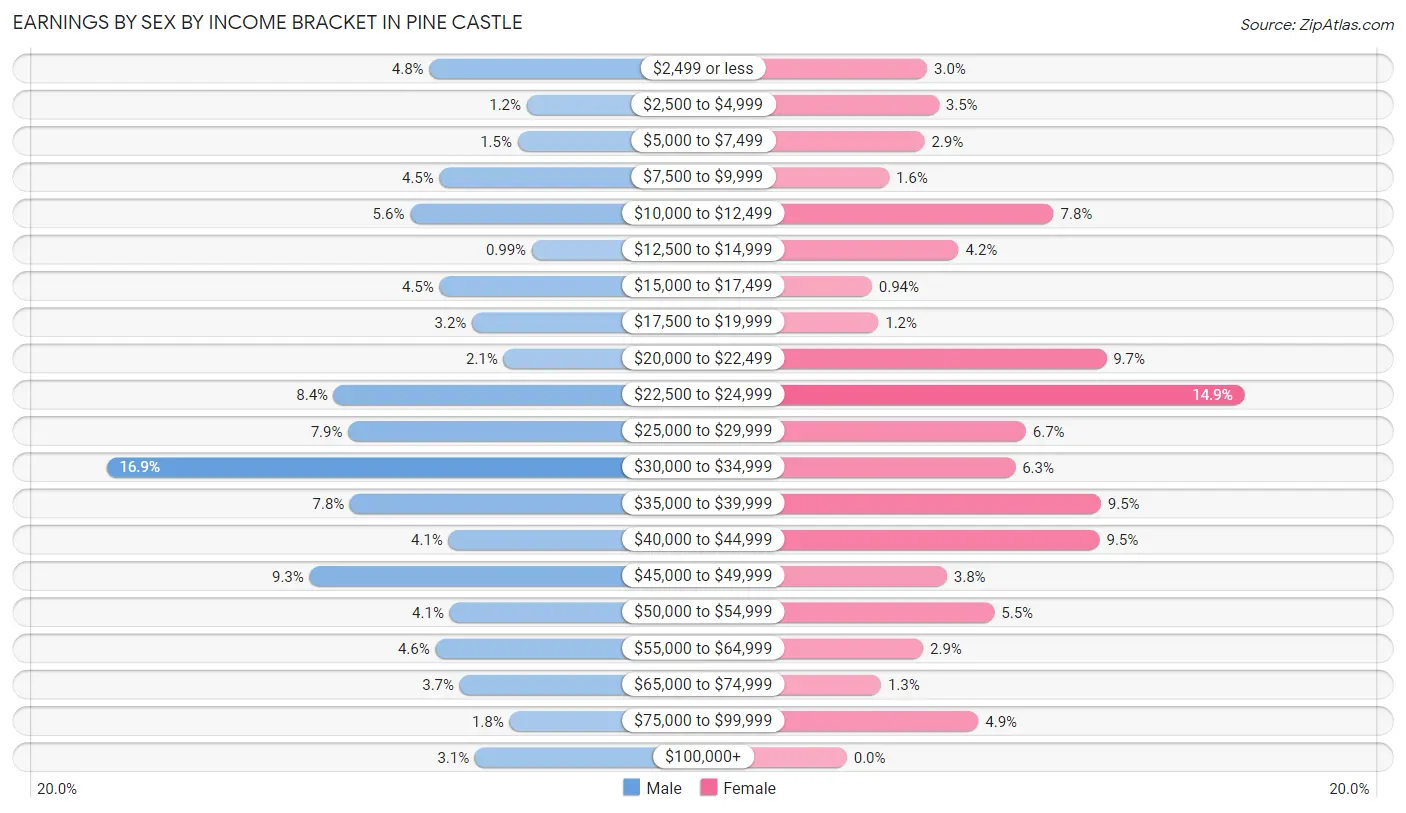
| Income | Male | Female |
| $2,499 or less | 127 (4.8%) | 61 (3.0%) |
| $2,500 to $4,999 | 31 (1.2%) | 70 (3.5%) |
| $5,000 to $7,499 | 40 (1.5%) | 59 (2.9%) |
| $7,500 to $9,999 | 117 (4.4%) | 32 (1.6%) |
| $10,000 to $12,499 | 146 (5.6%) | 157 (7.7%) |
| $12,500 to $14,999 | 26 (1.0%) | 85 (4.2%) |
| $15,000 to $17,499 | 117 (4.4%) | 19 (0.9%) |
| $17,500 to $19,999 | 85 (3.2%) | 24 (1.2%) |
| $20,000 to $22,499 | 54 (2.1%) | 197 (9.7%) |
| $22,500 to $24,999 | 221 (8.4%) | 302 (14.9%) |
| $25,000 to $29,999 | 207 (7.9%) | 136 (6.7%) |
| $30,000 to $34,999 | 445 (16.9%) | 128 (6.3%) |
| $35,000 to $39,999 | 205 (7.8%) | 193 (9.5%) |
| $40,000 to $44,999 | 108 (4.1%) | 192 (9.5%) |
| $45,000 to $49,999 | 245 (9.3%) | 76 (3.7%) |
| $50,000 to $54,999 | 107 (4.1%) | 112 (5.5%) |
| $55,000 to $64,999 | 121 (4.6%) | 58 (2.9%) |
| $65,000 to $74,999 | 97 (3.7%) | 26 (1.3%) |
| $75,000 to $99,999 | 48 (1.8%) | 100 (4.9%) |
| $100,000+ | 82 (3.1%) | 0 (0.0%) |
| Total | 2,629 (100.0%) | 2,027 (100.0%) |
Earnings by Sex by Educational Attainment in Pine Castle
Average earnings in Pine Castle are $33,649 for men and $27,807 for women, a difference of 17.4%. Men with an educational attainment of graduate degree enjoy the highest average annual earnings of $52,696, while those with less than high school education earn the least with $20,529. Women with an educational attainment of graduate degree earn the most with the average annual earnings of $52,839, while those with less than high school education have the smallest earnings of $21,559.
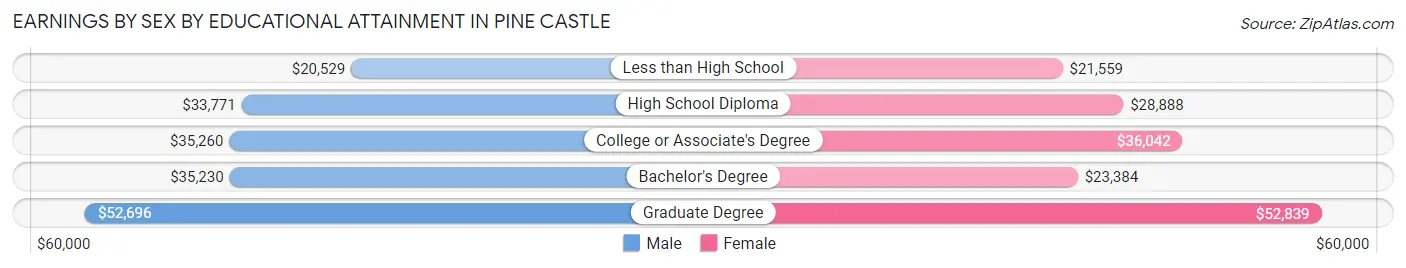
| Educational Attainment | Male Income | Female Income |
| Less than High School | $20,529 | $21,559 |
| High School Diploma | $33,771 | $28,888 |
| College or Associate's Degree | $35,260 | $36,042 |
| Bachelor's Degree | $35,230 | $23,384 |
| Graduate Degree | $52,696 | $52,839 |
| Total | $33,649 | $27,807 |
Family Income in Pine Castle
Family Income Brackets in Pine Castle
According to the Pine Castle family income data, there are 497 families falling into the $50,000 to $74,999 income range, which is the most common income bracket and makes up 21.9% of all families. Conversely, the $200,000+ income bracket is the least frequent group with only 30 families (1.3%) belonging to this category.
| Income Bracket | # Families | % Families |
| Less than $10,000 | 141 | 6.2% |
| $10,000 to $14,999 | 132 | 5.8% |
| $15,000 to $24,999 | 252 | 11.1% |
| $25,000 to $34,999 | 229 | 10.1% |
| $35,000 to $49,999 | 386 | 17.0% |
| $50,000 to $74,999 | 497 | 21.9% |
| $75,000 to $99,999 | 366 | 16.1% |
| $100,000 to $149,999 | 182 | 8.0% |
| $150,000 to $199,999 | 57 | 2.5% |
| $200,000+ | 30 | 1.3% |
Family Income by Famaliy Size in Pine Castle
5-person families (113 | 5.0%) account for the highest median family income in Pine Castle with $96,054 per family, while 2-person families (1,091 | 48.0%) have the highest median income of $22,943 per family member.
| Income Bracket | # Families | Median Income |
| 2-Person Families | 1,091 (48.0%) | $45,886 |
| 3-Person Families | 646 (28.4%) | $40,000 |
| 4-Person Families | 270 (11.9%) | $0 |
| 5-Person Families | 113 (5.0%) | $96,054 |
| 6-Person Families | 143 (6.3%) | $60,496 |
| 7+ Person Families | 8 (0.4%) | $0 |
| Total | 2,271 (100.0%) | $49,563 |
Family Income by Number of Earners in Pine Castle
| Number of Earners | # Families | Median Income |
| No Earners | 324 (14.3%) | $0 |
| 1 Earner | 1,064 (46.9%) | $38,045 |
| 2 Earners | 748 (32.9%) | $80,479 |
| 3+ Earners | 135 (5.9%) | $106,583 |
| Total | 2,271 (100.0%) | $49,563 |
Household Income in Pine Castle
Household Income Brackets in Pine Castle
With 615 households falling in the category, the $50,000 to $74,999 income range is the most frequent in Pine Castle, accounting for 18.5% of all households. In contrast, only 40 households (1.2%) fall into the $200,000+ income bracket, making it the least populous group.
| Income Bracket | # Households | % Households |
| Less than $10,000 | 203 | 6.1% |
| $10,000 to $14,999 | 303 | 9.1% |
| $15,000 to $24,999 | 356 | 10.7% |
| $25,000 to $34,999 | 436 | 13.1% |
| $35,000 to $49,999 | 598 | 18.0% |
| $50,000 to $74,999 | 615 | 18.5% |
| $75,000 to $99,999 | 436 | 13.1% |
| $100,000 to $149,999 | 229 | 6.9% |
| $150,000 to $199,999 | 110 | 3.3% |
| $200,000+ | 40 | 1.2% |
Household Income by Householder Age in Pine Castle
The median household income in Pine Castle is $43,224, with the highest median household income of $49,438 found in the 45 to 64 years age bracket for the primary householder. A total of 1,291 households (38.8%) fall into this category. Meanwhile, the 15 to 24 years age bracket for the primary householder has the lowest median household income of $0, with 40 households (1.2%) in this group.
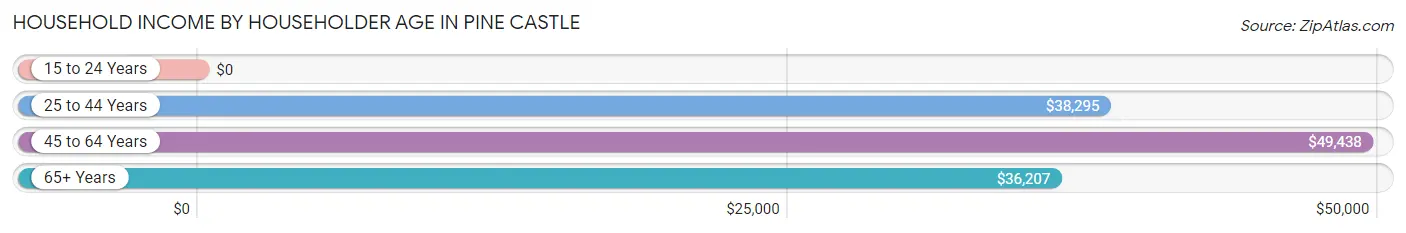
| Income Bracket | # Households | Median Income |
| 15 to 24 Years | 40 (1.2%) | $0 |
| 25 to 44 Years | 1,227 (36.9%) | $38,295 |
| 45 to 64 Years | 1,291 (38.8%) | $49,438 |
| 65+ Years | 767 (23.1%) | $36,207 |
| Total | 3,325 (100.0%) | $43,224 |
Poverty in Pine Castle
Income Below Poverty by Sex and Age in Pine Castle
With 14.2% poverty level for males and 29.9% for females among the residents of Pine Castle, 16 and 17 year old males and 16 and 17 year old females are the most vulnerable to poverty, with 71 males (53.8%) and 28 females (75.7%) in their respective age groups living below the poverty level.
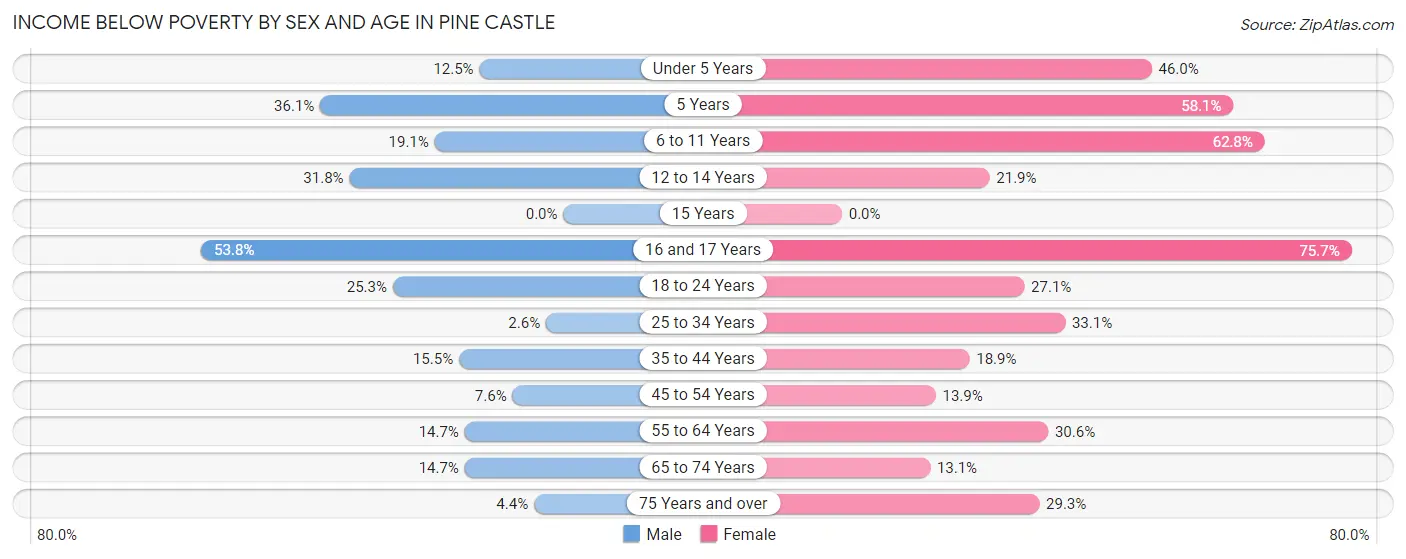
| Age Bracket | Male | Female |
| Under 5 Years | 37 (12.5%) | 138 (46.0%) |
| 5 Years | 39 (36.1%) | 50 (58.1%) |
| 6 to 11 Years | 78 (19.1%) | 282 (62.8%) |
| 12 to 14 Years | 61 (31.8%) | 39 (21.9%) |
| 15 Years | 0 (0.0%) | 0 (0.0%) |
| 16 and 17 Years | 71 (53.8%) | 28 (75.7%) |
| 18 to 24 Years | 59 (25.3%) | 65 (27.1%) |
| 25 to 34 Years | 12 (2.6%) | 290 (33.1%) |
| 35 to 44 Years | 109 (15.5%) | 141 (18.9%) |
| 45 to 54 Years | 71 (7.5%) | 81 (13.9%) |
| 55 to 64 Years | 64 (14.6%) | 173 (30.6%) |
| 65 to 74 Years | 75 (14.6%) | 47 (13.1%) |
| 75 Years and over | 16 (4.4%) | 63 (29.3%) |
| Total | 692 (14.2%) | 1,397 (29.9%) |
Income Above Poverty by Sex and Age in Pine Castle
According to the poverty statistics in Pine Castle, males aged 15 years and females aged 15 years are the age groups that are most secure financially, with 100.0% of males and 100.0% of females in these age groups living above the poverty line.
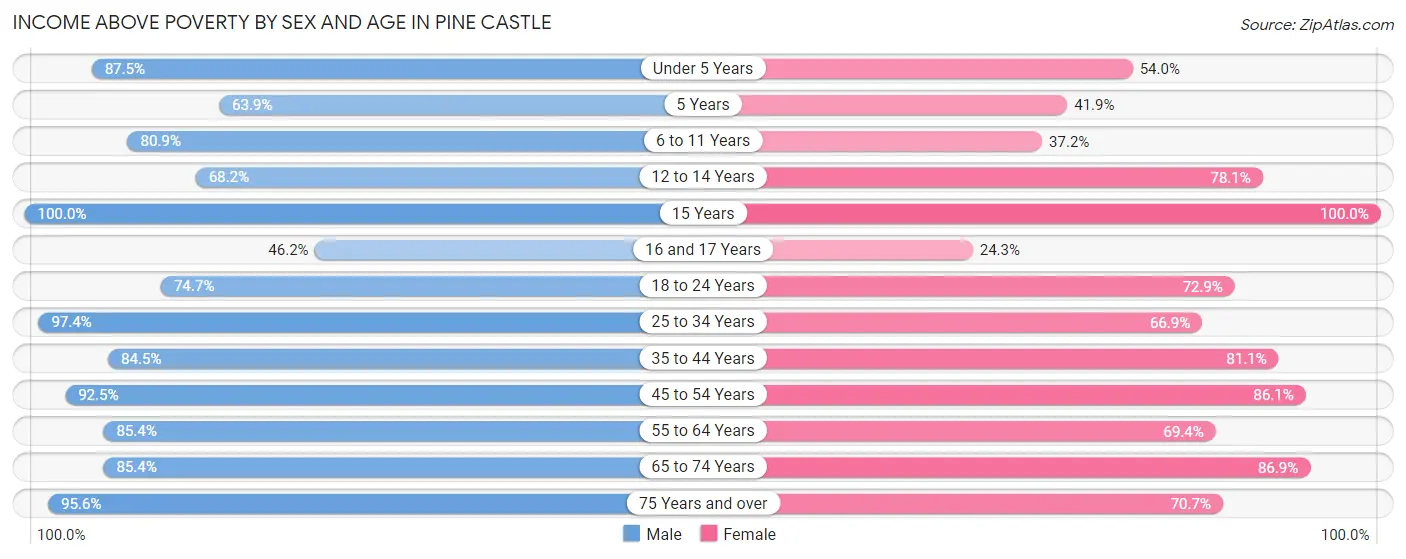
| Age Bracket | Male | Female |
| Under 5 Years | 260 (87.5%) | 162 (54.0%) |
| 5 Years | 69 (63.9%) | 36 (41.9%) |
| 6 to 11 Years | 330 (80.9%) | 167 (37.2%) |
| 12 to 14 Years | 131 (68.2%) | 139 (78.1%) |
| 15 Years | 65 (100.0%) | 48 (100.0%) |
| 16 and 17 Years | 61 (46.2%) | 9 (24.3%) |
| 18 to 24 Years | 174 (74.7%) | 175 (72.9%) |
| 25 to 34 Years | 454 (97.4%) | 585 (66.9%) |
| 35 to 44 Years | 594 (84.5%) | 604 (81.1%) |
| 45 to 54 Years | 869 (92.4%) | 501 (86.1%) |
| 55 to 64 Years | 373 (85.4%) | 392 (69.4%) |
| 65 to 74 Years | 437 (85.4%) | 312 (86.9%) |
| 75 Years and over | 351 (95.6%) | 152 (70.7%) |
| Total | 4,168 (85.8%) | 3,282 (70.1%) |
Income Below Poverty Among Married-Couple Families in Pine Castle
The poverty statistics for married-couple families in Pine Castle show that 4.5% or 58 of the total 1,277 families live below the poverty line. Families with 3 or 4 children have the highest poverty rate of 14.1%, comprising of 11 families. On the other hand, families with 1 or 2 children have the lowest poverty rate of 0.0%, which includes 0 families.
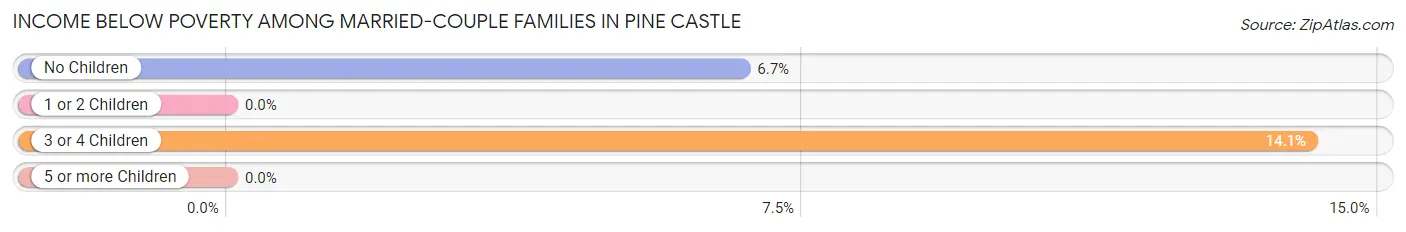
| Children | Above Poverty | Below Poverty |
| No Children | 656 (93.3%) | 47 (6.7%) |
| 1 or 2 Children | 488 (100.0%) | 0 (0.0%) |
| 3 or 4 Children | 67 (85.9%) | 11 (14.1%) |
| 5 or more Children | 8 (100.0%) | 0 (0.0%) |
| Total | 1,219 (95.5%) | 58 (4.5%) |
Income Below Poverty Among Single-Parent Households in Pine Castle
According to the poverty data in Pine Castle, 12.7% or 37 single-father households and 41.2% or 290 single-mother households are living below the poverty line. Among single-father households, those with no children have the highest poverty rate, with 37 households (33.9%) experiencing poverty. Likewise, among single-mother households, those with 5 or more children have the highest poverty rate, with 49 households (100.0%) falling below the poverty line.
| Children | Single Father | Single Mother |
| No Children | 37 (33.9%) | 50 (20.6%) |
| 1 or 2 Children | 0 (0.0%) | 191 (46.5%) |
| 3 or 4 Children | 0 (0.0%) | 0 (0.0%) |
| 5 or more Children | 0 (0.0%) | 49 (100.0%) |
| Total | 37 (12.7%) | 290 (41.2%) |
Income Below Poverty Among Married-Couple vs Single-Parent Households in Pine Castle
The poverty data for Pine Castle shows that 58 of the married-couple family households (4.5%) and 327 of the single-parent households (32.9%) are living below the poverty level. Within the married-couple family households, those with 3 or 4 children have the highest poverty rate, with 11 households (14.1%) falling below the poverty line. Among the single-parent households, those with 5 or more children have the highest poverty rate, with 49 household (100.0%) living below poverty.
| Children | Married-Couple Families | Single-Parent Households |
| No Children | 47 (6.7%) | 87 (24.7%) |
| 1 or 2 Children | 0 (0.0%) | 191 (34.2%) |
| 3 or 4 Children | 11 (14.1%) | 0 (0.0%) |
| 5 or more Children | 0 (0.0%) | 49 (100.0%) |
| Total | 58 (4.5%) | 327 (32.9%) |
Race in Pine Castle
The most populous races in Pine Castle are Hispanic or Latino (5,740 | 60.1%), White / Caucasian (4,280 | 44.8%), and Two or more Races (2,290 | 24.0%).
| Race | # Population | % Population |
| Asian | 354 | 3.7% |
| Black / African American | 1,022 | 10.7% |
| Hawaiian / Pacific | 0 | 0.0% |
| Hispanic or Latino | 5,740 | 60.1% |
| Native / Alaskan | 25 | 0.3% |
| White / Caucasian | 4,280 | 44.8% |
| Two or more Races | 2,290 | 24.0% |
| Some other Race | 1,585 | 16.6% |
| Total | 9,556 | 100.0% |
Ancestry in Pine Castle
The most populous ancestries reported in Pine Castle are Puerto Rican (3,352 | 35.1%), Mexican (802 | 8.4%), Cuban (743 | 7.8%), Haitian (656 | 6.9%), and Italian (602 | 6.3%), together accounting for 64.4% of all Pine Castle residents.
| Ancestry | # Population | % Population |
| African | 14 | 0.2% |
| American | 195 | 2.0% |
| Arab | 33 | 0.4% |
| Australian | 34 | 0.4% |
| Austrian | 7 | 0.1% |
| Brazilian | 8 | 0.1% |
| British | 25 | 0.3% |
| Central American | 268 | 2.8% |
| Central American Indian | 82 | 0.9% |
| Cherokee | 23 | 0.2% |
| Chickasaw | 18 | 0.2% |
| Chilean | 18 | 0.2% |
| Choctaw | 18 | 0.2% |
| Colombian | 170 | 1.8% |
| Cuban | 743 | 7.8% |
| Czech | 48 | 0.5% |
| Dominican | 315 | 3.3% |
| Dutch | 13 | 0.1% |
| Eastern European | 32 | 0.3% |
| English | 189 | 2.0% |
| Finnish | 18 | 0.2% |
| French | 181 | 1.9% |
| French Canadian | 17 | 0.2% |
| German | 375 | 3.9% |
| Greek | 26 | 0.3% |
| Haitian | 656 | 6.9% |
| Honduran | 150 | 1.6% |
| Hungarian | 45 | 0.5% |
| Iraqi | 20 | 0.2% |
| Irish | 206 | 2.2% |
| Italian | 602 | 6.3% |
| Jamaican | 141 | 1.5% |
| Korean | 35 | 0.4% |
| Mexican | 802 | 8.4% |
| Native Hawaiian | 20 | 0.2% |
| Nicaraguan | 89 | 0.9% |
| Nigerian | 55 | 0.6% |
| Norwegian | 3 | 0.0% |
| Panamanian | 20 | 0.2% |
| Polish | 32 | 0.3% |
| Portuguese | 16 | 0.2% |
| Potawatomi | 14 | 0.2% |
| Puerto Rican | 3,352 | 35.1% |
| Russian | 6 | 0.1% |
| Salvadoran | 9 | 0.1% |
| Scandinavian | 15 | 0.2% |
| Scotch-Irish | 20 | 0.2% |
| Scottish | 67 | 0.7% |
| Seminole | 17 | 0.2% |
| Slovene | 18 | 0.2% |
| South American | 246 | 2.6% |
| Sri Lankan | 45 | 0.5% |
| Subsaharan African | 69 | 0.7% |
| Swedish | 3 | 0.0% |
| Thai | 274 | 2.9% |
| U.S. Virgin Islander | 65 | 0.7% |
| Welsh | 18 | 0.2% |
| West Indian | 32 | 0.3% |
| Yugoslavian | 24 | 0.3% | View All 59 Rows |
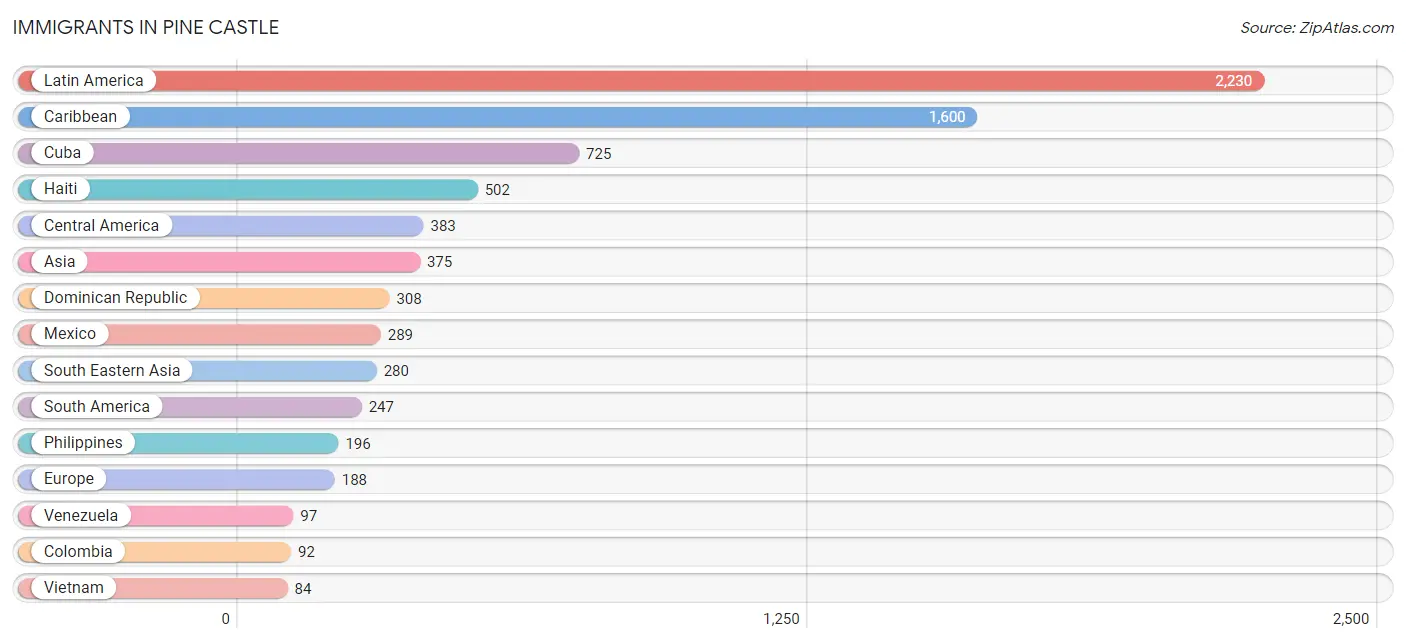
Immigrants in Pine Castle
The most numerous immigrant groups reported in Pine Castle came from Latin America (2,230 | 23.3%), Caribbean (1,600 | 16.7%), Cuba (725 | 7.6%), Haiti (502 | 5.2%), and Central America (383 | 4.0%), together accounting for 56.9% of all Pine Castle residents.
| Immigration Origin | # Population | % Population |
| Africa | 49 | 0.5% |
| Asia | 375 | 3.9% |
| Australia | 34 | 0.4% |
| Bosnia and Herzegovina | 8 | 0.1% |
| Brazil | 40 | 0.4% |
| Canada | 8 | 0.1% |
| Caribbean | 1,600 | 16.7% |
| Central America | 383 | 4.0% |
| Chile | 18 | 0.2% |
| Colombia | 92 | 1.0% |
| Cuba | 725 | 7.6% |
| Dominican Republic | 308 | 3.2% |
| Eastern Europe | 32 | 0.3% |
| El Salvador | 9 | 0.1% |
| Europe | 188 | 2.0% |
| France | 77 | 0.8% |
| Greece | 7 | 0.1% |
| Haiti | 502 | 5.2% |
| Honduras | 23 | 0.2% |
| India | 14 | 0.2% |
| Iraq | 20 | 0.2% |
| Israel | 9 | 0.1% |
| Italy | 59 | 0.6% |
| Jamaica | 42 | 0.4% |
| Latin America | 2,230 | 23.3% |
| Mexico | 289 | 3.0% |
| Morocco | 13 | 0.1% |
| Nicaragua | 42 | 0.4% |
| Nigeria | 36 | 0.4% |
| Northern Africa | 13 | 0.1% |
| Northern Europe | 13 | 0.1% |
| Oceania | 34 | 0.4% |
| Pakistan | 52 | 0.5% |
| Panama | 20 | 0.2% |
| Philippines | 196 | 2.1% |
| South America | 247 | 2.6% |
| South Central Asia | 66 | 0.7% |
| South Eastern Asia | 280 | 2.9% |
| Southern Europe | 66 | 0.7% |
| Trinidad and Tobago | 23 | 0.2% |
| Venezuela | 97 | 1.0% |
| Vietnam | 84 | 0.9% |
| Western Africa | 36 | 0.4% |
| Western Asia | 29 | 0.3% |
| Western Europe | 77 | 0.8% | View All 45 Rows |
Sex and Age in Pine Castle
Sex and Age in Pine Castle
The most populous age groups in Pine Castle are 45 to 49 Years (607 | 12.5%) for men and 40 to 44 Years (578 | 12.3%) for women.
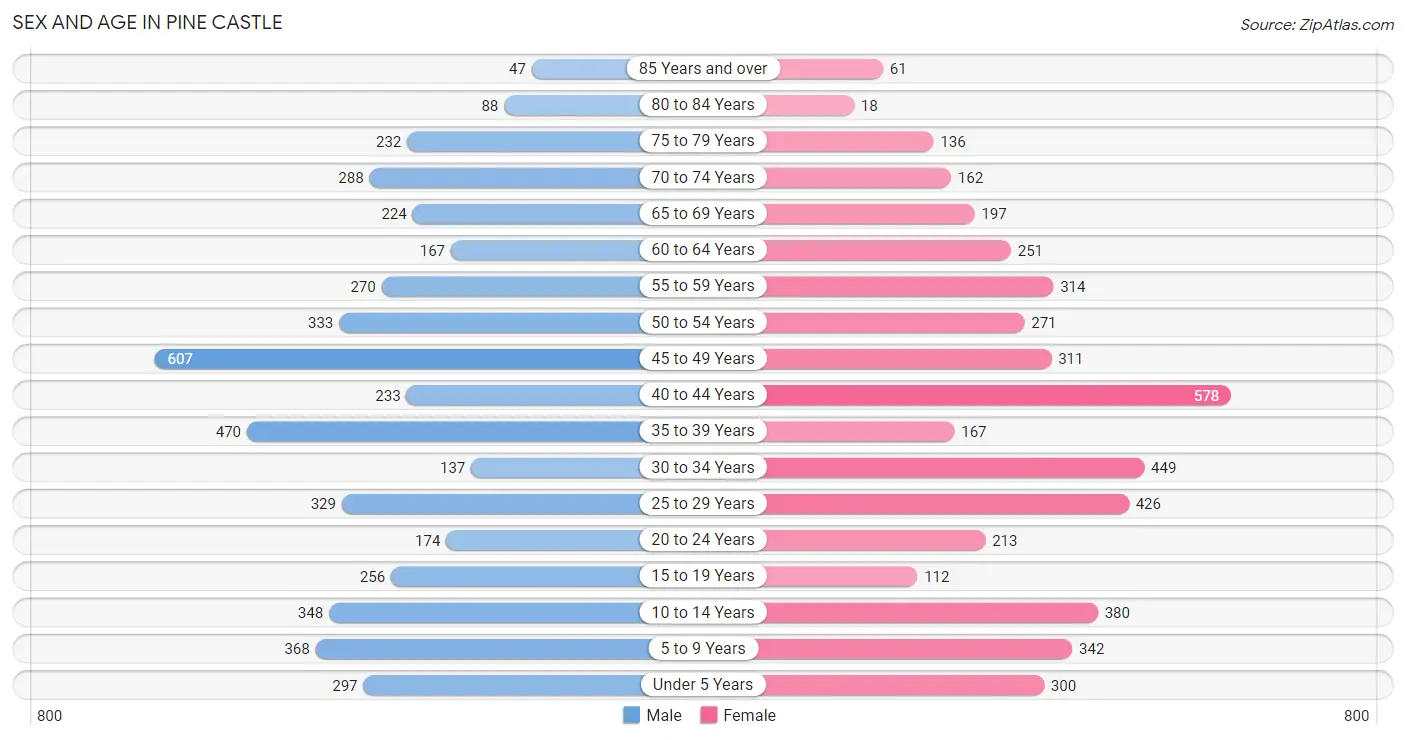
| Age Bracket | Male | Female |
| Under 5 Years | 297 (6.1%) | 300 (6.4%) |
| 5 to 9 Years | 368 (7.6%) | 342 (7.3%) |
| 10 to 14 Years | 348 (7.1%) | 380 (8.1%) |
| 15 to 19 Years | 256 (5.3%) | 112 (2.4%) |
| 20 to 24 Years | 174 (3.6%) | 213 (4.5%) |
| 25 to 29 Years | 329 (6.8%) | 426 (9.1%) |
| 30 to 34 Years | 137 (2.8%) | 449 (9.6%) |
| 35 to 39 Years | 470 (9.7%) | 167 (3.6%) |
| 40 to 44 Years | 233 (4.8%) | 578 (12.3%) |
| 45 to 49 Years | 607 (12.5%) | 311 (6.6%) |
| 50 to 54 Years | 333 (6.8%) | 271 (5.8%) |
| 55 to 59 Years | 270 (5.6%) | 314 (6.7%) |
| 60 to 64 Years | 167 (3.4%) | 251 (5.3%) |
| 65 to 69 Years | 224 (4.6%) | 197 (4.2%) |
| 70 to 74 Years | 288 (5.9%) | 162 (3.5%) |
| 75 to 79 Years | 232 (4.8%) | 136 (2.9%) |
| 80 to 84 Years | 88 (1.8%) | 18 (0.4%) |
| 85 Years and over | 47 (1.0%) | 61 (1.3%) |
| Total | 4,868 (100.0%) | 4,688 (100.0%) |
Families and Households in Pine Castle
Median Family Size in Pine Castle
The median family size in Pine Castle is 3.37 persons per family, with married-couple families (1,277 | 56.2%) accounting for the largest median family size of 3.6 persons per family. On the other hand, single male/father families (291 | 12.8%) represent the smallest median family size with 2.53 persons per family.
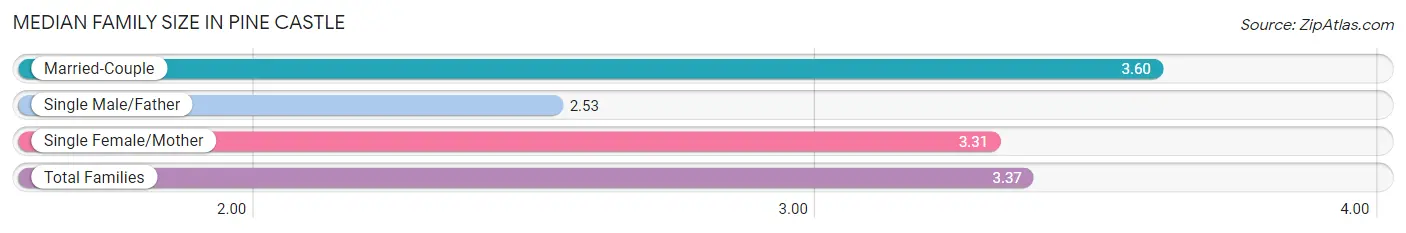
| Family Type | # Families | Family Size |
| Married-Couple | 1,277 (56.2%) | 3.60 |
| Single Male/Father | 291 (12.8%) | 2.53 |
| Single Female/Mother | 703 (31.0%) | 3.31 |
| Total Families | 2,271 (100.0%) | 3.37 |
Median Household Size in Pine Castle
The median household size in Pine Castle is 2.87 persons per household, with single female/mother households (703 | 21.1%) accounting for the largest median household size of 3.8 persons per household. non-family households (1,054 | 31.7%) represent the smallest median household size with 1.28 persons per household.
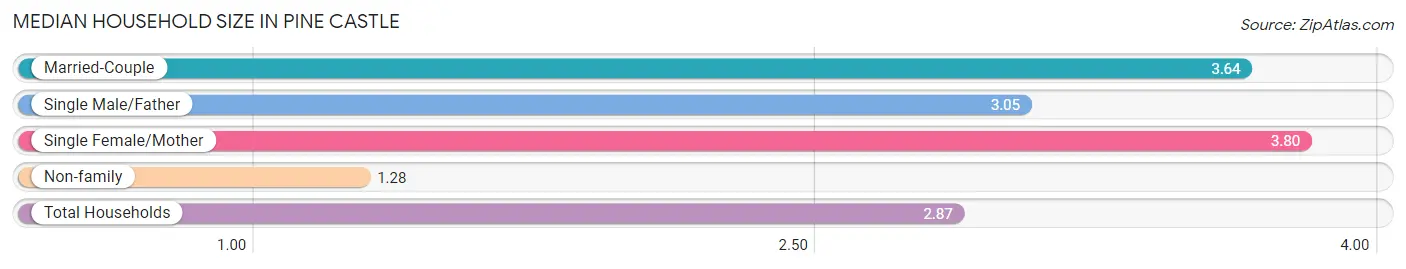
| Household Type | # Households | Household Size |
| Married-Couple | 1,277 (38.4%) | 3.64 |
| Single Male/Father | 291 (8.7%) | 3.05 |
| Single Female/Mother | 703 (21.1%) | 3.80 |
| Non-family | 1,054 (31.7%) | 1.28 |
| Total Households | 3,325 (100.0%) | 2.87 |
Household Size by Marriage Status in Pine Castle
Out of a total of 3,325 households in Pine Castle, 2,271 (68.3%) are family households, while 1,054 (31.7%) are nonfamily households. The most numerous type of family households are 2-person households, comprising 923, and the most common type of nonfamily households are 1-person households, comprising 875.
| Household Size | Family Households | Nonfamily Households |
| 1-Person Households | - | 875 (26.3%) |
| 2-Person Households | 923 (27.8%) | 158 (4.8%) |
| 3-Person Households | 585 (17.6%) | 0 (0.0%) |
| 4-Person Households | 433 (13.0%) | 21 (0.6%) |
| 5-Person Households | 170 (5.1%) | 0 (0.0%) |
| 6-Person Households | 152 (4.6%) | 0 (0.0%) |
| 7+ Person Households | 8 (0.2%) | 0 (0.0%) |
| Total | 2,271 (68.3%) | 1,054 (31.7%) |
Female Fertility in Pine Castle
Fertility by Age in Pine Castle
Average fertility rate in Pine Castle is 64.0 births per 1,000 women. Women in the age bracket of 20 to 34 years have the highest fertility rate with 137.0 births per 1,000 women. Women in the age bracket of 20 to 34 years acount for 100.0% of all women with births.
| Age Bracket | Women with Births | Births / 1,000 Women |
| 15 to 19 years | 0 (0.0%) | 0.0 |
| 20 to 34 years | 149 (100.0%) | 137.0 |
| 35 to 50 years | 0 (0.0%) | 0.0 |
| Total | 149 (100.0%) | 64.0 |
Fertility by Age by Marriage Status in Pine Castle
| Age Bracket | Married | Unmarried |
| 15 to 19 years | 0 (0.0%) | 0 (0.0%) |
| 20 to 34 years | 0 (0.0%) | 149 (100.0%) |
| 35 to 50 years | 0 (0.0%) | 0 (0.0%) |
| Total | 0 (0.0%) | 149 (100.0%) |
Fertility by Education in Pine Castle
| Educational Attainment | Women with Births | Births / 1,000 Women |
| Less than High School | 18 (12.1%) | 64.0 |
| High School Diploma | 131 (87.9%) | 125.0 |
| College or Associate's Degree | 0 (0.0%) | 0.0 |
| Bachelor's Degree | 0 (0.0%) | 0.0 |
| Graduate Degree | 0 (0.0%) | 0.0 |
| Total | 149 (100.0%) | 64.0 |
Fertility by Education by Marriage Status in Pine Castle
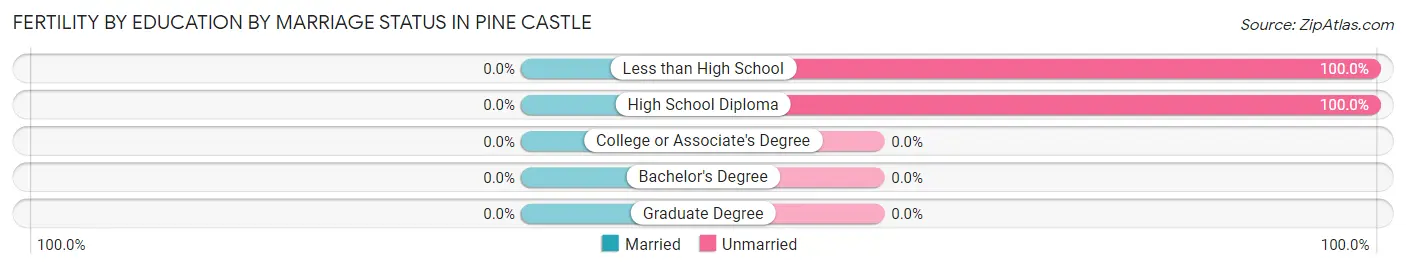
| Educational Attainment | Married | Unmarried |
| Less than High School | 0 (0.0%) | 18 (100.0%) |
| High School Diploma | 0 (0.0%) | 131 (100.0%) |
| College or Associate's Degree | 0 (0.0%) | 0 (0.0%) |
| Bachelor's Degree | 0 (0.0%) | 0 (0.0%) |
| Graduate Degree | 0 (0.0%) | 0 (0.0%) |
| Total | 0 (0.0%) | 149 (100.0%) |
Employment Characteristics in Pine Castle
Employment by Class of Employer in Pine Castle
Among the 4,012 employed individuals in Pine Castle, private company employees (3,216 | 80.2%), local government employees (251 | 6.3%), and self-employed (not incorporated) (177 | 4.4%) make up the most common classes of employment.
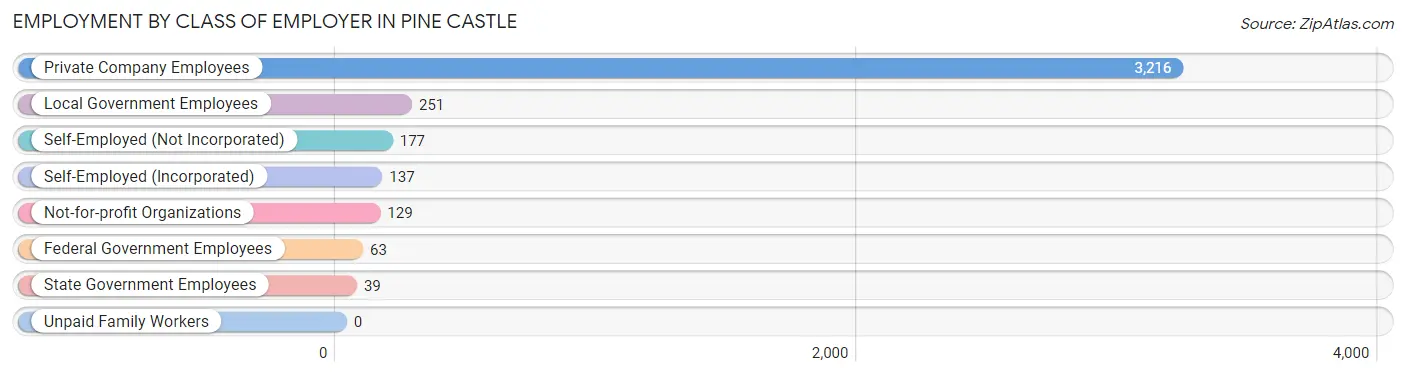
| Employer Class | # Employees | % Employees |
| Private Company Employees | 3,216 | 80.2% |
| Self-Employed (Incorporated) | 137 | 3.4% |
| Self-Employed (Not Incorporated) | 177 | 4.4% |
| Not-for-profit Organizations | 129 | 3.2% |
| Local Government Employees | 251 | 6.3% |
| State Government Employees | 39 | 1.0% |
| Federal Government Employees | 63 | 1.6% |
| Unpaid Family Workers | 0 | 0.0% |
| Total | 4,012 | 100.0% |
Employment Status by Age in Pine Castle
According to the labor force statistics for Pine Castle, out of the total population over 16 years of age (7,408), 57.4% or 4,252 individuals are in the labor force, with 5.0% or 213 of them unemployed. The age group with the highest labor force participation rate is 25 to 29 years, with 87.9% or 664 individuals in the labor force. Within the labor force, the 55 to 59 years age range has the highest percentage of unemployed individuals, with 14.1% or 44 of them being unemployed.
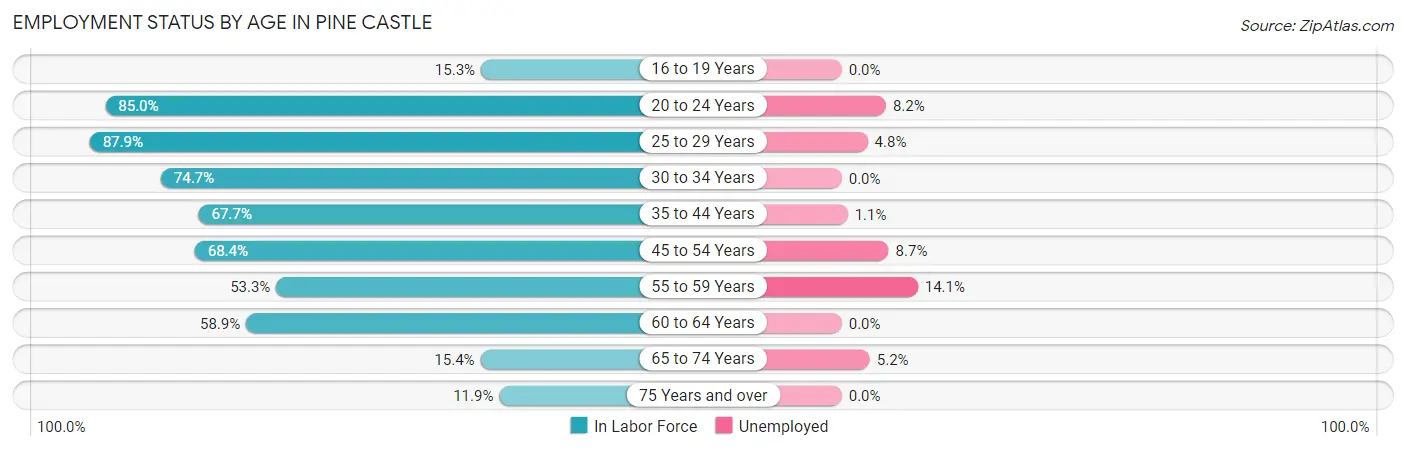
| Age Bracket | In Labor Force | Unemployed |
| 16 to 19 Years | 39 (15.3%) | 0 (0.0%) |
| 20 to 24 Years | 329 (85.0%) | 27 (8.2%) |
| 25 to 29 Years | 664 (87.9%) | 32 (4.8%) |
| 30 to 34 Years | 438 (74.7%) | 0 (0.0%) |
| 35 to 44 Years | 980 (67.7%) | 11 (1.1%) |
| 45 to 54 Years | 1,041 (68.4%) | 91 (8.7%) |
| 55 to 59 Years | 311 (53.3%) | 44 (14.1%) |
| 60 to 64 Years | 246 (58.9%) | 0 (0.0%) |
| 65 to 74 Years | 134 (15.4%) | 7 (5.2%) |
| 75 Years and over | 69 (11.9%) | 0 (0.0%) |
| Total | 4,252 (57.4%) | 213 (5.0%) |
Employment Status by Educational Attainment in Pine Castle
According to labor force statistics for Pine Castle, 69.3% of individuals (3,682) out of the total population between 25 and 64 years of age (5,313) are in the labor force, with 4.8% or 177 of them being unemployed. The group with the highest labor force participation rate are those with the educational attainment of bachelor's degree or higher, with 91.3% or 1,013 individuals in the labor force. Within the labor force, individuals with less than high school education have the highest percentage of unemployment, with 14.4% or 56 of them being unemployed.
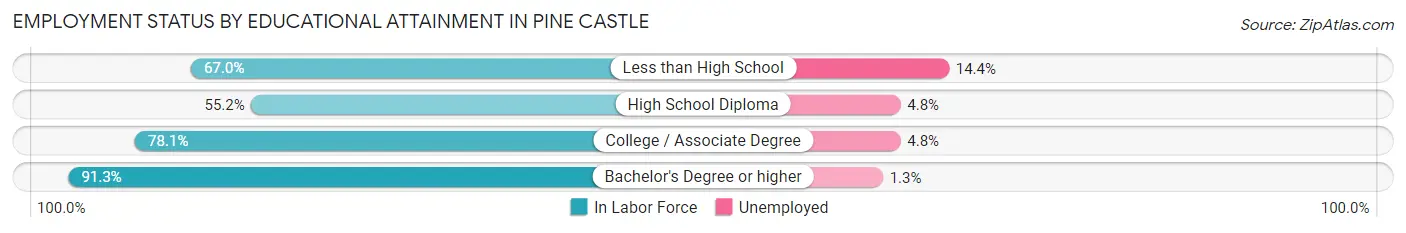
| Educational Attainment | In Labor Force | Unemployed |
| Less than High School | 390 (67.0%) | 84 (14.4%) |
| High School Diploma | 1,330 (55.2%) | 116 (4.8%) |
| College / Associate Degree | 947 (78.1%) | 58 (4.8%) |
| Bachelor's Degree or higher | 1,013 (91.3%) | 14 (1.3%) |
| Total | 3,682 (69.3%) | 255 (4.8%) |
Employment Occupations by Sex in Pine Castle
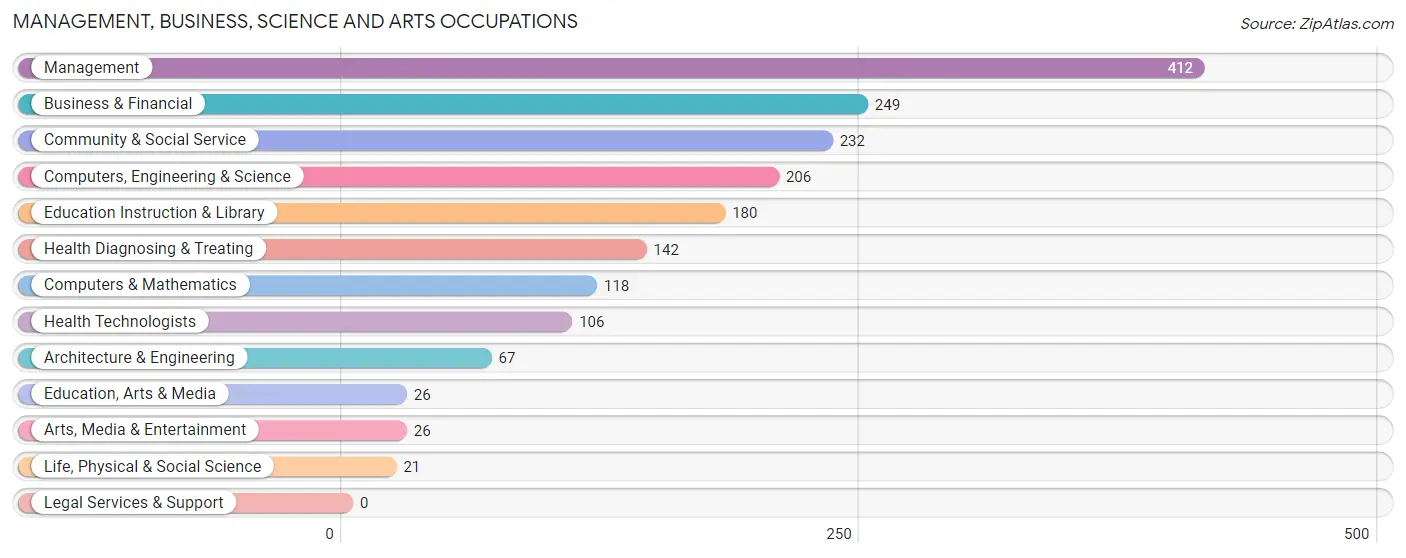
Management, Business, Science and Arts Occupations
The most common Management, Business, Science and Arts occupations in Pine Castle are Management (412 | 10.2%), Business & Financial (249 | 6.2%), Community & Social Service (232 | 5.7%), Computers, Engineering & Science (206 | 5.1%), and Education Instruction & Library (180 | 4.5%).
Management, Business, Science and Arts Occupations by Sex
Within the Management, Business, Science and Arts occupations in Pine Castle, the most male-oriented occupations are Architecture & Engineering (100.0%), Education, Arts & Media (100.0%), and Computers, Engineering & Science (78.2%), while the most female-oriented occupations are Health Diagnosing & Treating (97.9%), Health Technologists (97.2%), and Business & Financial (66.3%).
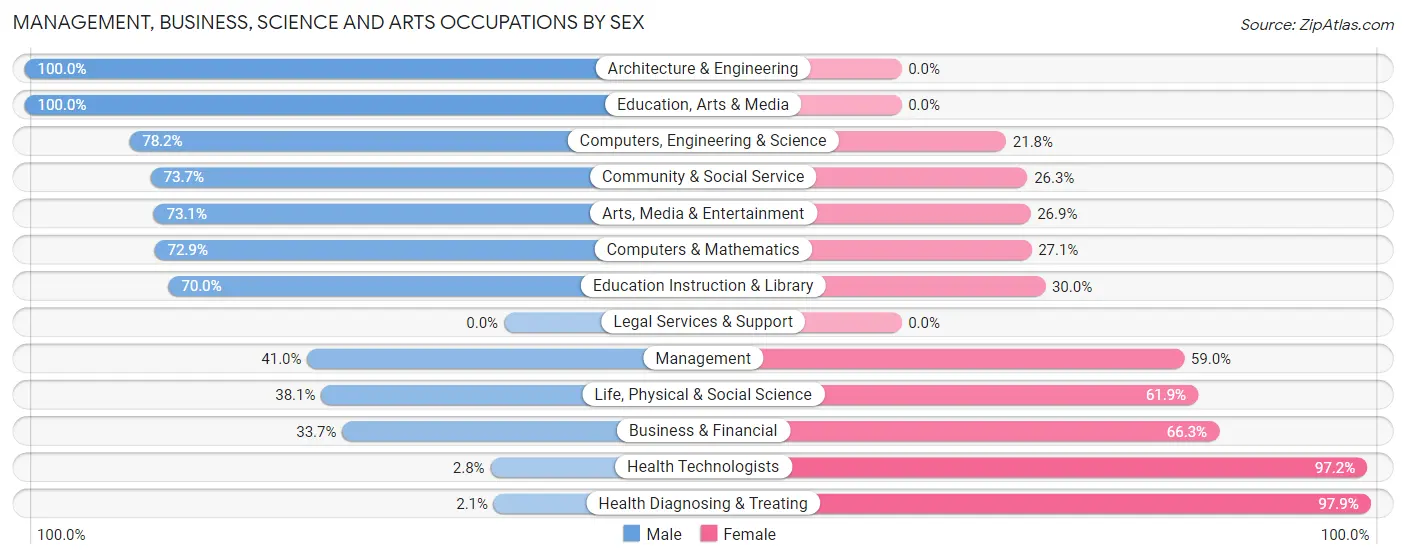
| Occupation | Male | Female |
| Management | 169 (41.0%) | 243 (59.0%) |
| Business & Financial | 84 (33.7%) | 165 (66.3%) |
| Computers, Engineering & Science | 161 (78.2%) | 45 (21.8%) |
| Computers & Mathematics | 86 (72.9%) | 32 (27.1%) |
| Architecture & Engineering | 67 (100.0%) | 0 (0.0%) |
| Life, Physical & Social Science | 8 (38.1%) | 13 (61.9%) |
| Community & Social Service | 171 (73.7%) | 61 (26.3%) |
| Education, Arts & Media | 26 (100.0%) | 0 (0.0%) |
| Legal Services & Support | 0 (0.0%) | 0 (0.0%) |
| Education Instruction & Library | 126 (70.0%) | 54 (30.0%) |
| Arts, Media & Entertainment | 19 (73.1%) | 7 (26.9%) |
| Health Diagnosing & Treating | 3 (2.1%) | 139 (97.9%) |
| Health Technologists | 3 (2.8%) | 103 (97.2%) |
| Total (Category) | 588 (47.4%) | 653 (52.6%) |
| Total (Overall) | 2,090 (51.7%) | 1,949 (48.2%) |
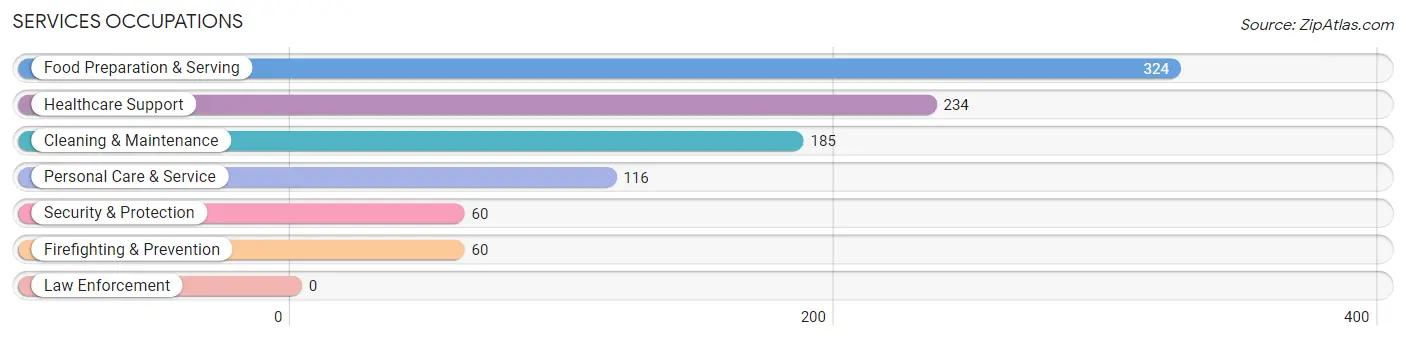
Services Occupations
The most common Services occupations in Pine Castle are Food Preparation & Serving (324 | 8.0%), Healthcare Support (234 | 5.8%), Cleaning & Maintenance (185 | 4.6%), Personal Care & Service (116 | 2.9%), and Security & Protection (60 | 1.5%).
Services Occupations by Sex
Within the Services occupations in Pine Castle, the most male-oriented occupations are Security & Protection (100.0%), Firefighting & Prevention (100.0%), and Cleaning & Maintenance (87.6%), while the most female-oriented occupations are Healthcare Support (74.4%), Food Preparation & Serving (41.4%), and Personal Care & Service (20.7%).
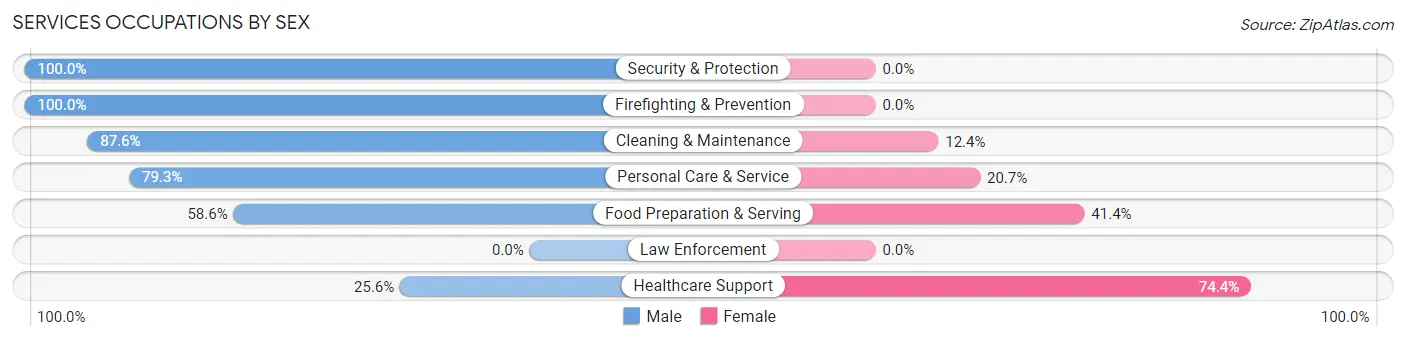
| Occupation | Male | Female |
| Healthcare Support | 60 (25.6%) | 174 (74.4%) |
| Security & Protection | 60 (100.0%) | 0 (0.0%) |
| Firefighting & Prevention | 60 (100.0%) | 0 (0.0%) |
| Law Enforcement | 0 (0.0%) | 0 (0.0%) |
| Food Preparation & Serving | 190 (58.6%) | 134 (41.4%) |
| Cleaning & Maintenance | 162 (87.6%) | 23 (12.4%) |
| Personal Care & Service | 92 (79.3%) | 24 (20.7%) |
| Total (Category) | 564 (61.4%) | 355 (38.6%) |
| Total (Overall) | 2,090 (51.7%) | 1,949 (48.2%) |
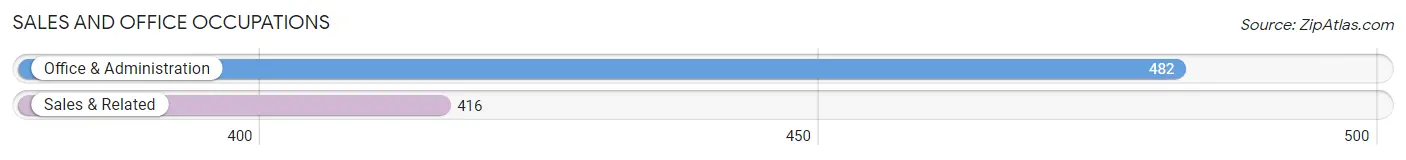
Sales and Office Occupations
The most common Sales and Office occupations in Pine Castle are Office & Administration (482 | 11.9%), and Sales & Related (416 | 10.3%).
Sales and Office Occupations by Sex
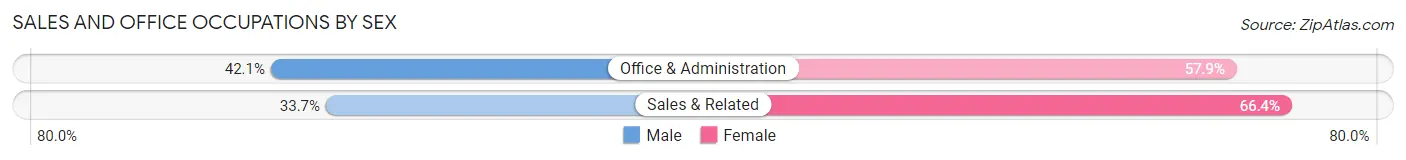
| Occupation | Male | Female |
| Sales & Related | 140 (33.7%) | 276 (66.3%) |
| Office & Administration | 203 (42.1%) | 279 (57.9%) |
| Total (Category) | 343 (38.2%) | 555 (61.8%) |
| Total (Overall) | 2,090 (51.7%) | 1,949 (48.2%) |
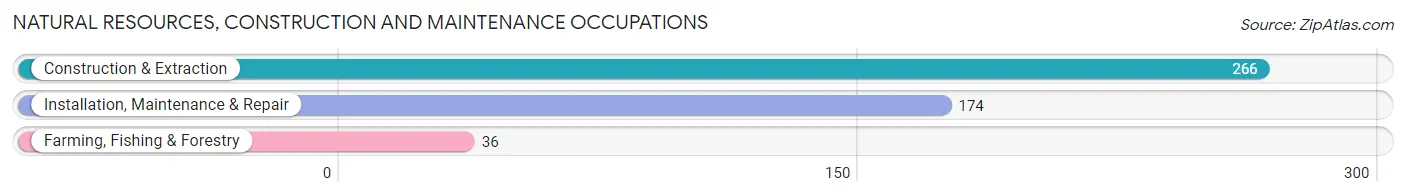
Natural Resources, Construction and Maintenance Occupations
The most common Natural Resources, Construction and Maintenance occupations in Pine Castle are Construction & Extraction (266 | 6.6%), Installation, Maintenance & Repair (174 | 4.3%), and Farming, Fishing & Forestry (36 | 0.9%).
Natural Resources, Construction and Maintenance Occupations by Sex
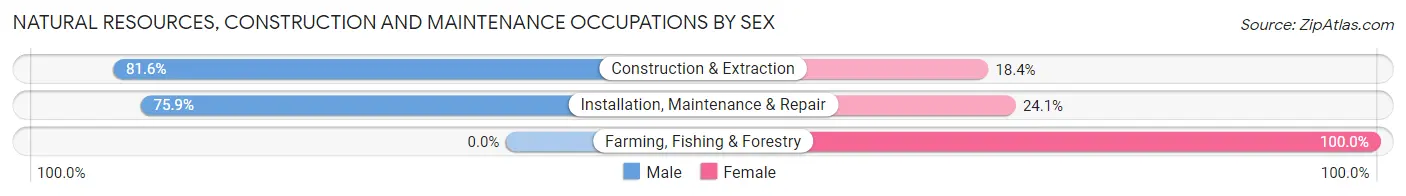
| Occupation | Male | Female |
| Farming, Fishing & Forestry | 0 (0.0%) | 36 (100.0%) |
| Construction & Extraction | 217 (81.6%) | 49 (18.4%) |
| Installation, Maintenance & Repair | 132 (75.9%) | 42 (24.1%) |
| Total (Category) | 349 (73.3%) | 127 (26.7%) |
| Total (Overall) | 2,090 (51.7%) | 1,949 (48.2%) |
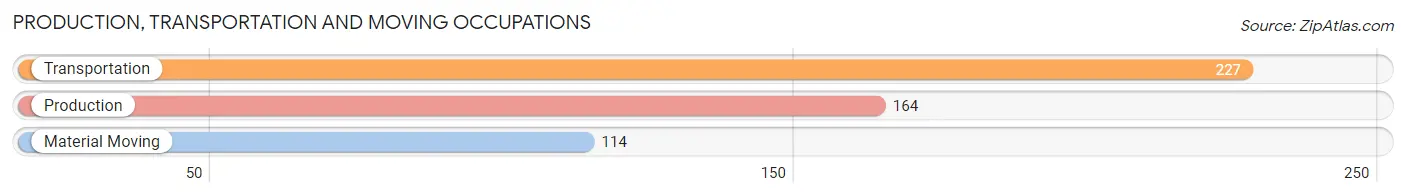
Production, Transportation and Moving Occupations
The most common Production, Transportation and Moving occupations in Pine Castle are Transportation (227 | 5.6%), Production (164 | 4.1%), and Material Moving (114 | 2.8%).
Production, Transportation and Moving Occupations by Sex
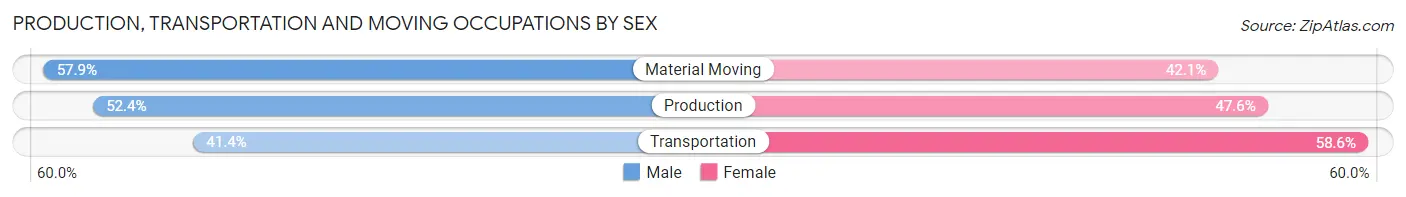
| Occupation | Male | Female |
| Production | 86 (52.4%) | 78 (47.6%) |
| Transportation | 94 (41.4%) | 133 (58.6%) |
| Material Moving | 66 (57.9%) | 48 (42.1%) |
| Total (Category) | 246 (48.7%) | 259 (51.3%) |
| Total (Overall) | 2,090 (51.7%) | 1,949 (48.2%) |
Employment Industries by Sex in Pine Castle
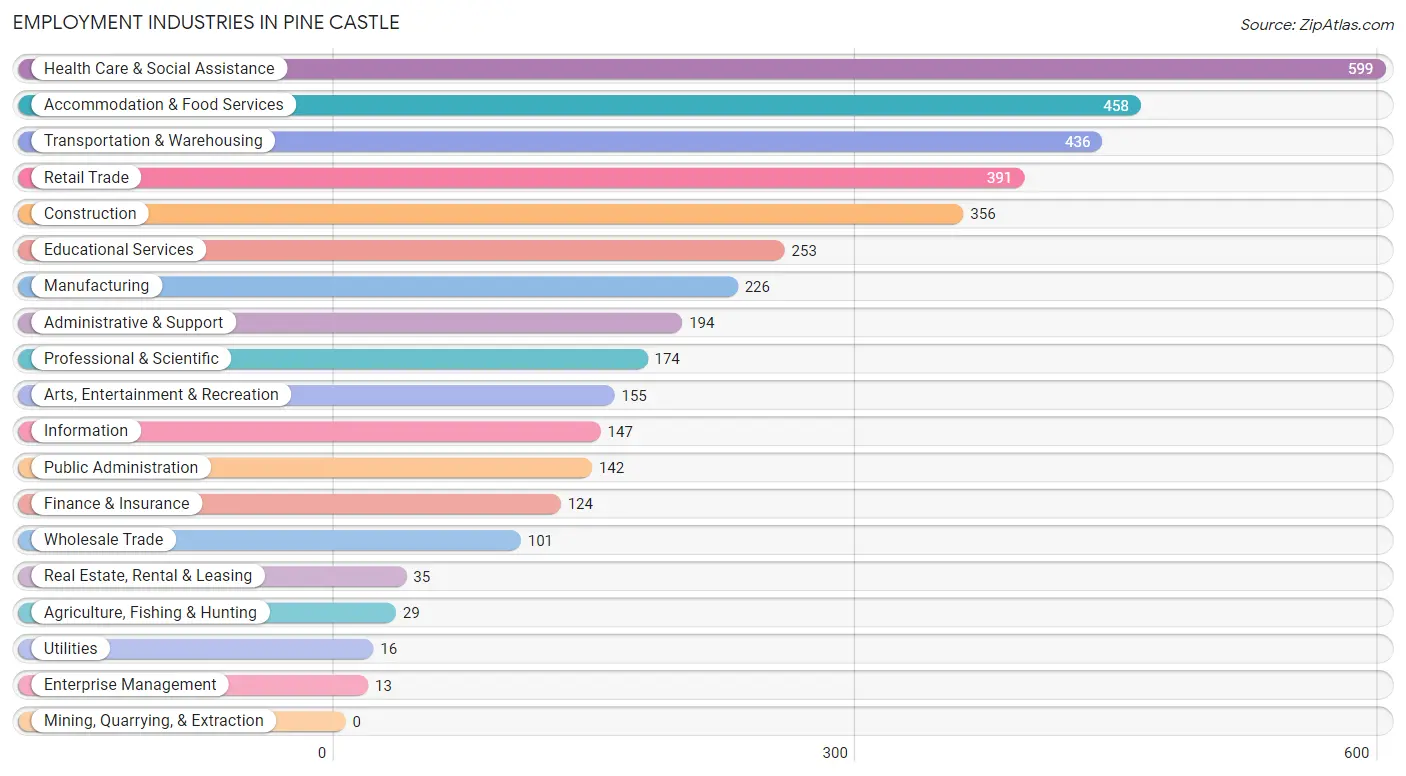
Employment Industries in Pine Castle
The major employment industries in Pine Castle include Health Care & Social Assistance (599 | 14.8%), Accommodation & Food Services (458 | 11.3%), Transportation & Warehousing (436 | 10.8%), Retail Trade (391 | 9.7%), and Construction (356 | 8.8%).
Employment Industries by Sex in Pine Castle
The Pine Castle industries that see more men than women are Utilities (100.0%), Enterprise Management (100.0%), and Wholesale Trade (91.1%), whereas the industries that tend to have a higher number of women are Agriculture, Fishing & Hunting (100.0%), Health Care & Social Assistance (78.3%), and Finance & Insurance (75.8%).
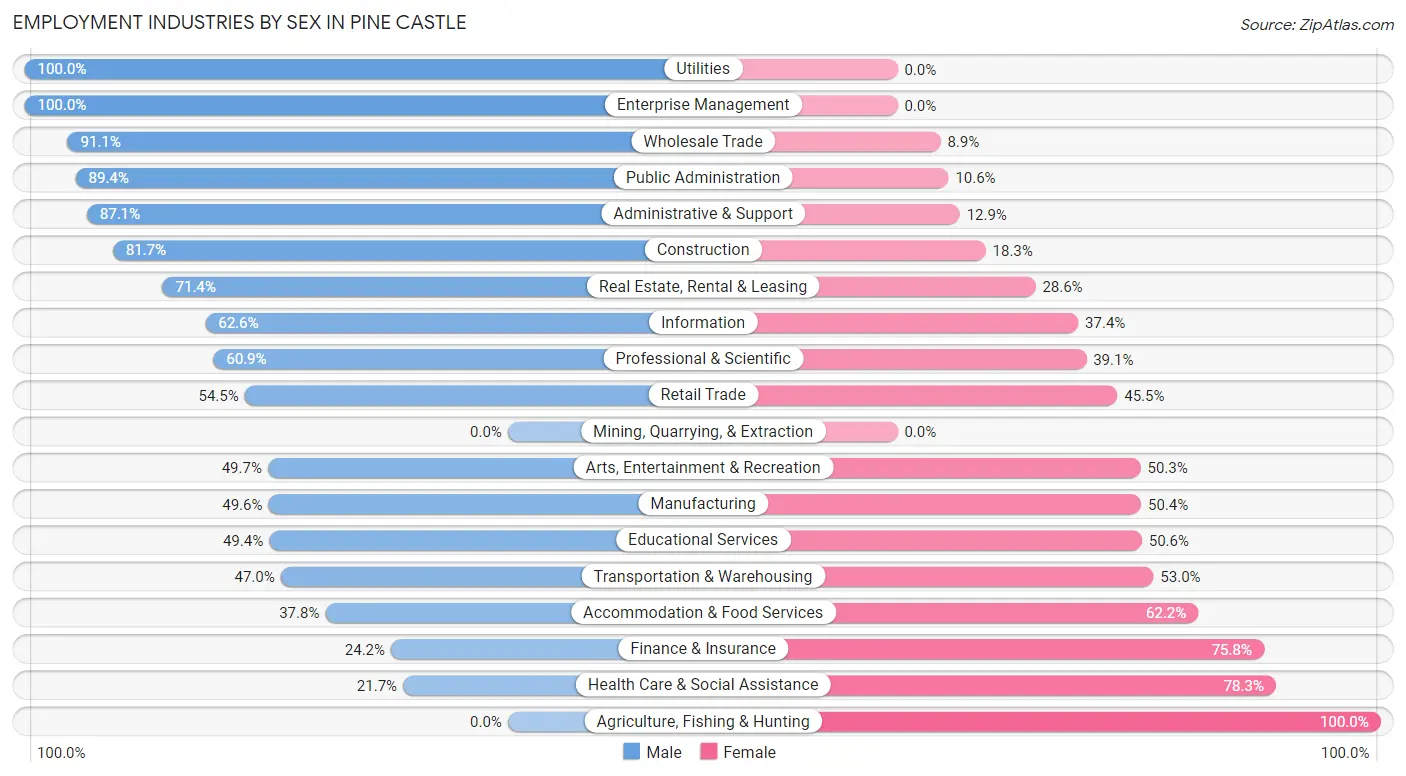
| Industry | Male | Female |
| Agriculture, Fishing & Hunting | 0 (0.0%) | 29 (100.0%) |
| Mining, Quarrying, & Extraction | 0 (0.0%) | 0 (0.0%) |
| Construction | 291 (81.7%) | 65 (18.3%) |
| Manufacturing | 112 (49.6%) | 114 (50.4%) |
| Wholesale Trade | 92 (91.1%) | 9 (8.9%) |
| Retail Trade | 213 (54.5%) | 178 (45.5%) |
| Transportation & Warehousing | 205 (47.0%) | 231 (53.0%) |
| Utilities | 16 (100.0%) | 0 (0.0%) |
| Information | 92 (62.6%) | 55 (37.4%) |
| Finance & Insurance | 30 (24.2%) | 94 (75.8%) |
| Real Estate, Rental & Leasing | 25 (71.4%) | 10 (28.6%) |
| Professional & Scientific | 106 (60.9%) | 68 (39.1%) |
| Enterprise Management | 13 (100.0%) | 0 (0.0%) |
| Administrative & Support | 169 (87.1%) | 25 (12.9%) |
| Educational Services | 125 (49.4%) | 128 (50.6%) |
| Health Care & Social Assistance | 130 (21.7%) | 469 (78.3%) |
| Arts, Entertainment & Recreation | 77 (49.7%) | 78 (50.3%) |
| Accommodation & Food Services | 173 (37.8%) | 285 (62.2%) |
| Public Administration | 127 (89.4%) | 15 (10.6%) |
| Total | 2,090 (51.7%) | 1,949 (48.2%) |
Education in Pine Castle
School Enrollment in Pine Castle
The most common levels of schooling among the 2,323 students in Pine Castle are elementary school (581 | 25.0%), middle school (577 | 24.8%), and college / undergraduate (380 | 16.4%).
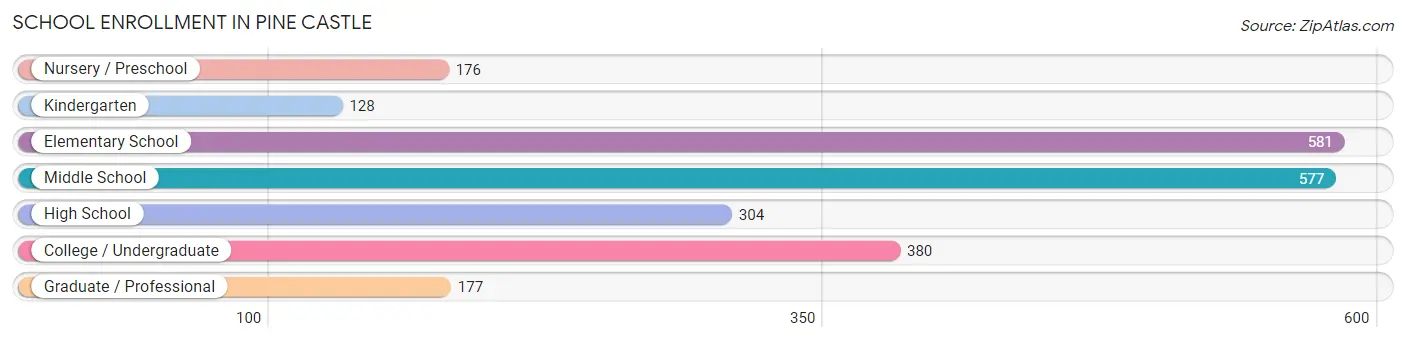
| School Level | # Students | % Students |
| Nursery / Preschool | 176 | 7.6% |
| Kindergarten | 128 | 5.5% |
| Elementary School | 581 | 25.0% |
| Middle School | 577 | 24.8% |
| High School | 304 | 13.1% |
| College / Undergraduate | 380 | 16.4% |
| Graduate / Professional | 177 | 7.6% |
| Total | 2,323 | 100.0% |
School Enrollment by Age by Funding Source in Pine Castle
Out of a total of 2,323 students who are enrolled in schools in Pine Castle, 367 (15.8%) attend a private institution, while the remaining 1,956 (84.2%) are enrolled in public schools. The age group of 3 to 4 year olds has the highest likelihood of being enrolled in private schools, with 55 (63.2% in the age bracket) enrolled. Conversely, the age group of 18 to 19 year olds has the lowest likelihood of being enrolled in a private school, with 46 (100.0% in the age bracket) attending a public institution.
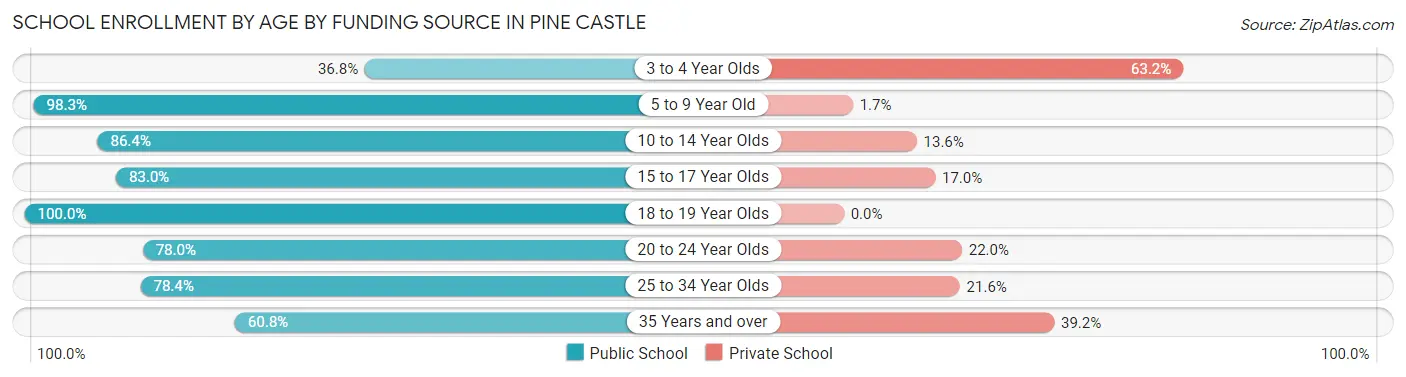
| Age Bracket | Public School | Private School |
| 3 to 4 Year Olds | 32 (36.8%) | 55 (63.2%) |
| 5 to 9 Year Old | 698 (98.3%) | 12 (1.7%) |
| 10 to 14 Year Olds | 553 (86.4%) | 87 (13.6%) |
| 15 to 17 Year Olds | 234 (83.0%) | 48 (17.0%) |
| 18 to 19 Year Olds | 46 (100.0%) | 0 (0.0%) |
| 20 to 24 Year Olds | 78 (78.0%) | 22 (22.0%) |
| 25 to 34 Year Olds | 167 (78.4%) | 46 (21.6%) |
| 35 Years and over | 149 (60.8%) | 96 (39.2%) |
| Total | 1,956 (84.2%) | 367 (15.8%) |
Educational Attainment by Field of Study in Pine Castle
Business (349 | 23.3%), science & technology (285 | 19.0%), social sciences (118 | 7.9%), education (109 | 7.3%), and arts & humanities (97 | 6.5%) are the most common fields of study among 1,498 individuals in Pine Castle who have obtained a bachelor's degree or higher.
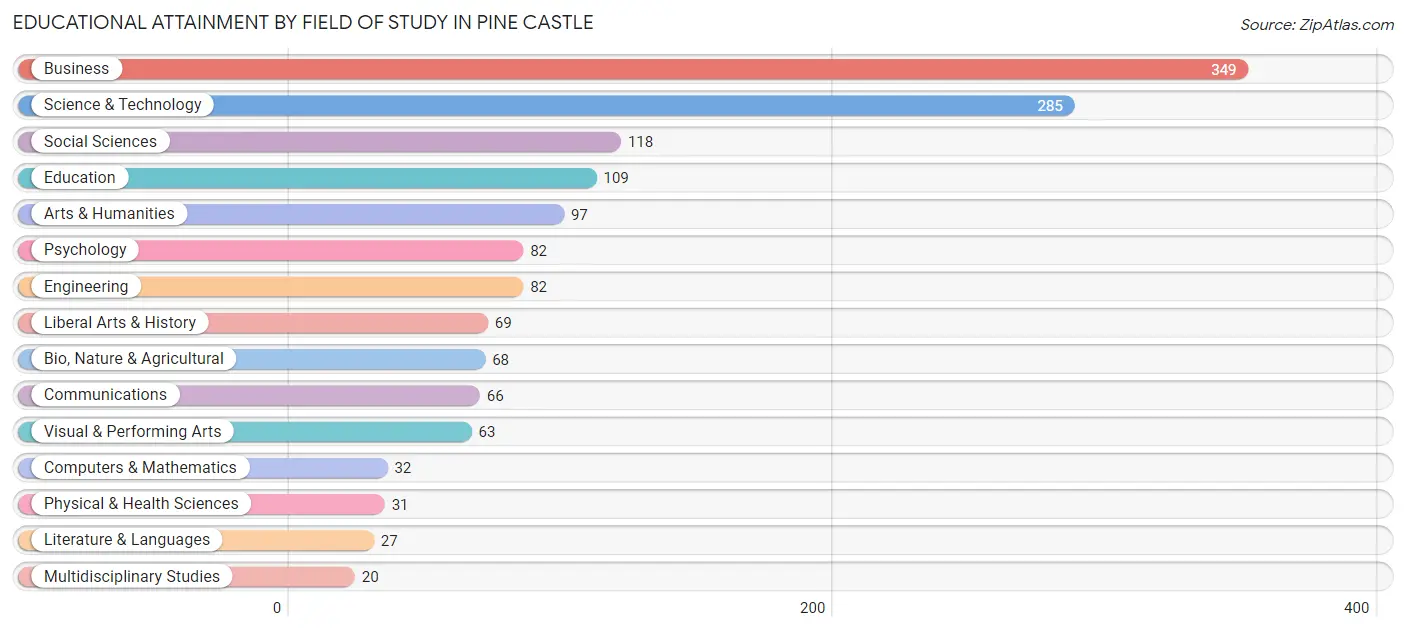
| Field of Study | # Graduates | % Graduates |
| Computers & Mathematics | 32 | 2.1% |
| Bio, Nature & Agricultural | 68 | 4.5% |
| Physical & Health Sciences | 31 | 2.1% |
| Psychology | 82 | 5.5% |
| Social Sciences | 118 | 7.9% |
| Engineering | 82 | 5.5% |
| Multidisciplinary Studies | 20 | 1.3% |
| Science & Technology | 285 | 19.0% |
| Business | 349 | 23.3% |
| Education | 109 | 7.3% |
| Literature & Languages | 27 | 1.8% |
| Liberal Arts & History | 69 | 4.6% |
| Visual & Performing Arts | 63 | 4.2% |
| Communications | 66 | 4.4% |
| Arts & Humanities | 97 | 6.5% |
| Total | 1,498 | 100.0% |
Transportation & Commute in Pine Castle
Vehicle Availability by Sex in Pine Castle
The most prevalent vehicle ownership categories in Pine Castle are males with 2 vehicles (1,049, accounting for 50.2%) and females with 2 vehicles (722, making up 54.6%).
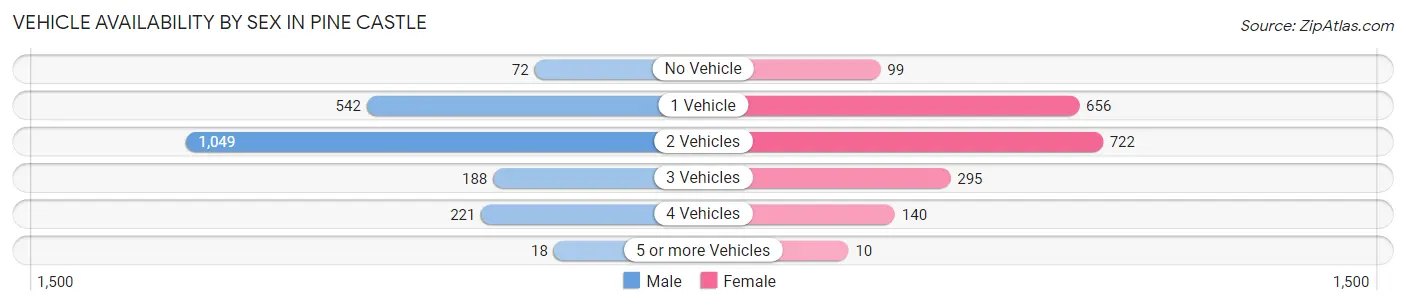
| Vehicles Available | Male | Female |
| No Vehicle | 72 (3.4%) | 99 (5.1%) |
| 1 Vehicle | 542 (25.9%) | 656 (34.1%) |
| 2 Vehicles | 1,049 (50.2%) | 722 (37.6%) |
| 3 Vehicles | 188 (9.0%) | 295 (15.3%) |
| 4 Vehicles | 221 (10.6%) | 140 (7.3%) |
| 5 or more Vehicles | 18 (0.9%) | 10 (0.5%) |
| Total | 2,090 (100.0%) | 1,922 (100.0%) |
Commute Time in Pine Castle
The most frequently occuring commute durations in Pine Castle are 20 to 24 minutes (831 commuters, 23.9%), 30 to 34 minutes (626 commuters, 18.0%), and 15 to 19 minutes (425 commuters, 12.2%).
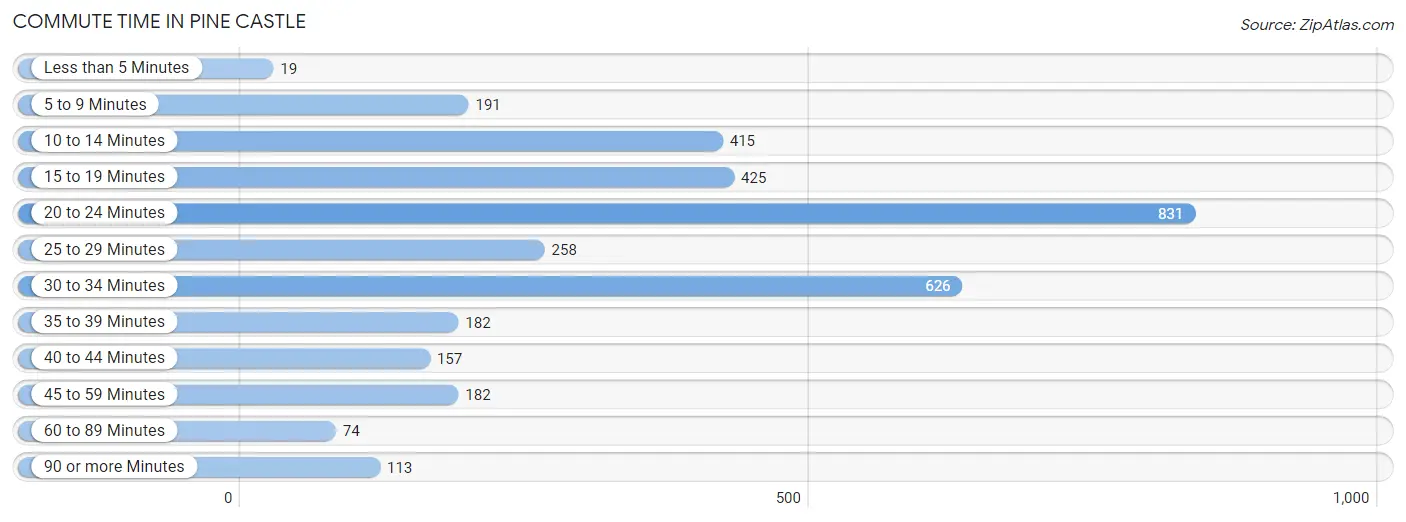
| Commute Time | # Commuters | % Commuters |
| Less than 5 Minutes | 19 | 0.5% |
| 5 to 9 Minutes | 191 | 5.5% |
| 10 to 14 Minutes | 415 | 11.9% |
| 15 to 19 Minutes | 425 | 12.2% |
| 20 to 24 Minutes | 831 | 23.9% |
| 25 to 29 Minutes | 258 | 7.4% |
| 30 to 34 Minutes | 626 | 18.0% |
| 35 to 39 Minutes | 182 | 5.2% |
| 40 to 44 Minutes | 157 | 4.5% |
| 45 to 59 Minutes | 182 | 5.2% |
| 60 to 89 Minutes | 74 | 2.1% |
| 90 or more Minutes | 113 | 3.3% |
Commute Time by Sex in Pine Castle
The most common commute times in Pine Castle are 20 to 24 minutes (453 commuters, 25.7%) for males and 20 to 24 minutes (378 commuters, 22.1%) for females.
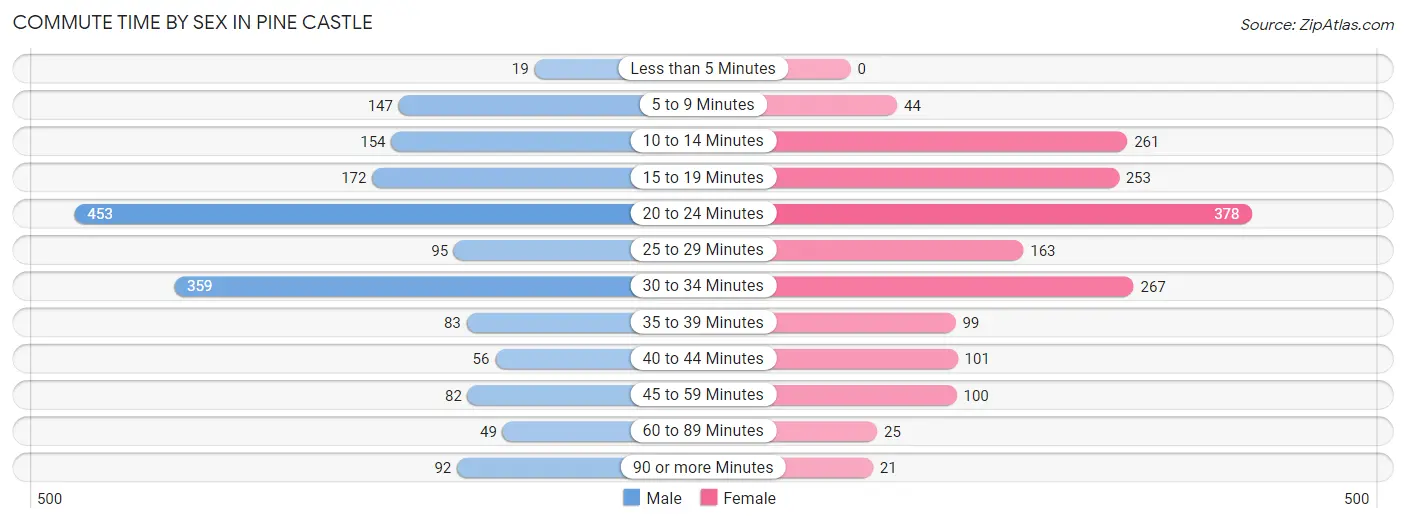
| Commute Time | Male | Female |
| Less than 5 Minutes | 19 (1.1%) | 0 (0.0%) |
| 5 to 9 Minutes | 147 (8.4%) | 44 (2.6%) |
| 10 to 14 Minutes | 154 (8.7%) | 261 (15.2%) |
| 15 to 19 Minutes | 172 (9.8%) | 253 (14.8%) |
| 20 to 24 Minutes | 453 (25.7%) | 378 (22.1%) |
| 25 to 29 Minutes | 95 (5.4%) | 163 (9.5%) |
| 30 to 34 Minutes | 359 (20.4%) | 267 (15.6%) |
| 35 to 39 Minutes | 83 (4.7%) | 99 (5.8%) |
| 40 to 44 Minutes | 56 (3.2%) | 101 (5.9%) |
| 45 to 59 Minutes | 82 (4.7%) | 100 (5.8%) |
| 60 to 89 Minutes | 49 (2.8%) | 25 (1.5%) |
| 90 or more Minutes | 92 (5.2%) | 21 (1.2%) |
Time of Departure to Work by Sex in Pine Castle
The most frequent times of departure to work in Pine Castle are 7:00 AM to 7:29 AM (410, 23.3%) for males and 8:00 AM to 8:29 AM (342, 20.0%) for females.
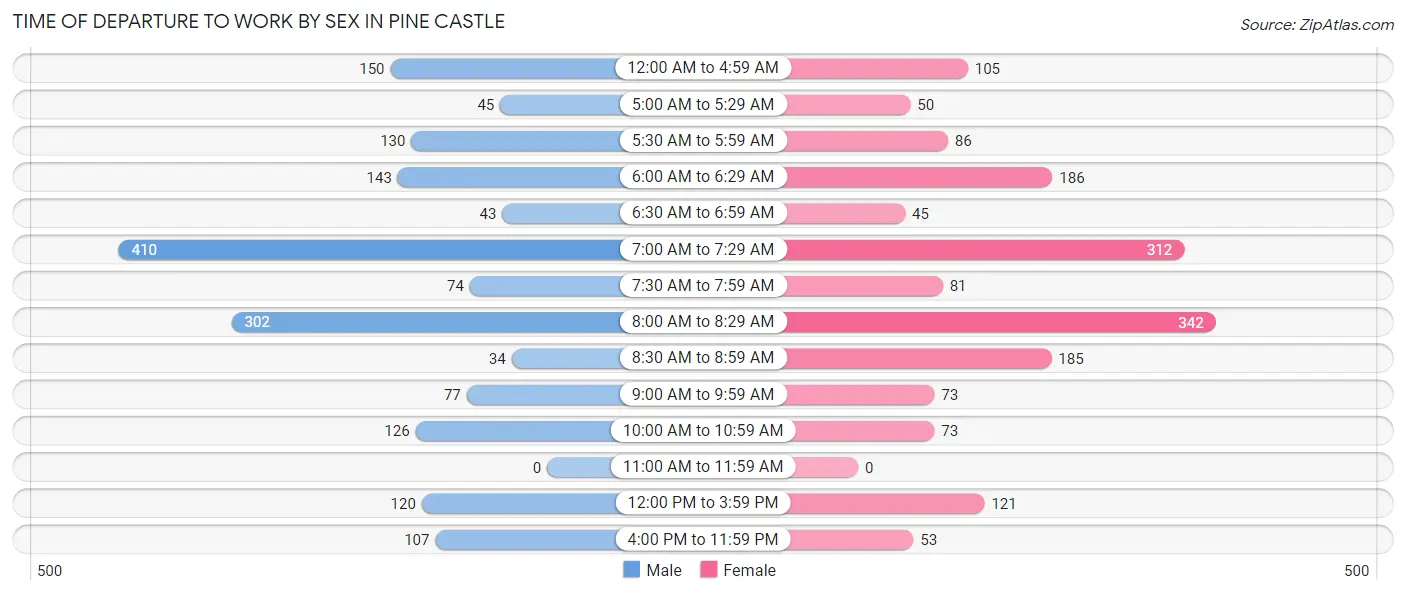
| Time of Departure | Male | Female |
| 12:00 AM to 4:59 AM | 150 (8.5%) | 105 (6.1%) |
| 5:00 AM to 5:29 AM | 45 (2.6%) | 50 (2.9%) |
| 5:30 AM to 5:59 AM | 130 (7.4%) | 86 (5.0%) |
| 6:00 AM to 6:29 AM | 143 (8.1%) | 186 (10.9%) |
| 6:30 AM to 6:59 AM | 43 (2.4%) | 45 (2.6%) |
| 7:00 AM to 7:29 AM | 410 (23.3%) | 312 (18.2%) |
| 7:30 AM to 7:59 AM | 74 (4.2%) | 81 (4.7%) |
| 8:00 AM to 8:29 AM | 302 (17.2%) | 342 (20.0%) |
| 8:30 AM to 8:59 AM | 34 (1.9%) | 185 (10.8%) |
| 9:00 AM to 9:59 AM | 77 (4.4%) | 73 (4.3%) |
| 10:00 AM to 10:59 AM | 126 (7.2%) | 73 (4.3%) |
| 11:00 AM to 11:59 AM | 0 (0.0%) | 0 (0.0%) |
| 12:00 PM to 3:59 PM | 120 (6.8%) | 121 (7.1%) |
| 4:00 PM to 11:59 PM | 107 (6.1%) | 53 (3.1%) |
| Total | 1,761 (100.0%) | 1,712 (100.0%) |
Housing Occupancy in Pine Castle
Occupancy by Ownership in Pine Castle
Of the total 3,325 dwellings in Pine Castle, owner-occupied units account for 1,594 (47.9%), while renter-occupied units make up 1,731 (52.1%).
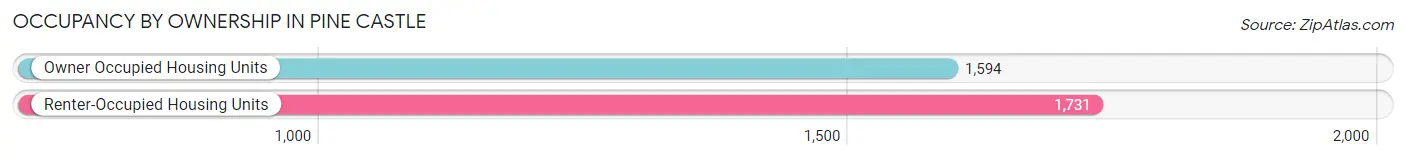
| Occupancy | # Housing Units | % Housing Units |
| Owner Occupied Housing Units | 1,594 | 47.9% |
| Renter-Occupied Housing Units | 1,731 | 52.1% |
| Total Occupied Housing Units | 3,325 | 100.0% |
Occupancy by Household Size in Pine Castle
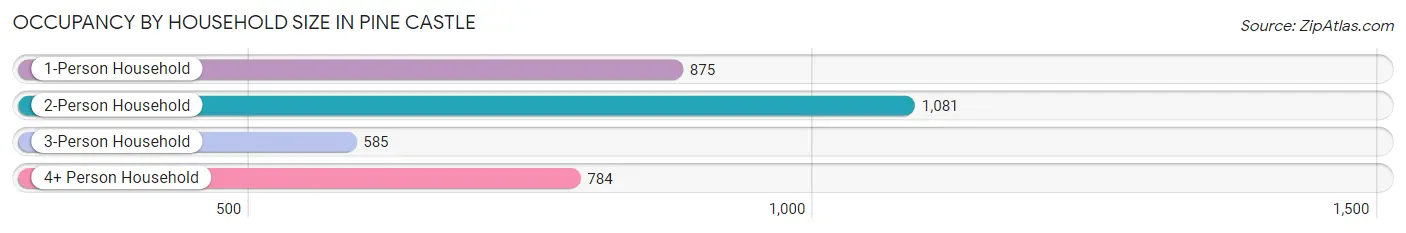
| Household Size | # Housing Units | % Housing Units |
| 1-Person Household | 875 | 26.3% |
| 2-Person Household | 1,081 | 32.5% |
| 3-Person Household | 585 | 17.6% |
| 4+ Person Household | 784 | 23.6% |
| Total Housing Units | 3,325 | 100.0% |
Occupancy by Ownership by Household Size in Pine Castle
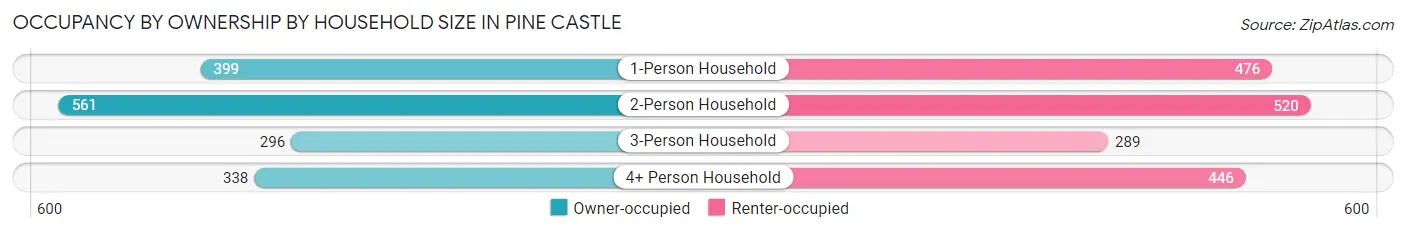
| Household Size | Owner-occupied | Renter-occupied |
| 1-Person Household | 399 (45.6%) | 476 (54.4%) |
| 2-Person Household | 561 (51.9%) | 520 (48.1%) |
| 3-Person Household | 296 (50.6%) | 289 (49.4%) |
| 4+ Person Household | 338 (43.1%) | 446 (56.9%) |
| Total Housing Units | 1,594 (47.9%) | 1,731 (52.1%) |
Occupancy by Educational Attainment in Pine Castle
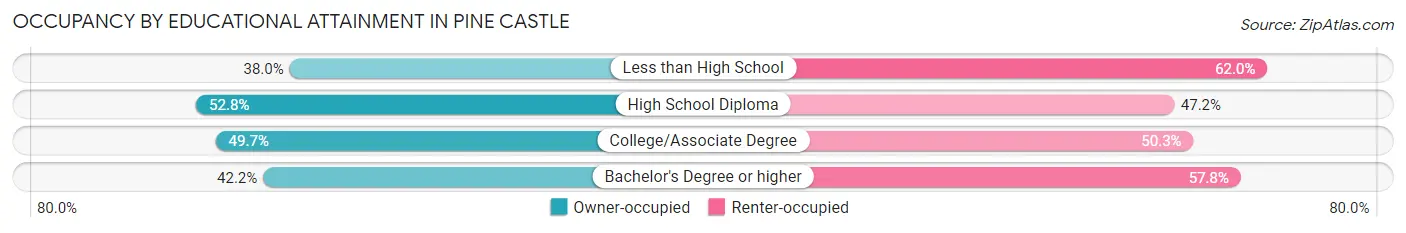
| Household Size | Owner-occupied | Renter-occupied |
| Less than High School | 158 (38.0%) | 258 (62.0%) |
| High School Diploma | 740 (52.8%) | 662 (47.2%) |
| College/Associate Degree | 400 (49.7%) | 405 (50.3%) |
| Bachelor's Degree or higher | 296 (42.2%) | 406 (57.8%) |
Occupancy by Age of Householder in Pine Castle
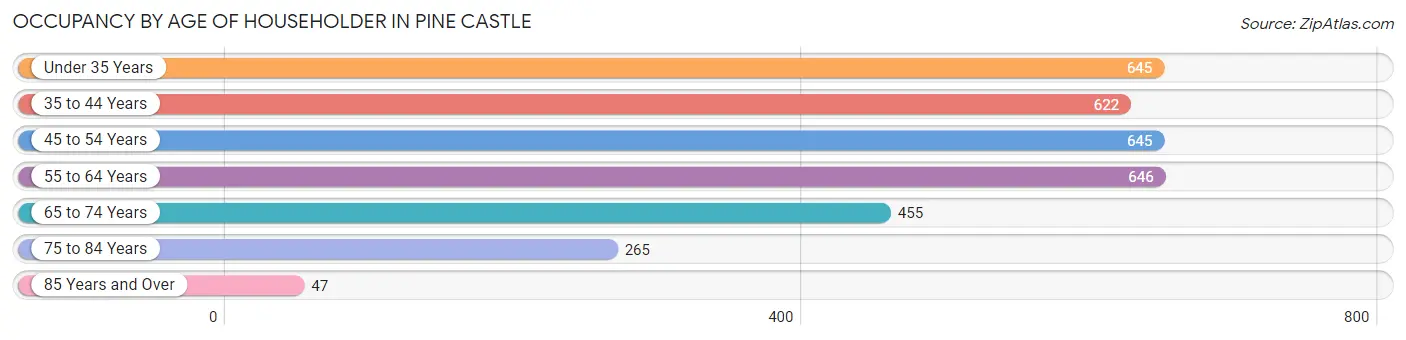
| Age Bracket | # Households | % Households |
| Under 35 Years | 645 | 19.4% |
| 35 to 44 Years | 622 | 18.7% |
| 45 to 54 Years | 645 | 19.4% |
| 55 to 64 Years | 646 | 19.4% |
| 65 to 74 Years | 455 | 13.7% |
| 75 to 84 Years | 265 | 8.0% |
| 85 Years and Over | 47 | 1.4% |
| Total | 3,325 | 100.0% |
Housing Finances in Pine Castle
Median Income by Occupancy in Pine Castle
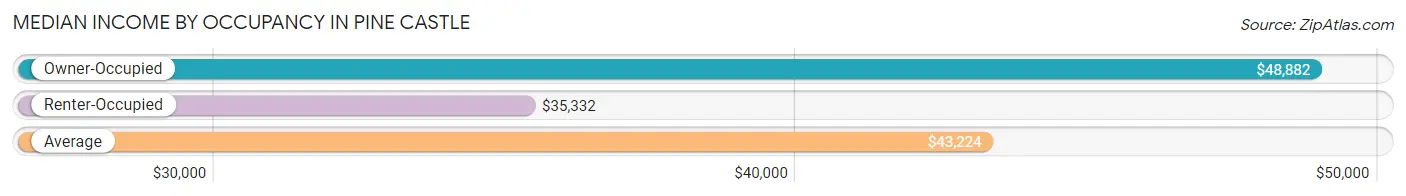
| Occupancy Type | # Households | Median Income |
| Owner-Occupied | 1,594 (47.9%) | $48,882 |
| Renter-Occupied | 1,731 (52.1%) | $35,332 |
| Average | 3,325 (100.0%) | $43,224 |
Occupancy by Householder Income Bracket in Pine Castle
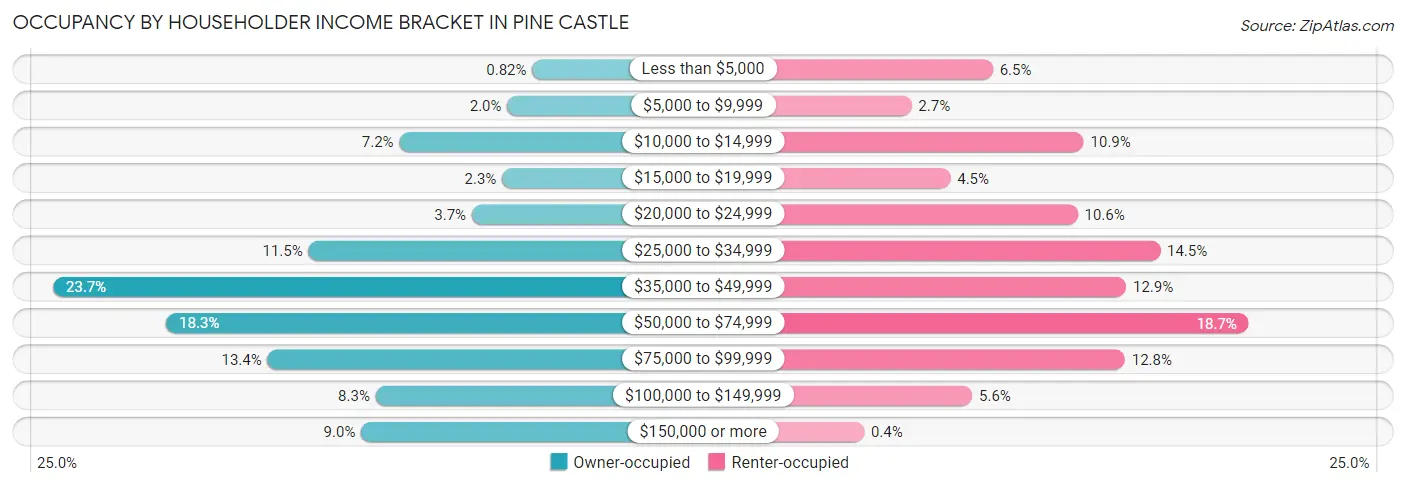
| Income Bracket | Owner-occupied | Renter-occupied |
| Less than $5,000 | 13 (0.8%) | 113 (6.5%) |
| $5,000 to $9,999 | 32 (2.0%) | 46 (2.7%) |
| $10,000 to $14,999 | 114 (7.1%) | 188 (10.9%) |
| $15,000 to $19,999 | 36 (2.3%) | 78 (4.5%) |
| $20,000 to $24,999 | 59 (3.7%) | 183 (10.6%) |
| $25,000 to $34,999 | 183 (11.5%) | 251 (14.5%) |
| $35,000 to $49,999 | 377 (23.6%) | 223 (12.9%) |
| $50,000 to $74,999 | 291 (18.3%) | 324 (18.7%) |
| $75,000 to $99,999 | 214 (13.4%) | 222 (12.8%) |
| $100,000 to $149,999 | 132 (8.3%) | 96 (5.6%) |
| $150,000 or more | 143 (9.0%) | 7 (0.4%) |
| Total | 1,594 (100.0%) | 1,731 (100.0%) |
Monthly Housing Cost Tiers in Pine Castle
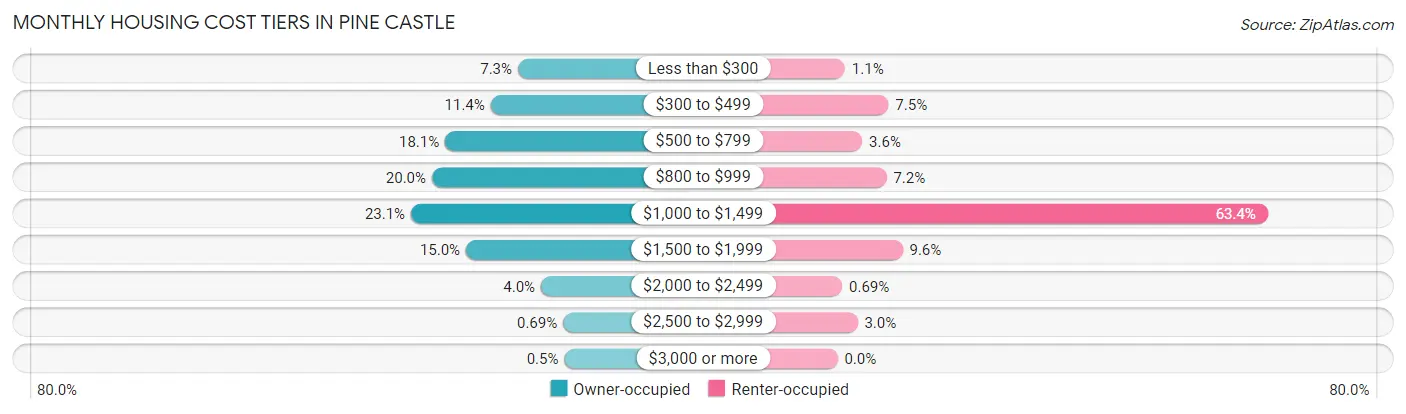
| Monthly Cost | Owner-occupied | Renter-occupied |
| Less than $300 | 117 (7.3%) | 19 (1.1%) |
| $300 to $499 | 181 (11.4%) | 130 (7.5%) |
| $500 to $799 | 288 (18.1%) | 63 (3.6%) |
| $800 to $999 | 319 (20.0%) | 125 (7.2%) |
| $1,000 to $1,499 | 368 (23.1%) | 1,097 (63.4%) |
| $1,500 to $1,999 | 239 (15.0%) | 166 (9.6%) |
| $2,000 to $2,499 | 63 (4.0%) | 12 (0.7%) |
| $2,500 to $2,999 | 11 (0.7%) | 51 (2.9%) |
| $3,000 or more | 8 (0.5%) | 0 (0.0%) |
| Total | 1,594 (100.0%) | 1,731 (100.0%) |
Physical Housing Characteristics in Pine Castle
Housing Structures in Pine Castle
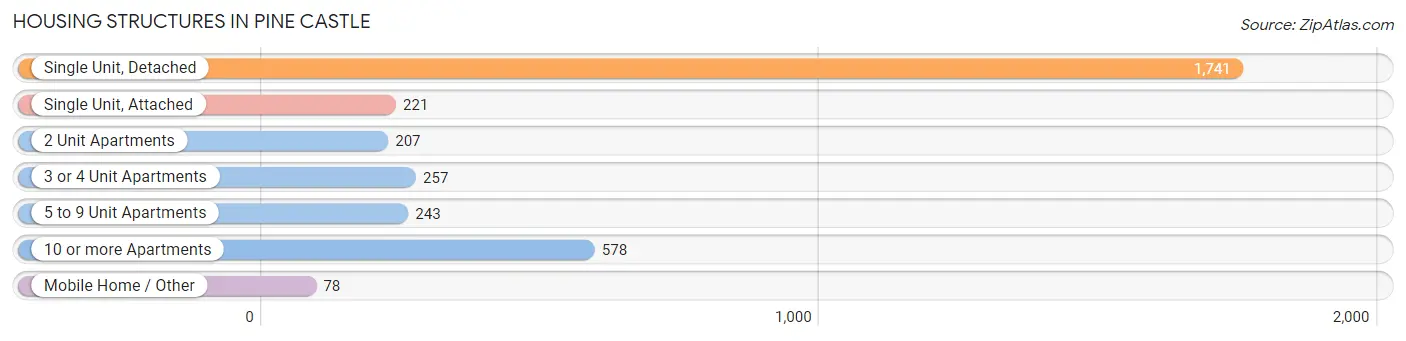
| Structure Type | # Housing Units | % Housing Units |
| Single Unit, Detached | 1,741 | 52.4% |
| Single Unit, Attached | 221 | 6.7% |
| 2 Unit Apartments | 207 | 6.2% |
| 3 or 4 Unit Apartments | 257 | 7.7% |
| 5 to 9 Unit Apartments | 243 | 7.3% |
| 10 or more Apartments | 578 | 17.4% |
| Mobile Home / Other | 78 | 2.4% |
| Total | 3,325 | 100.0% |
Housing Structures by Occupancy in Pine Castle
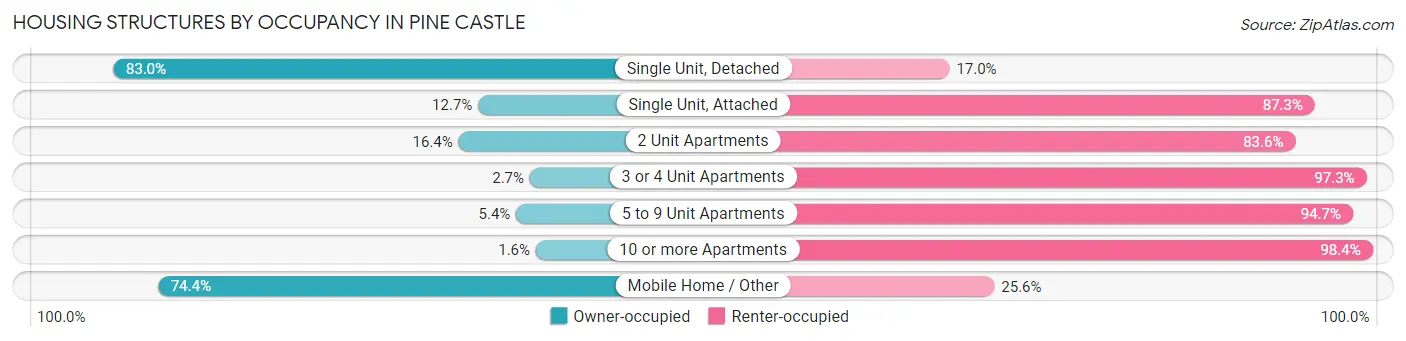
| Structure Type | Owner-occupied | Renter-occupied |
| Single Unit, Detached | 1,445 (83.0%) | 296 (17.0%) |
| Single Unit, Attached | 28 (12.7%) | 193 (87.3%) |
| 2 Unit Apartments | 34 (16.4%) | 173 (83.6%) |
| 3 or 4 Unit Apartments | 7 (2.7%) | 250 (97.3%) |
| 5 to 9 Unit Apartments | 13 (5.3%) | 230 (94.7%) |
| 10 or more Apartments | 9 (1.6%) | 569 (98.4%) |
| Mobile Home / Other | 58 (74.4%) | 20 (25.6%) |
| Total | 1,594 (47.9%) | 1,731 (52.1%) |
Housing Structures by Number of Rooms in Pine Castle
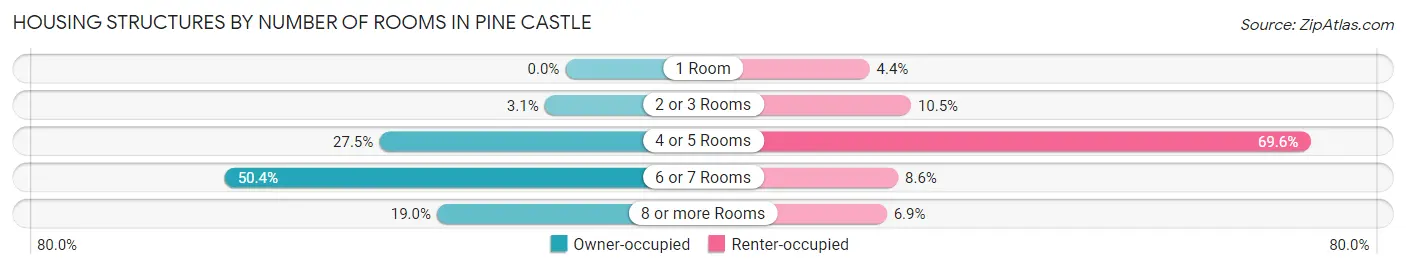
| Number of Rooms | Owner-occupied | Renter-occupied |
| 1 Room | 0 (0.0%) | 76 (4.4%) |
| 2 or 3 Rooms | 49 (3.1%) | 182 (10.5%) |
| 4 or 5 Rooms | 439 (27.5%) | 1,204 (69.6%) |
| 6 or 7 Rooms | 803 (50.4%) | 149 (8.6%) |
| 8 or more Rooms | 303 (19.0%) | 120 (6.9%) |
| Total | 1,594 (100.0%) | 1,731 (100.0%) |
Housing Structure by Heating Type in Pine Castle
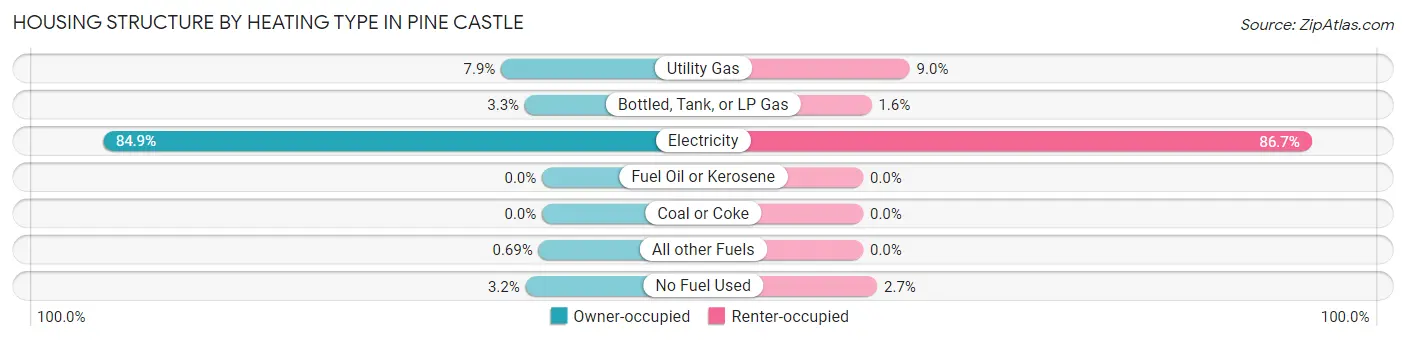
| Heating Type | Owner-occupied | Renter-occupied |
| Utility Gas | 126 (7.9%) | 156 (9.0%) |
| Bottled, Tank, or LP Gas | 53 (3.3%) | 28 (1.6%) |
| Electricity | 1,353 (84.9%) | 1,500 (86.7%) |
| Fuel Oil or Kerosene | 0 (0.0%) | 0 (0.0%) |
| Coal or Coke | 0 (0.0%) | 0 (0.0%) |
| All other Fuels | 11 (0.7%) | 0 (0.0%) |
| No Fuel Used | 51 (3.2%) | 47 (2.7%) |
| Total | 1,594 (100.0%) | 1,731 (100.0%) |
Household Vehicle Usage in Pine Castle
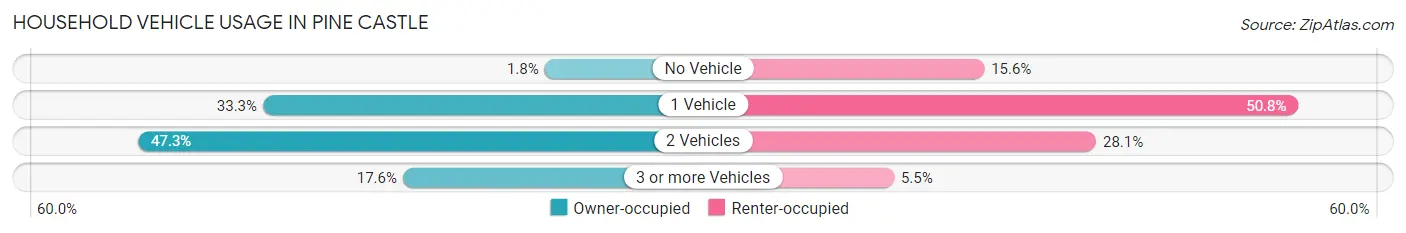
| Vehicles per Household | Owner-occupied | Renter-occupied |
| No Vehicle | 28 (1.8%) | 270 (15.6%) |
| 1 Vehicle | 531 (33.3%) | 879 (50.8%) |
| 2 Vehicles | 754 (47.3%) | 487 (28.1%) |
| 3 or more Vehicles | 281 (17.6%) | 95 (5.5%) |
| Total | 1,594 (100.0%) | 1,731 (100.0%) |
Real Estate & Mortgages in Pine Castle
Real Estate and Mortgage Overview in Pine Castle
| Characteristic | Without Mortgage | With Mortgage |
| Housing Units | 732 | 862 |
| Median Property Value | $222,700 | $253,800 |
| Median Household Income | $47,763 | $63 |
| Monthly Housing Costs | $553 | $8 |
| Real Estate Taxes | $1,293 | $86 |
Property Value by Mortgage Status in Pine Castle
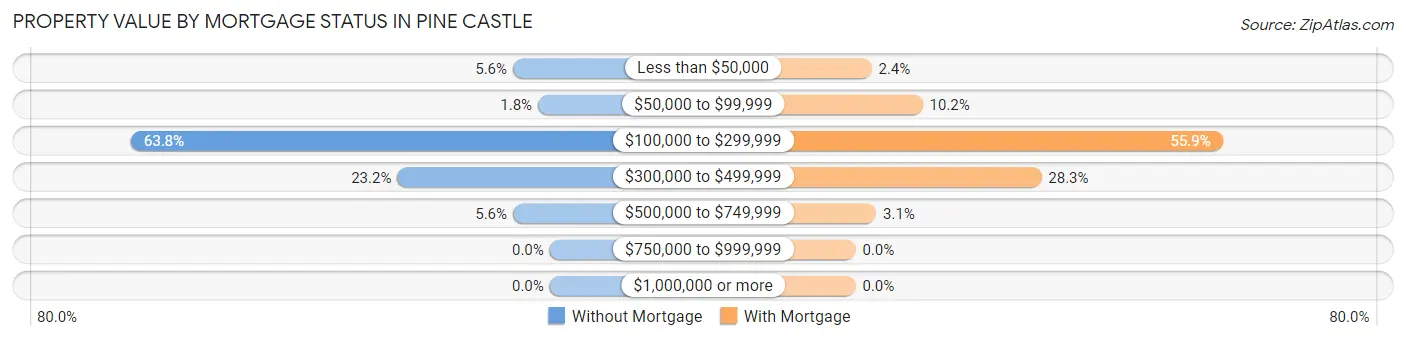
| Property Value | Without Mortgage | With Mortgage |
| Less than $50,000 | 41 (5.6%) | 21 (2.4%) |
| $50,000 to $99,999 | 13 (1.8%) | 88 (10.2%) |
| $100,000 to $299,999 | 467 (63.8%) | 482 (55.9%) |
| $300,000 to $499,999 | 170 (23.2%) | 244 (28.3%) |
| $500,000 to $749,999 | 41 (5.6%) | 27 (3.1%) |
| $750,000 to $999,999 | 0 (0.0%) | 0 (0.0%) |
| $1,000,000 or more | 0 (0.0%) | 0 (0.0%) |
| Total | 732 (100.0%) | 862 (100.0%) |
Household Income by Mortgage Status in Pine Castle
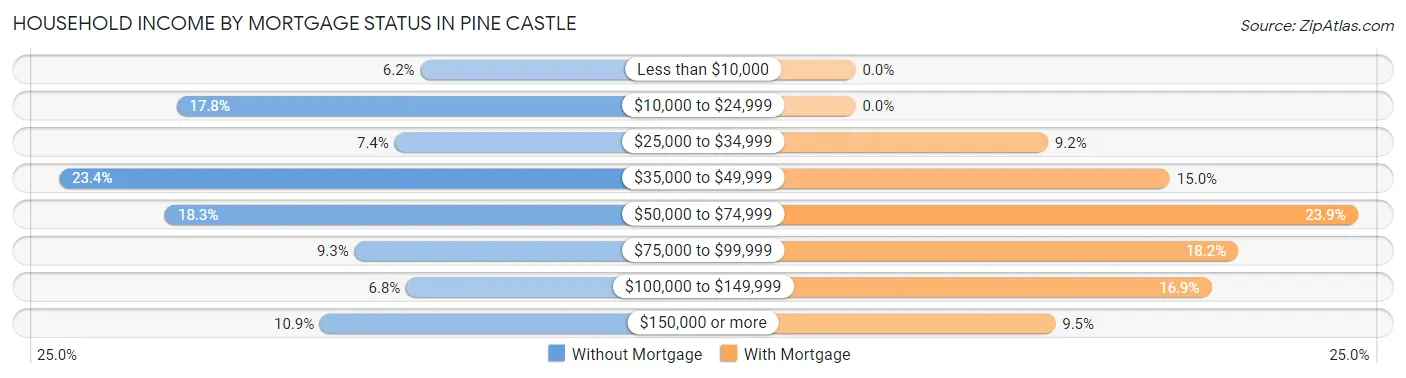
| Household Income | Without Mortgage | With Mortgage |
| Less than $10,000 | 45 (6.1%) | 0 (0.0%) |
| $10,000 to $24,999 | 130 (17.8%) | 0 (0.0%) |
| $25,000 to $34,999 | 54 (7.4%) | 79 (9.2%) |
| $35,000 to $49,999 | 171 (23.4%) | 129 (15.0%) |
| $50,000 to $74,999 | 134 (18.3%) | 206 (23.9%) |
| $75,000 to $99,999 | 68 (9.3%) | 157 (18.2%) |
| $100,000 to $149,999 | 50 (6.8%) | 146 (16.9%) |
| $150,000 or more | 80 (10.9%) | 82 (9.5%) |
| Total | 732 (100.0%) | 862 (100.0%) |
Property Value to Household Income Ratio in Pine Castle
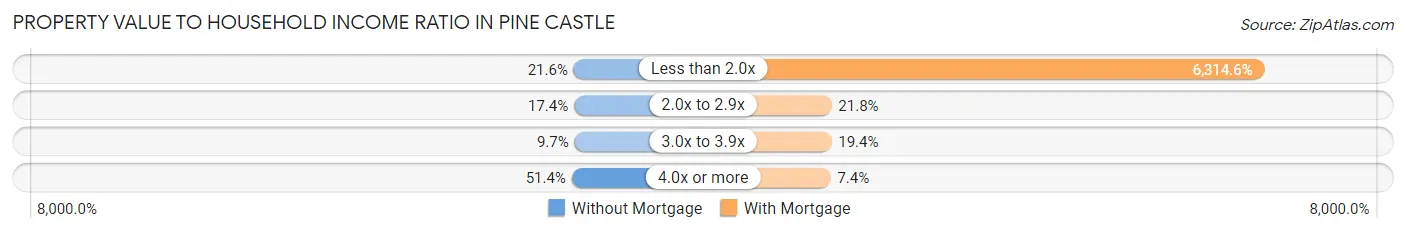
| Value-to-Income Ratio | Without Mortgage | With Mortgage |
| Less than 2.0x | 158 (21.6%) | 54,432 (6,314.6%) |
| 2.0x to 2.9x | 127 (17.3%) | 188 (21.8%) |
| 3.0x to 3.9x | 71 (9.7%) | 167 (19.4%) |
| 4.0x or more | 376 (51.4%) | 64 (7.4%) |
| Total | 732 (100.0%) | 862 (100.0%) |
Real Estate Taxes by Mortgage Status in Pine Castle
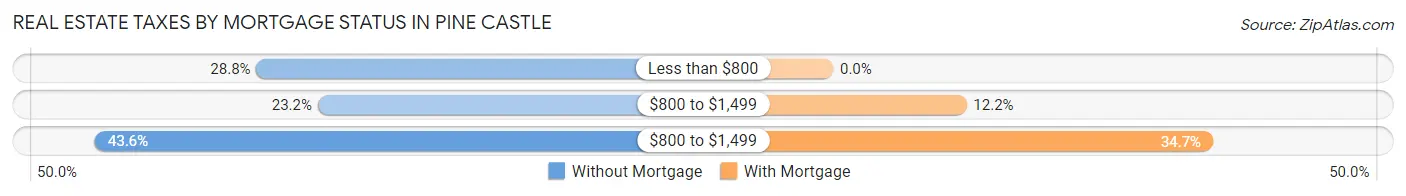
| Property Taxes | Without Mortgage | With Mortgage |
| Less than $800 | 211 (28.8%) | 0 (0.0%) |
| $800 to $1,499 | 170 (23.2%) | 105 (12.2%) |
| $800 to $1,499 | 319 (43.6%) | 299 (34.7%) |
| Total | 732 (100.0%) | 862 (100.0%) |
Health & Disability in Pine Castle
Health Insurance Coverage by Age in Pine Castle
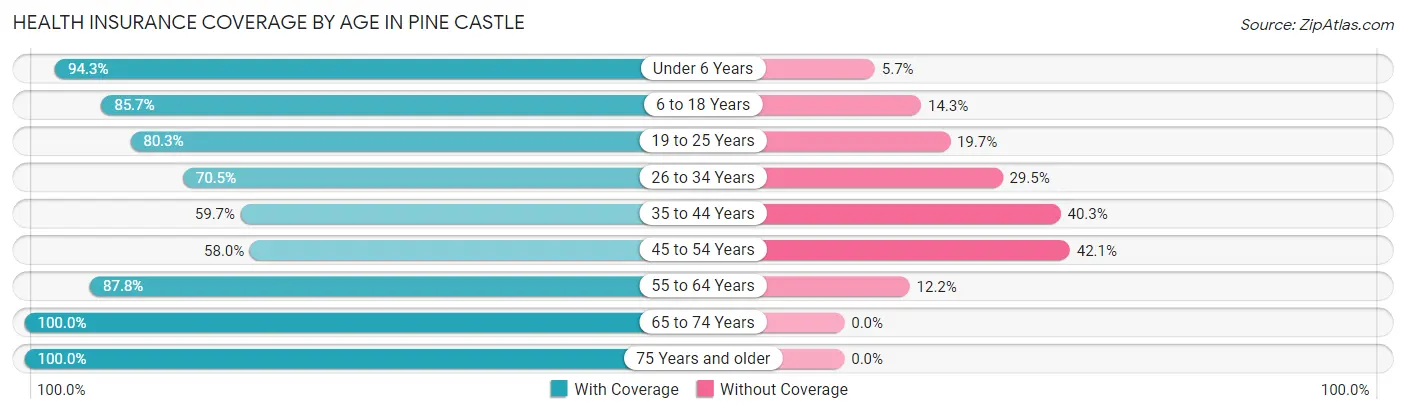
| Age Bracket | With Coverage | Without Coverage |
| Under 6 Years | 746 (94.3%) | 45 (5.7%) |
| 6 to 18 Years | 1,341 (85.7%) | 224 (14.3%) |
| 19 to 25 Years | 391 (80.3%) | 96 (19.7%) |
| 26 to 34 Years | 908 (70.5%) | 380 (29.5%) |
| 35 to 44 Years | 864 (59.7%) | 584 (40.3%) |
| 45 to 54 Years | 882 (58.0%) | 640 (42.0%) |
| 55 to 64 Years | 880 (87.8%) | 122 (12.2%) |
| 65 to 74 Years | 871 (100.0%) | 0 (0.0%) |
| 75 Years and older | 582 (100.0%) | 0 (0.0%) |
| Total | 7,465 (78.1%) | 2,091 (21.9%) |
Health Insurance Coverage by Citizenship Status in Pine Castle
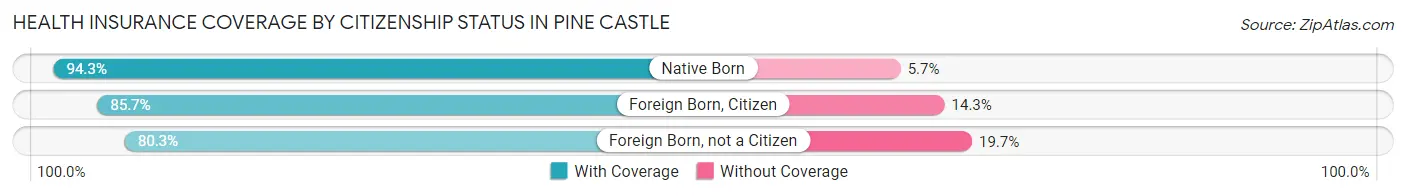
| Citizenship Status | With Coverage | Without Coverage |
| Native Born | 746 (94.3%) | 45 (5.7%) |
| Foreign Born, Citizen | 1,341 (85.7%) | 224 (14.3%) |
| Foreign Born, not a Citizen | 391 (80.3%) | 96 (19.7%) |
Health Insurance Coverage by Household Income in Pine Castle
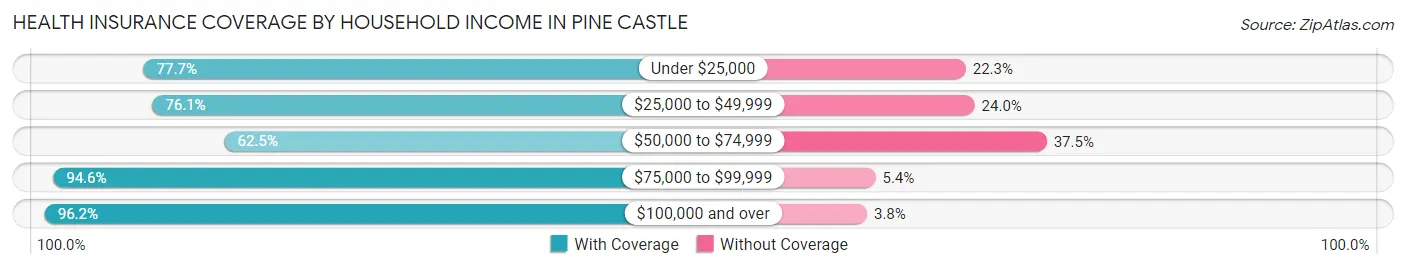
| Household Income | With Coverage | Without Coverage |
| Under $25,000 | 1,397 (77.7%) | 401 (22.3%) |
| $25,000 to $49,999 | 1,934 (76.0%) | 609 (23.9%) |
| $50,000 to $74,999 | 1,601 (62.5%) | 959 (37.5%) |
| $75,000 to $99,999 | 1,264 (94.6%) | 72 (5.4%) |
| $100,000 and over | 1,269 (96.2%) | 50 (3.8%) |
Public vs Private Health Insurance Coverage by Age in Pine Castle
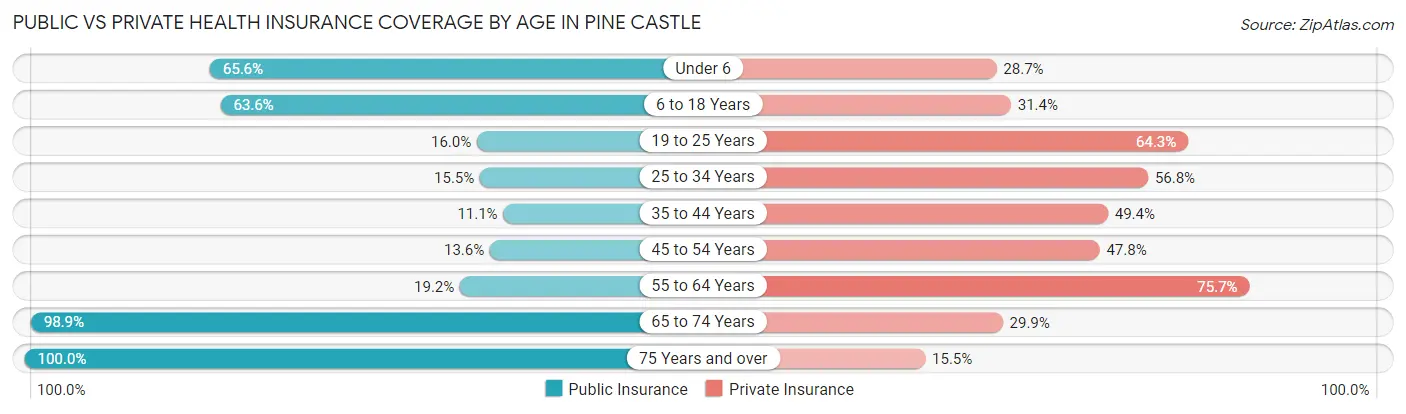
| Age Bracket | Public Insurance | Private Insurance |
| Under 6 | 519 (65.6%) | 227 (28.7%) |
| 6 to 18 Years | 996 (63.6%) | 491 (31.4%) |
| 19 to 25 Years | 78 (16.0%) | 313 (64.3%) |
| 25 to 34 Years | 199 (15.4%) | 732 (56.8%) |
| 35 to 44 Years | 161 (11.1%) | 715 (49.4%) |
| 45 to 54 Years | 207 (13.6%) | 728 (47.8%) |
| 55 to 64 Years | 192 (19.2%) | 758 (75.6%) |
| 65 to 74 Years | 861 (98.9%) | 260 (29.8%) |
| 75 Years and over | 582 (100.0%) | 90 (15.5%) |
| Total | 3,795 (39.7%) | 4,314 (45.1%) |
Disability Status by Sex by Age in Pine Castle
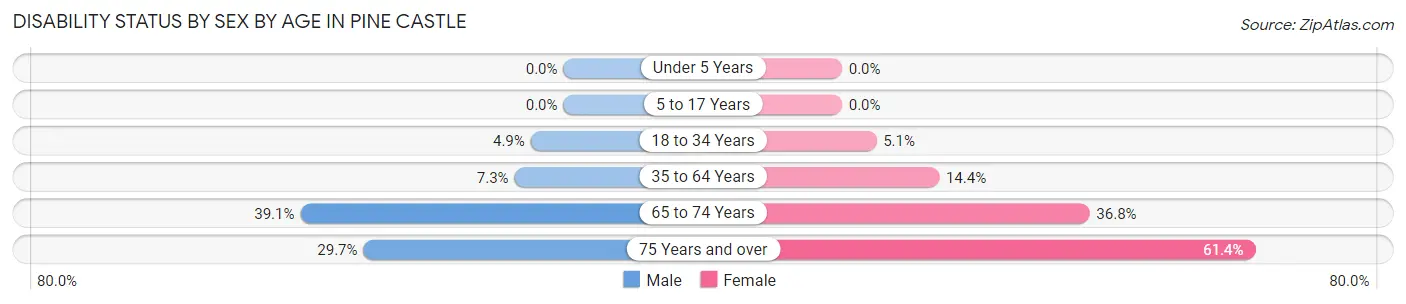
| Age Bracket | Male | Female |
| Under 5 Years | 0 (0.0%) | 0 (0.0%) |
| 5 to 17 Years | 0 (0.0%) | 0 (0.0%) |
| 18 to 34 Years | 34 (4.9%) | 57 (5.1%) |
| 35 to 64 Years | 151 (7.3%) | 273 (14.4%) |
| 65 to 74 Years | 200 (39.1%) | 132 (36.8%) |
| 75 Years and over | 109 (29.7%) | 132 (61.4%) |
Disability Class by Sex by Age in Pine Castle
Disability Class: Hearing Difficulty
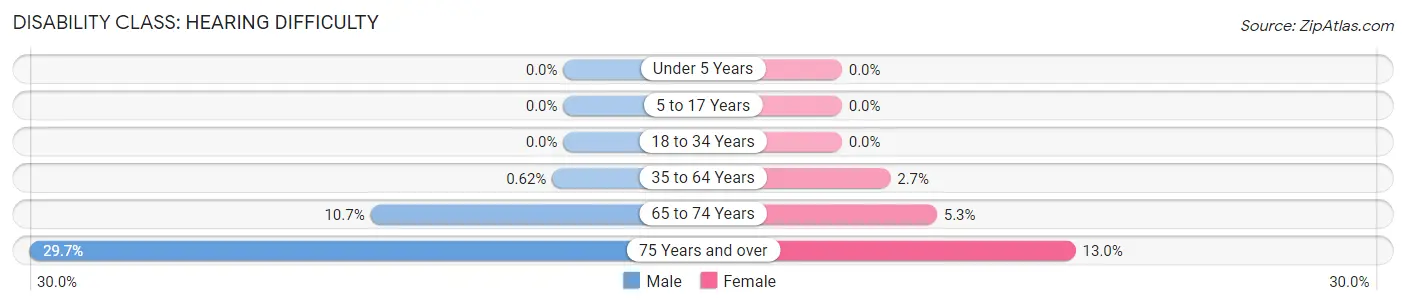
| Age Bracket | Male | Female |
| Under 5 Years | 0 (0.0%) | 0 (0.0%) |
| 5 to 17 Years | 0 (0.0%) | 0 (0.0%) |
| 18 to 34 Years | 0 (0.0%) | 0 (0.0%) |
| 35 to 64 Years | 13 (0.6%) | 51 (2.7%) |
| 65 to 74 Years | 55 (10.7%) | 19 (5.3%) |
| 75 Years and over | 109 (29.7%) | 28 (13.0%) |
Disability Class: Vision Difficulty
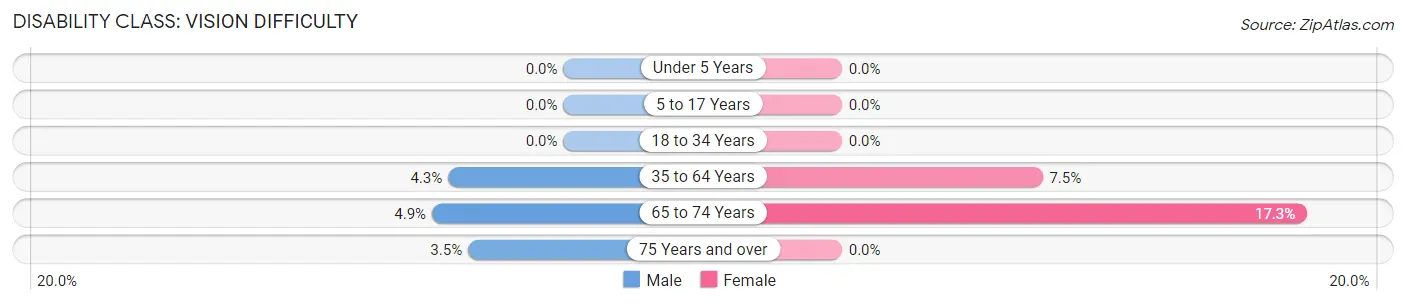
| Age Bracket | Male | Female |
| Under 5 Years | 0 (0.0%) | 0 (0.0%) |
| 5 to 17 Years | 0 (0.0%) | 0 (0.0%) |
| 18 to 34 Years | 0 (0.0%) | 0 (0.0%) |
| 35 to 64 Years | 89 (4.3%) | 141 (7.4%) |
| 65 to 74 Years | 25 (4.9%) | 62 (17.3%) |
| 75 Years and over | 13 (3.5%) | 0 (0.0%) |
Disability Class: Cognitive Difficulty
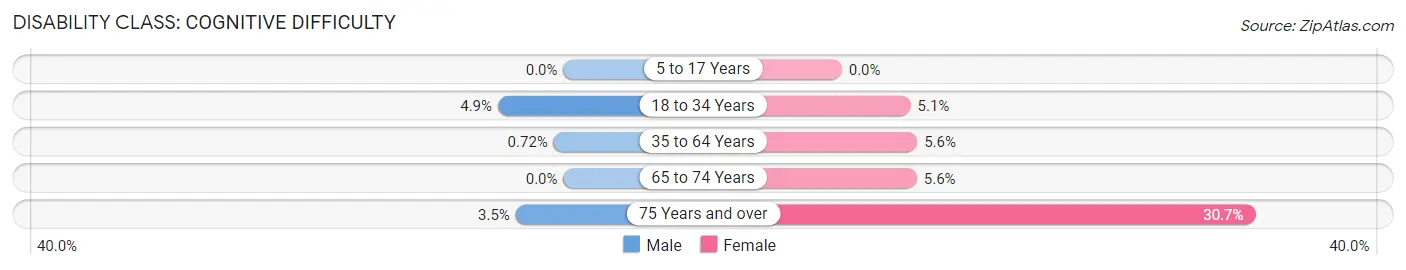
| Age Bracket | Male | Female |
| 5 to 17 Years | 0 (0.0%) | 0 (0.0%) |
| 18 to 34 Years | 34 (4.9%) | 57 (5.1%) |
| 35 to 64 Years | 15 (0.7%) | 106 (5.6%) |
| 65 to 74 Years | 0 (0.0%) | 20 (5.6%) |
| 75 Years and over | 13 (3.5%) | 66 (30.7%) |
Disability Class: Ambulatory Difficulty
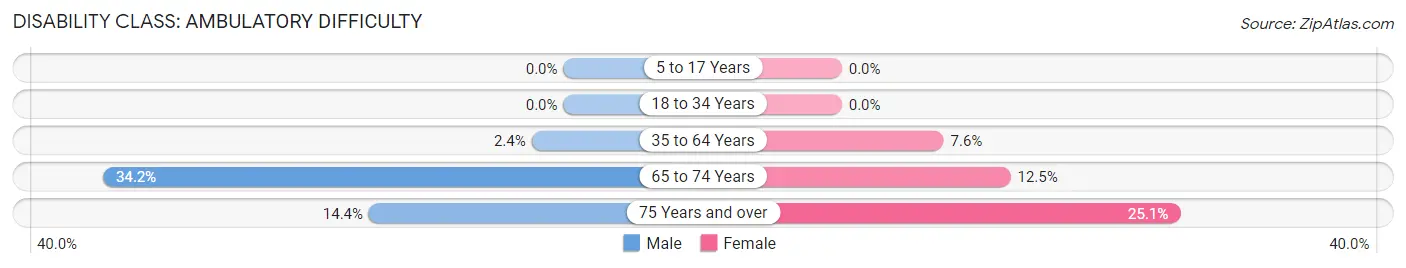
| Age Bracket | Male | Female |
| 5 to 17 Years | 0 (0.0%) | 0 (0.0%) |
| 18 to 34 Years | 0 (0.0%) | 0 (0.0%) |
| 35 to 64 Years | 49 (2.4%) | 143 (7.6%) |
| 65 to 74 Years | 175 (34.2%) | 45 (12.5%) |
| 75 Years and over | 53 (14.4%) | 54 (25.1%) |
Disability Class: Self-Care Difficulty
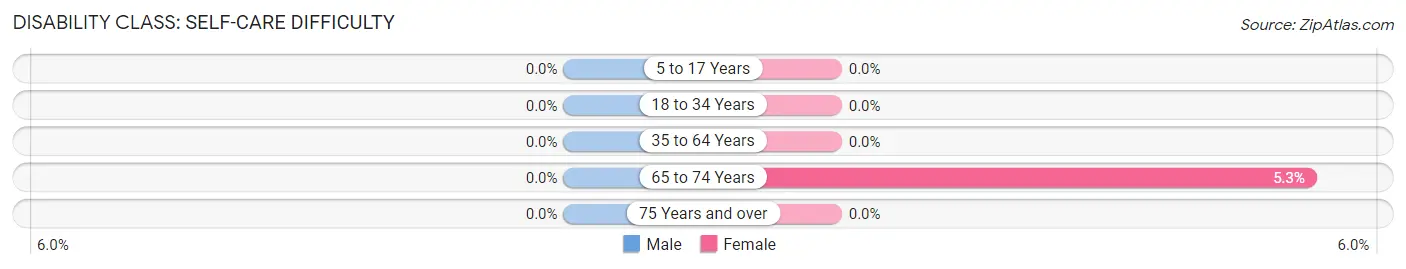
| Age Bracket | Male | Female |
| 5 to 17 Years | 0 (0.0%) | 0 (0.0%) |
| 18 to 34 Years | 0 (0.0%) | 0 (0.0%) |
| 35 to 64 Years | 0 (0.0%) | 0 (0.0%) |
| 65 to 74 Years | 0 (0.0%) | 19 (5.3%) |
| 75 Years and over | 0 (0.0%) | 0 (0.0%) |
Technology Access in Pine Castle
Computing Device Access in Pine Castle
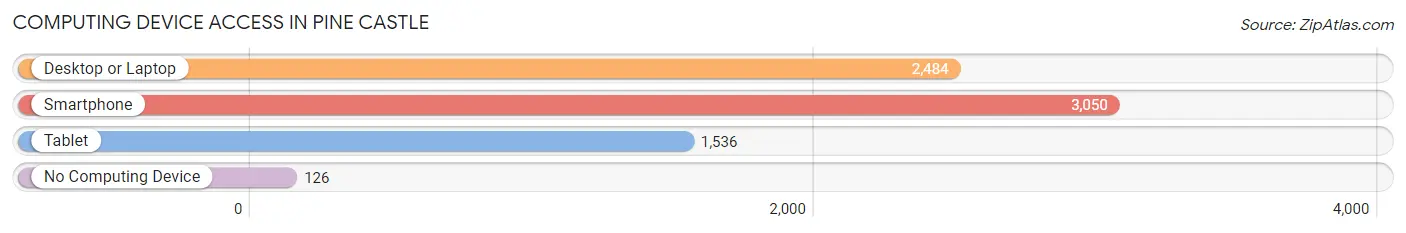
| Device Type | # Households | % Households |
| Desktop or Laptop | 2,484 | 74.7% |
| Smartphone | 3,050 | 91.7% |
| Tablet | 1,536 | 46.2% |
| No Computing Device | 126 | 3.8% |
| Total | 3,325 | 100.0% |
Internet Access in Pine Castle
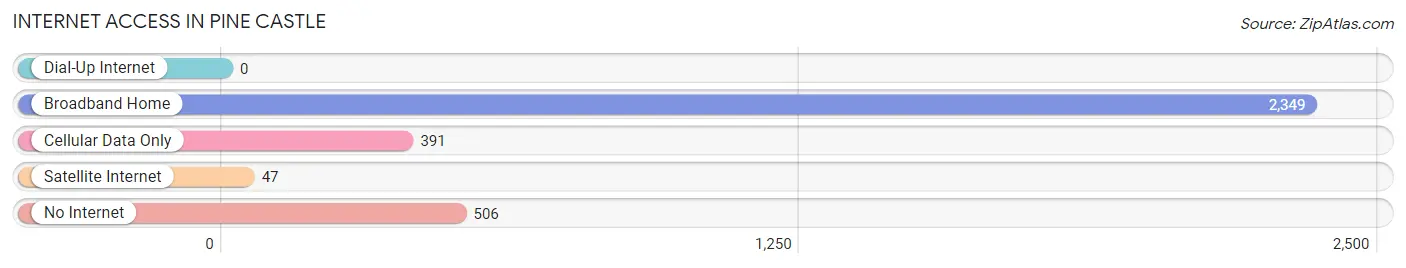
| Internet Type | # Households | % Households |
| Dial-Up Internet | 0 | 0.0% |
| Broadband Home | 2,349 | 70.7% |
| Cellular Data Only | 391 | 11.8% |
| Satellite Internet | 47 | 1.4% |
| No Internet | 506 | 15.2% |
| Total | 3,325 | 100.0% |
Pine Castle Summary
Pine Castle is an unincorporated community located in Orange County, Florida, United States. It is located in the southeastern part of the county, just south of Orlando. The community is part of the Orlando–Kissimmee–Sanford Metropolitan Statistical Area.
History
Pine Castle was founded in the late 19th century by settlers from the North. The community was named after a large pine tree that stood in the center of the town. The tree was used as a gathering place for the settlers and was a symbol of the town's unity.
The first post office in Pine Castle was established in 1887. The town was incorporated in 1891 and was home to a variety of businesses, including a general store, a blacksmith shop, a sawmill, and a grist mill.
In the early 20th century, Pine Castle was a popular tourist destination. The town was home to several hotels, including the Pine Castle Hotel, which was built in 1910. The hotel was a popular destination for visitors from all over the country.
In the 1950s, Pine Castle began to decline as the tourist industry shifted to other parts of Florida. The town's population decreased and many of the businesses closed.
Geography
Pine Castle is located in southeastern Orange County, Florida. It is situated on the western shore of Lake Conway, a large lake that is part of the St. Johns River system. The town is bordered by the cities of Orlando and Belle Isle to the north, and the towns of Edgewood and Belle Isle to the south.
The town has a total area of 1.3 square miles, all of which is land. The terrain is mostly flat, with some rolling hills. The climate is subtropical, with hot, humid summers and mild winters.
Economy
Pine Castle is primarily a residential community, with most of its residents commuting to nearby cities for work. The town is home to several small businesses, including a grocery store, a hardware store, and a few restaurants.
The town is also home to a number of light industrial businesses, including a printing company and a metal fabrication shop.
Demographics
As of the 2010 census, Pine Castle had a population of 2,845. The racial makeup of the town was 79.3% White, 11.2% African American, 0.7% Native American, 0.7% Asian, 0.1% Pacific Islander, 5.3% from other races, and 2.9% from two or more races. Hispanic or Latino of any race were 11.2% of the population.
The median household income in Pine Castle was $41,944, and the median family income was $50,938. The per capita income was $20,945. About 11.2% of families and 14.2% of the population were below the poverty line, including 19.2% of those under age 18 and 8.2% of those age 65 or over.
Common Questions
What is Per Capita Income in Pine Castle?
Per Capita income in Pine Castle is $20,690.
What is the Median Family Income in Pine Castle?
Median Family Income in Pine Castle is $49,563.
What is the Median Household income in Pine Castle?
Median Household Income in Pine Castle is $43,224.
What is Income or Wage Gap in Pine Castle?
Income or Wage Gap in Pine Castle is 21.4%.
Women in Pine Castle earn 78.6 cents for every dollar earned by a man.
What is Inequality or Gini Index in Pine Castle?
Inequality or Gini Index in Pine Castle is 0.42.
What is the Total Population of Pine Castle?
Total Population of Pine Castle is 9,556.
What is the Total Male Population of Pine Castle?
Total Male Population of Pine Castle is 4,868.
What is the Total Female Population of Pine Castle?
Total Female Population of Pine Castle is 4,688.
What is the Ratio of Males per 100 Females in Pine Castle?
There are 103.84 Males per 100 Females in Pine Castle.
What is the Ratio of Females per 100 Males in Pine Castle?
There are 96.30 Females per 100 Males in Pine Castle.
What is the Median Population Age in Pine Castle?
Median Population Age in Pine Castle is 40.1 Years.
What is the Average Family Size in Pine Castle
Average Family Size in Pine Castle is 3.4 People.
What is the Average Household Size in Pine Castle
Average Household Size in Pine Castle is 2.9 People.
How Large is the Labor Force in Pine Castle?
There are 4,252 People in the Labor Forcein in Pine Castle.
What is the Percentage of People in the Labor Force in Pine Castle?
57.4% of People are in the Labor Force in Pine Castle.
What is the Unemployment Rate in Pine Castle?
Unemployment Rate in Pine Castle is 5.0%.