Monroe County, FL Map & Demographics
Monroe County Map
Monroe County Overview
$54,630
PER CAPITA INCOME
$95,165
AVG FAMILY INCOME
$80,111
AVG HOUSEHOLD INCOME
27.6%
WAGE / INCOME GAP [ % ]
72.4¢/ $1
WAGE / INCOME GAP [ $ ]
$9,110
FAMILY INCOME DEFICIT
0.52
INEQUALITY / GINI INDEX
82,044
TOTAL POPULATION
42,677
MALE POPULATION
39,367
FEMALE POPULATION
108.41
MALES / 100 FEMALES
92.24
FEMALES / 100 MALES
48.3
MEDIAN AGE
2.8
AVG FAMILY SIZE
2.3
AVG HOUSEHOLD SIZE
45,080
LABOR FORCE [ PEOPLE ]
63.6%
PERCENT IN LABOR FORCE
3.4%
UNEMPLOYMENT RATE
Monroe County Area Codes
Income in Monroe County
Income Overview in Monroe County
Per Capita Income in Monroe County is $54,630, while median incomes of families and households are $95,165 and $80,111 respectively.
| Characteristic | Number | Measure |
| Per Capita Income | 82,044 | $54,630 |
| Median Family Income | 20,593 | $95,165 |
| Mean Family Income | 20,593 | $148,671 |
| Median Household Income | 34,388 | $80,111 |
| Mean Household Income | 34,388 | $125,422 |
| Income Deficit | 20,593 | $9,110 |
| Wage / Income Gap (%) | 82,044 | 27.60% |
| Wage / Income Gap ($) | 82,044 | 72.40¢ per $1 |
| Gini / Inequality Index | 82,044 | 0.52 |
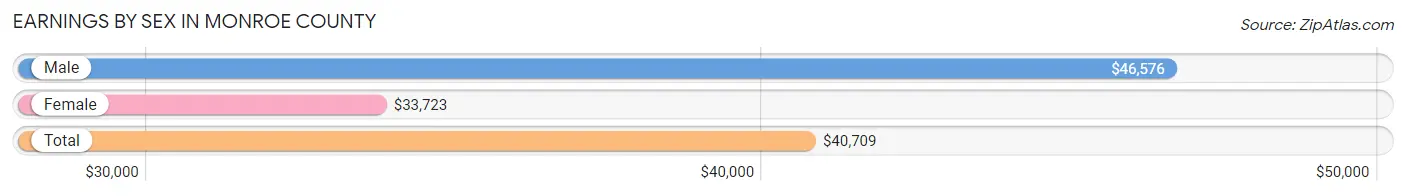
Earnings by Sex in Monroe County
Average Earnings in Monroe County are $40,709, $46,576 for men and $33,723 for women, a difference of 27.6%.
| Sex | Number | Average Earnings |
| Male | 26,246 (55.3%) | $46,576 |
| Female | 21,191 (44.7%) | $33,723 |
| Total | 47,437 (100.0%) | $40,709 |
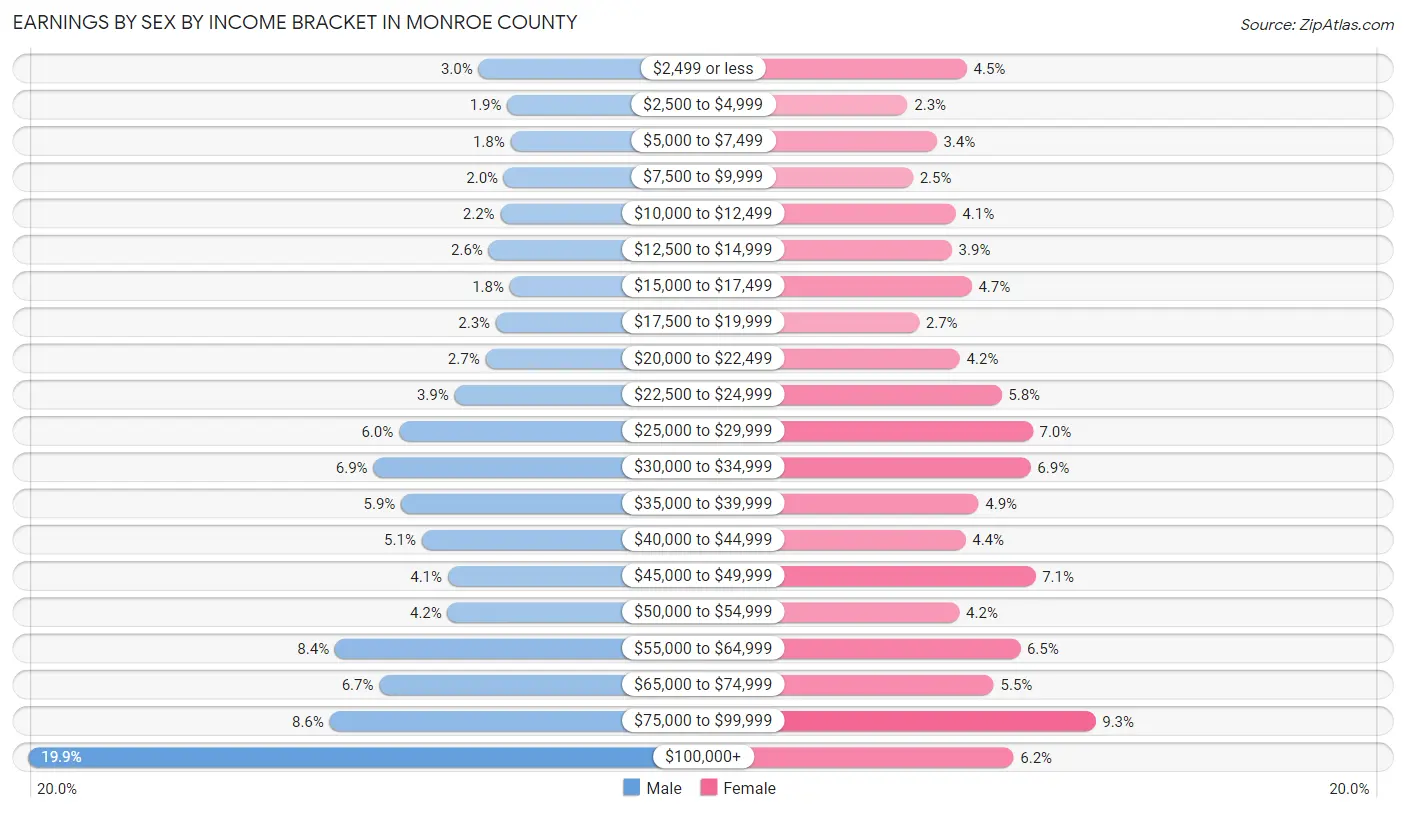
Earnings by Sex by Income Bracket in Monroe County
The most common earnings brackets in Monroe County are $100,000+ for men (5,213 | 19.9%) and $75,000 to $99,999 for women (1,973 | 9.3%).
| Income | Male | Female |
| $2,499 or less | 785 (3.0%) | 952 (4.5%) |
| $2,500 to $4,999 | 502 (1.9%) | 480 (2.3%) |
| $5,000 to $7,499 | 470 (1.8%) | 712 (3.4%) |
| $7,500 to $9,999 | 535 (2.0%) | 524 (2.5%) |
| $10,000 to $12,499 | 570 (2.2%) | 863 (4.1%) |
| $12,500 to $14,999 | 684 (2.6%) | 833 (3.9%) |
| $15,000 to $17,499 | 477 (1.8%) | 990 (4.7%) |
| $17,500 to $19,999 | 614 (2.3%) | 572 (2.7%) |
| $20,000 to $22,499 | 717 (2.7%) | 896 (4.2%) |
| $22,500 to $24,999 | 1,020 (3.9%) | 1,226 (5.8%) |
| $25,000 to $29,999 | 1,566 (6.0%) | 1,475 (7.0%) |
| $30,000 to $34,999 | 1,820 (6.9%) | 1,457 (6.9%) |
| $35,000 to $39,999 | 1,545 (5.9%) | 1,044 (4.9%) |
| $40,000 to $44,999 | 1,344 (5.1%) | 941 (4.4%) |
| $45,000 to $49,999 | 1,087 (4.1%) | 1,497 (7.1%) |
| $50,000 to $54,999 | 1,090 (4.2%) | 893 (4.2%) |
| $55,000 to $64,999 | 2,196 (8.4%) | 1,376 (6.5%) |
| $65,000 to $74,999 | 1,762 (6.7%) | 1,165 (5.5%) |
| $75,000 to $99,999 | 2,249 (8.6%) | 1,973 (9.3%) |
| $100,000+ | 5,213 (19.9%) | 1,322 (6.2%) |
| Total | 26,246 (100.0%) | 21,191 (100.0%) |
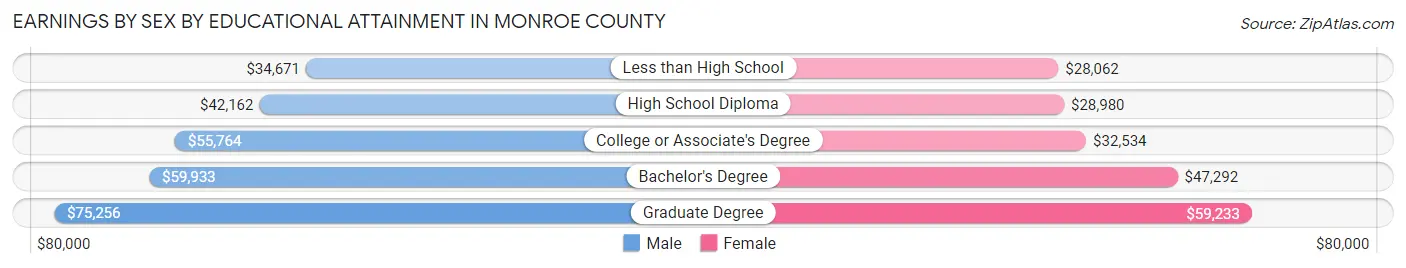
Earnings by Sex by Educational Attainment in Monroe County
Average earnings in Monroe County are $50,991 for men and $36,661 for women, a difference of 28.1%. Men with an educational attainment of graduate degree enjoy the highest average annual earnings of $75,256, while those with less than high school education earn the least with $34,671. Women with an educational attainment of graduate degree earn the most with the average annual earnings of $59,233, while those with less than high school education have the smallest earnings of $28,062.
| Educational Attainment | Male Income | Female Income |
| Less than High School | $34,671 | $28,062 |
| High School Diploma | $42,162 | $28,980 |
| College or Associate's Degree | $55,764 | $32,534 |
| Bachelor's Degree | $59,933 | $47,292 |
| Graduate Degree | $75,256 | $59,233 |
| Total | $50,991 | $36,661 |
Family Income in Monroe County
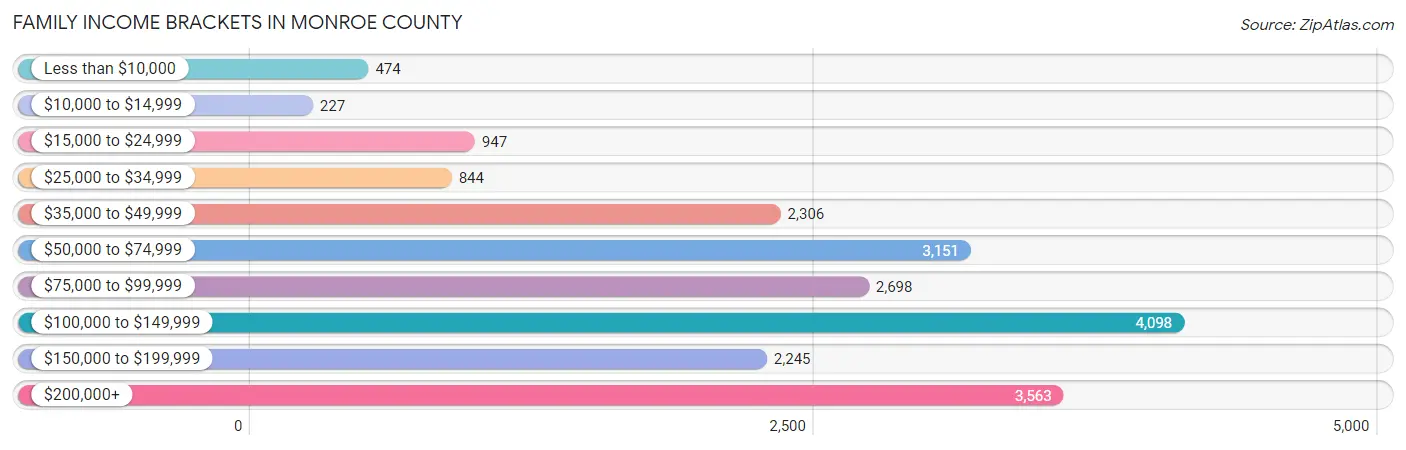
Family Income Brackets in Monroe County
According to the Monroe County family income data, there are 4,098 families falling into the $100,000 to $149,999 income range, which is the most common income bracket and makes up 19.9% of all families. Conversely, the $10,000 to $14,999 income bracket is the least frequent group with only 227 families (1.1%) belonging to this category.
| Income Bracket | # Families | % Families |
| Less than $10,000 | 474 | 2.3% |
| $10,000 to $14,999 | 227 | 1.1% |
| $15,000 to $24,999 | 947 | 4.6% |
| $25,000 to $34,999 | 844 | 4.1% |
| $35,000 to $49,999 | 2,306 | 11.2% |
| $50,000 to $74,999 | 3,151 | 15.3% |
| $75,000 to $99,999 | 2,698 | 13.1% |
| $100,000 to $149,999 | 4,098 | 19.9% |
| $150,000 to $199,999 | 2,245 | 10.9% |
| $200,000+ | 3,563 | 17.3% |
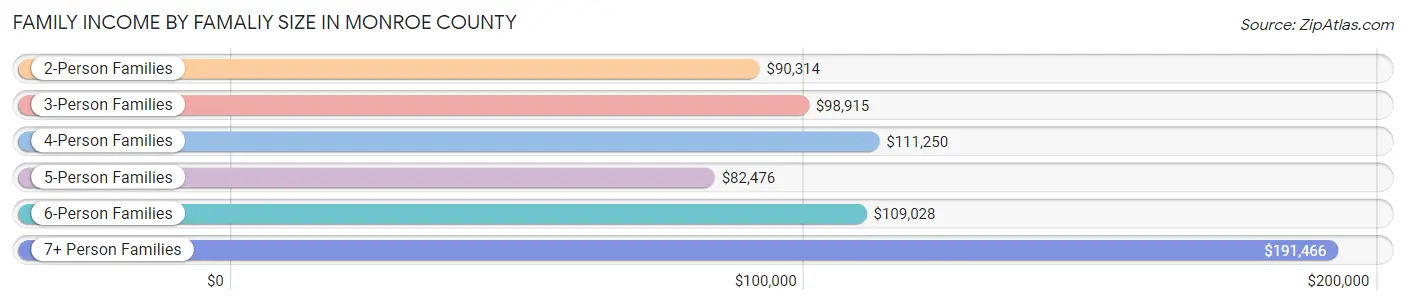
Family Income by Famaliy Size in Monroe County
7+ person families (80 | 0.4%) account for the highest median family income in Monroe County with $191,466 per family, while 2-person families (13,102 | 63.6%) have the highest median income of $45,157 per family member.
| Income Bracket | # Families | Median Income |
| 2-Person Families | 13,102 (63.6%) | $90,314 |
| 3-Person Families | 3,930 (19.1%) | $98,915 |
| 4-Person Families | 2,249 (10.9%) | $111,250 |
| 5-Person Families | 1,019 (5.0%) | $82,476 |
| 6-Person Families | 213 (1.0%) | $109,028 |
| 7+ Person Families | 80 (0.4%) | $191,466 |
| Total | 20,593 (100.0%) | $95,165 |
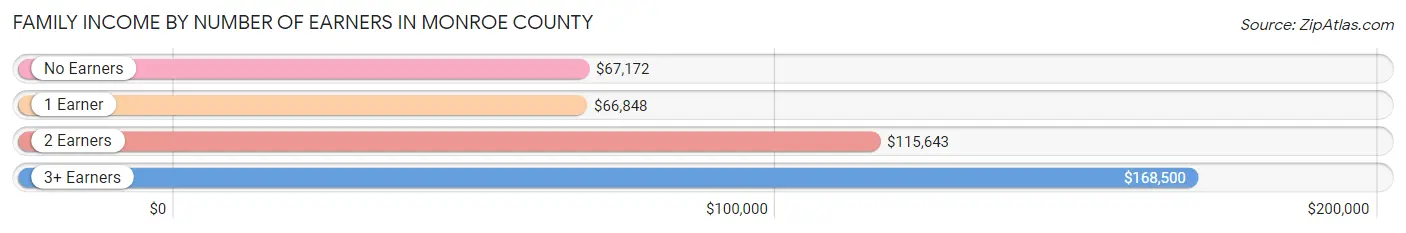
Family Income by Number of Earners in Monroe County
The median family income in Monroe County is $95,165, with families comprising 3+ earners (1,456) having the highest median family income of $168,500, while families with 1 earner (6,542) have the lowest median family income of $66,848, accounting for 7.1% and 31.8% of families, respectively.
| Number of Earners | # Families | Median Income |
| No Earners | 3,594 (17.4%) | $67,172 |
| 1 Earner | 6,542 (31.8%) | $66,848 |
| 2 Earners | 9,001 (43.7%) | $115,643 |
| 3+ Earners | 1,456 (7.1%) | $168,500 |
| Total | 20,593 (100.0%) | $95,165 |
Household Income in Monroe County
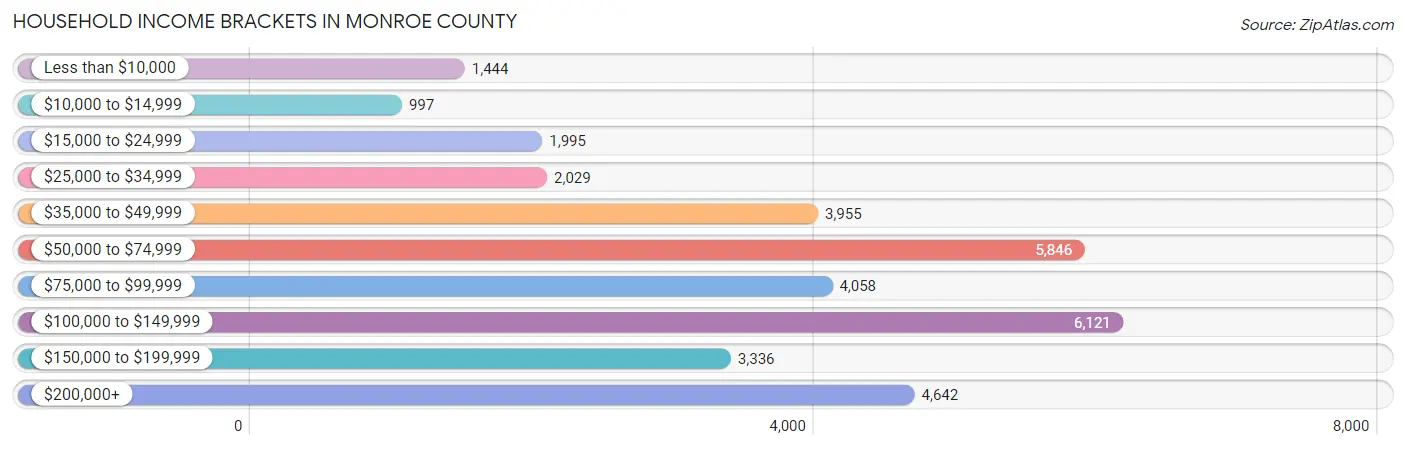
Household Income Brackets in Monroe County
With 6,121 households falling in the category, the $100,000 to $149,999 income range is the most frequent in Monroe County, accounting for 17.8% of all households. In contrast, only 997 households (2.9%) fall into the $10,000 to $14,999 income bracket, making it the least populous group.
| Income Bracket | # Households | % Households |
| Less than $10,000 | 1,444 | 4.2% |
| $10,000 to $14,999 | 997 | 2.9% |
| $15,000 to $24,999 | 1,995 | 5.8% |
| $25,000 to $34,999 | 2,029 | 5.9% |
| $35,000 to $49,999 | 3,955 | 11.5% |
| $50,000 to $74,999 | 5,846 | 17.0% |
| $75,000 to $99,999 | 4,058 | 11.8% |
| $100,000 to $149,999 | 6,121 | 17.8% |
| $150,000 to $199,999 | 3,336 | 9.7% |
| $200,000+ | 4,642 | 13.5% |
Household Income by Householder Age in Monroe County
The median household income in Monroe County is $80,111, with the highest median household income of $94,326 found in the 45 to 64 years age bracket for the primary householder. A total of 13,808 households (40.2%) fall into this category. Meanwhile, the 15 to 24 years age bracket for the primary householder has the lowest median household income of $61,852, with 822 households (2.4%) in this group.
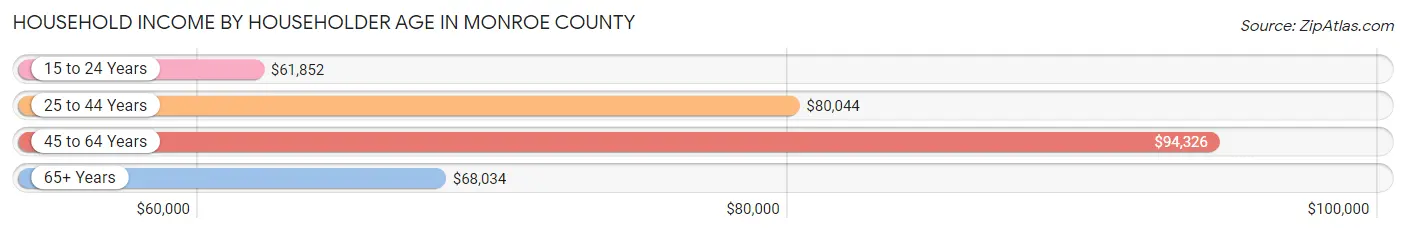
| Income Bracket | # Households | Median Income |
| 15 to 24 Years | 822 (2.4%) | $61,852 |
| 25 to 44 Years | 8,369 (24.3%) | $80,044 |
| 45 to 64 Years | 13,808 (40.2%) | $94,326 |
| 65+ Years | 11,389 (33.1%) | $68,034 |
| Total | 34,388 (100.0%) | $80,111 |
Poverty in Monroe County
Income Below Poverty by Sex and Age in Monroe County
With 11.1% poverty level for males and 12.4% for females among the residents of Monroe County, 5 year old males and 18 to 24 year old females are the most vulnerable to poverty, with 169 males (39.6%) and 738 females (32.9%) in their respective age groups living below the poverty level.
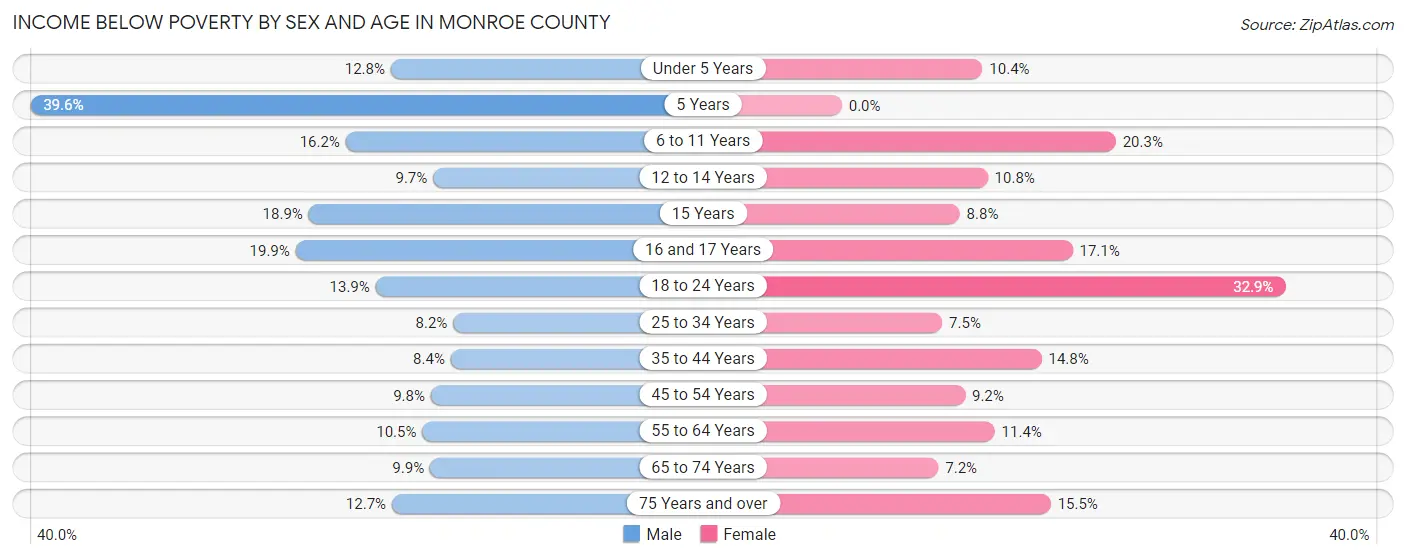
| Age Bracket | Male | Female |
| Under 5 Years | 219 (12.8%) | 207 (10.4%) |
| 5 Years | 169 (39.6%) | 0 (0.0%) |
| 6 to 11 Years | 336 (16.2%) | 334 (20.3%) |
| 12 to 14 Years | 114 (9.7%) | 133 (10.8%) |
| 15 Years | 59 (18.9%) | 7 (8.7%) |
| 16 and 17 Years | 167 (19.9%) | 147 (17.1%) |
| 18 to 24 Years | 345 (13.9%) | 738 (32.9%) |
| 25 to 34 Years | 387 (8.2%) | 340 (7.4%) |
| 35 to 44 Years | 441 (8.4%) | 702 (14.8%) |
| 45 to 54 Years | 587 (9.8%) | 503 (9.1%) |
| 55 to 64 Years | 736 (10.5%) | 749 (11.4%) |
| 65 to 74 Years | 601 (9.9%) | 396 (7.2%) |
| 75 Years and over | 494 (12.7%) | 569 (15.5%) |
| Total | 4,655 (11.1%) | 4,825 (12.4%) |
Income Above Poverty by Sex and Age in Monroe County
According to the poverty statistics in Monroe County, males aged 25 to 34 years and females aged 5 years are the age groups that are most secure financially, with 91.8% of males and 100.0% of females in these age groups living above the poverty line.
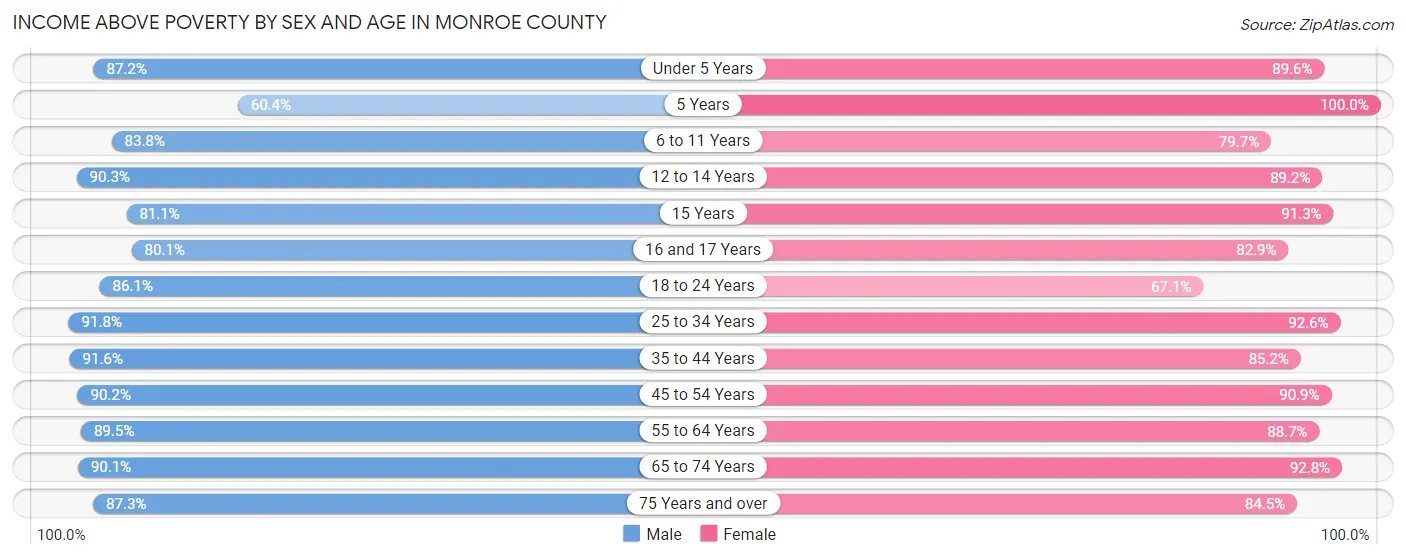
| Age Bracket | Male | Female |
| Under 5 Years | 1,491 (87.2%) | 1,775 (89.6%) |
| 5 Years | 258 (60.4%) | 403 (100.0%) |
| 6 to 11 Years | 1,743 (83.8%) | 1,308 (79.7%) |
| 12 to 14 Years | 1,065 (90.3%) | 1,095 (89.2%) |
| 15 Years | 253 (81.1%) | 73 (91.2%) |
| 16 and 17 Years | 673 (80.1%) | 711 (82.9%) |
| 18 to 24 Years | 2,130 (86.1%) | 1,503 (67.1%) |
| 25 to 34 Years | 4,344 (91.8%) | 4,222 (92.5%) |
| 35 to 44 Years | 4,832 (91.6%) | 4,031 (85.2%) |
| 45 to 54 Years | 5,380 (90.2%) | 4,993 (90.8%) |
| 55 to 64 Years | 6,293 (89.5%) | 5,849 (88.6%) |
| 65 to 74 Years | 5,468 (90.1%) | 5,129 (92.8%) |
| 75 Years and over | 3,386 (87.3%) | 3,100 (84.5%) |
| Total | 37,316 (88.9%) | 34,192 (87.6%) |
Income Below Poverty Among Married-Couple Families in Monroe County
The poverty statistics for married-couple families in Monroe County show that 4.2% or 688 of the total 16,482 families live below the poverty line. Families with 3 or 4 children have the highest poverty rate of 16.6%, comprising of 102 families. On the other hand, families with 1 or 2 children have the lowest poverty rate of 2.8%, which includes 107 families.
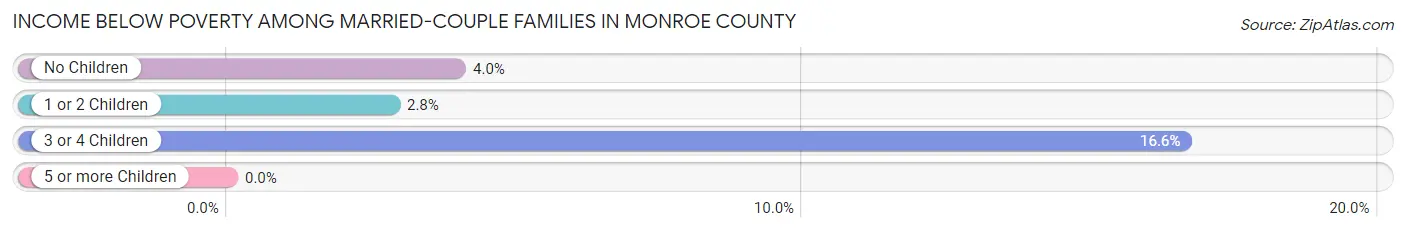
| Children | Above Poverty | Below Poverty |
| No Children | 11,588 (96.0%) | 479 (4.0%) |
| 1 or 2 Children | 3,694 (97.2%) | 107 (2.8%) |
| 3 or 4 Children | 512 (83.4%) | 102 (16.6%) |
| 5 or more Children | 0 (0.0%) | 0 (0.0%) |
| Total | 15,794 (95.8%) | 688 (4.2%) |
Income Below Poverty Among Single-Parent Households in Monroe County
According to the poverty data in Monroe County, 8.6% or 140 single-father households and 23.4% or 584 single-mother households are living below the poverty line. Among single-father households, those with 3 or 4 children have the highest poverty rate, with 12 households (19.4%) experiencing poverty. Likewise, among single-mother households, those with 5 or more children have the highest poverty rate, with 23 households (100.0%) falling below the poverty line.
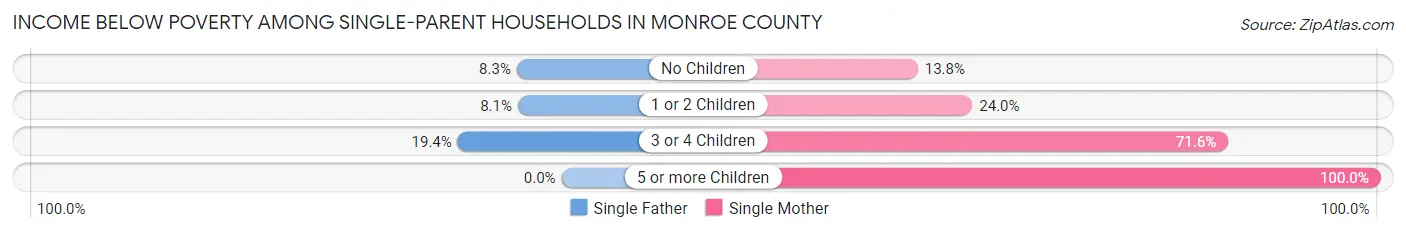
| Children | Single Father | Single Mother |
| No Children | 56 (8.3%) | 142 (13.8%) |
| 1 or 2 Children | 72 (8.1%) | 308 (24.0%) |
| 3 or 4 Children | 12 (19.4%) | 111 (71.6%) |
| 5 or more Children | 0 (0.0%) | 23 (100.0%) |
| Total | 140 (8.6%) | 584 (23.4%) |
Income Below Poverty Among Married-Couple vs Single-Parent Households in Monroe County
The poverty data for Monroe County shows that 688 of the married-couple family households (4.2%) and 724 of the single-parent households (17.6%) are living below the poverty level. Within the married-couple family households, those with 3 or 4 children have the highest poverty rate, with 102 households (16.6%) falling below the poverty line. Among the single-parent households, those with 5 or more children have the highest poverty rate, with 23 household (100.0%) living below poverty.
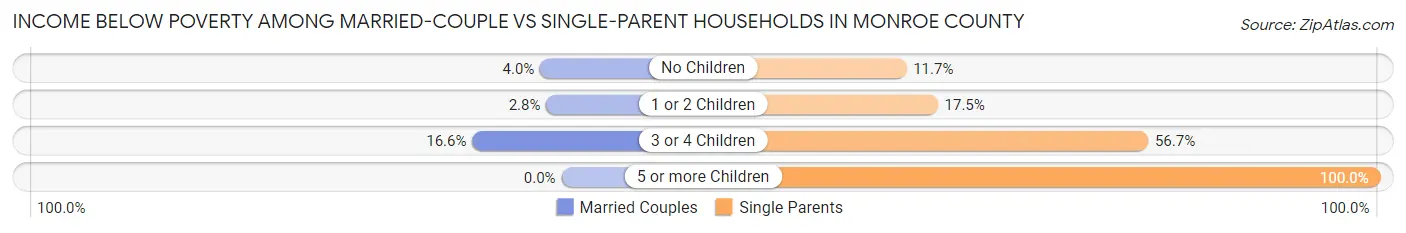
| Children | Married-Couple Families | Single-Parent Households |
| No Children | 479 (4.0%) | 198 (11.7%) |
| 1 or 2 Children | 107 (2.8%) | 380 (17.5%) |
| 3 or 4 Children | 102 (16.6%) | 123 (56.7%) |
| 5 or more Children | 0 (0.0%) | 23 (100.0%) |
| Total | 688 (4.2%) | 724 (17.6%) |
Race in Monroe County
The most populous races in Monroe County are White / Caucasian (62,079 | 75.7%), Hispanic or Latino (21,068 | 25.7%), and Two or more Races (10,450 | 12.7%).
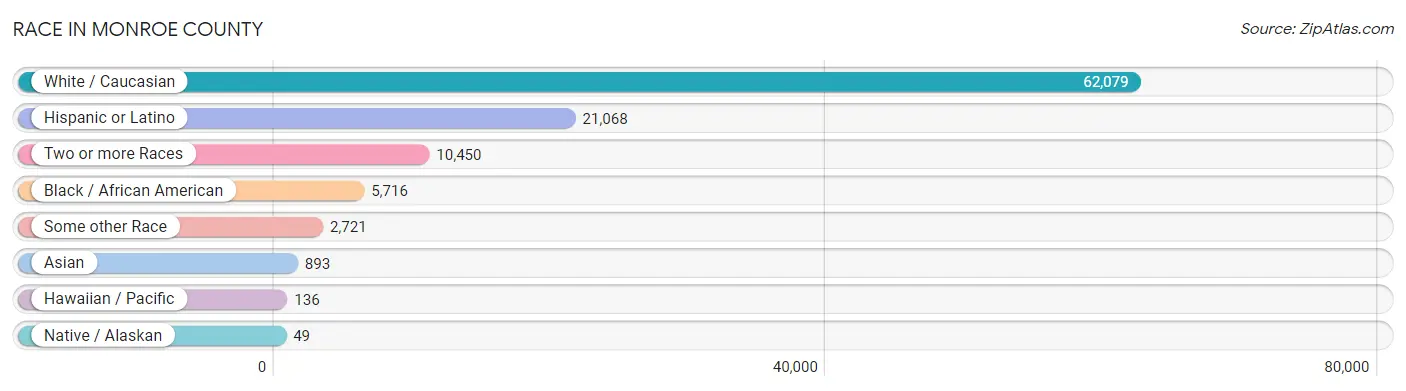
| Race | # Population | % Population |
| Asian | 893 | 1.1% |
| Black / African American | 5,716 | 7.0% |
| Hawaiian / Pacific | 136 | 0.2% |
| Hispanic or Latino | 21,068 | 25.7% |
| Native / Alaskan | 49 | 0.1% |
| White / Caucasian | 62,079 | 75.7% |
| Two or more Races | 10,450 | 12.7% |
| Some other Race | 2,721 | 3.3% |
| Total | 82,044 | 100.0% |
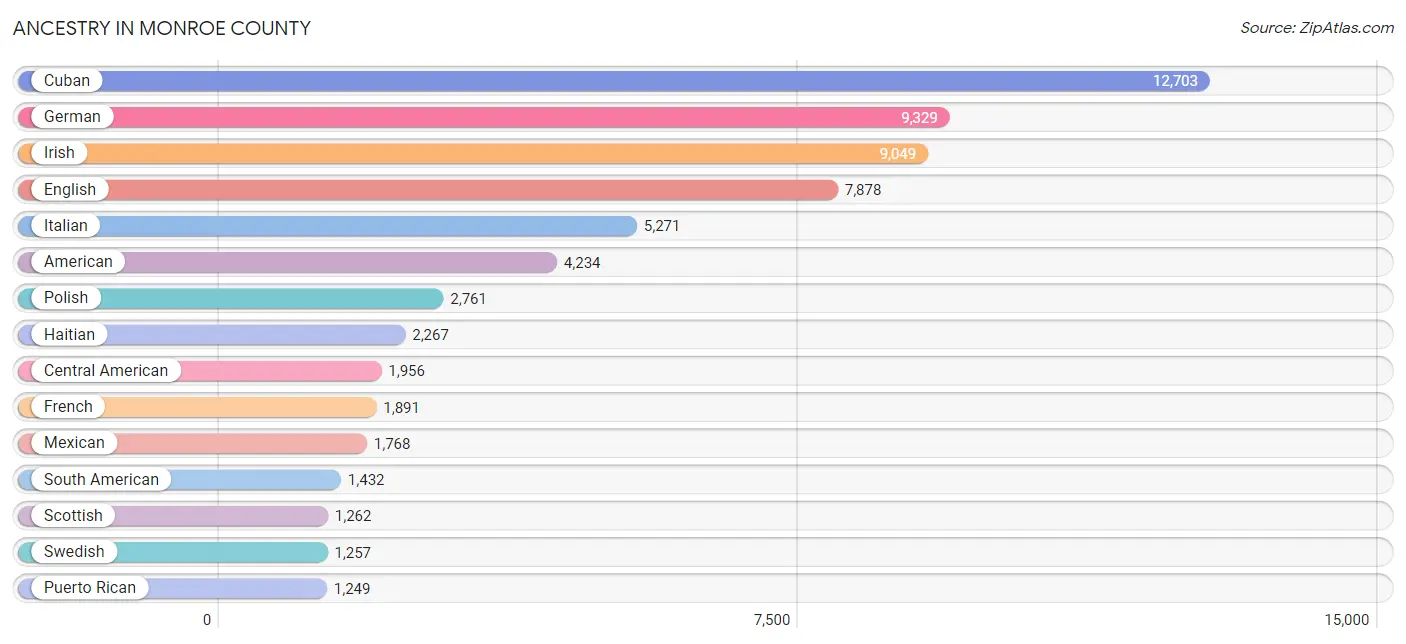
Ancestry in Monroe County
The most populous ancestries reported in Monroe County are Cuban (12,703 | 15.5%), German (9,329 | 11.4%), Irish (9,049 | 11.0%), English (7,878 | 9.6%), and Italian (5,271 | 6.4%), together accounting for 53.9% of all Monroe County residents.
| Ancestry | # Population | % Population |
| African | 259 | 0.3% |
| Alsatian | 51 | 0.1% |
| American | 4,234 | 5.2% |
| Arab | 179 | 0.2% |
| Argentinean | 231 | 0.3% |
| Armenian | 44 | 0.1% |
| Australian | 135 | 0.2% |
| Austrian | 333 | 0.4% |
| Bahamian | 305 | 0.4% |
| Basque | 36 | 0.0% |
| Belgian | 63 | 0.1% |
| Belizean | 14 | 0.0% |
| Bhutanese | 78 | 0.1% |
| Blackfeet | 48 | 0.1% |
| Bolivian | 35 | 0.0% |
| Brazilian | 23 | 0.0% |
| British | 601 | 0.7% |
| Bulgarian | 25 | 0.0% |
| Burmese | 64 | 0.1% |
| Canadian | 319 | 0.4% |
| Celtic | 8 | 0.0% |
| Central American | 1,956 | 2.4% |
| Central American Indian | 25 | 0.0% |
| Cherokee | 194 | 0.2% |
| Chilean | 45 | 0.1% |
| Choctaw | 6 | 0.0% |
| Colombian | 683 | 0.8% |
| Costa Rican | 66 | 0.1% |
| Croatian | 46 | 0.1% |
| Cuban | 12,703 | 15.5% |
| Czech | 353 | 0.4% |
| Czechoslovakian | 317 | 0.4% |
| Danish | 179 | 0.2% |
| Dominican | 281 | 0.3% |
| Dutch | 939 | 1.1% |
| Dutch West Indian | 32 | 0.0% |
| Eastern European | 383 | 0.5% |
| Ecuadorian | 23 | 0.0% |
| English | 7,878 | 9.6% |
| Estonian | 43 | 0.1% |
| European | 786 | 1.0% |
| Filipino | 22 | 0.0% |
| Finnish | 145 | 0.2% |
| French | 1,891 | 2.3% |
| French Canadian | 328 | 0.4% |
| German | 9,329 | 11.4% |
| Greek | 473 | 0.6% |
| Guatemalan | 452 | 0.5% |
| Guyanese | 71 | 0.1% |
| Haitian | 2,267 | 2.8% |
| Honduran | 191 | 0.2% |
| Hungarian | 389 | 0.5% |
| Icelander | 6 | 0.0% |
| Indian (Asian) | 344 | 0.4% |
| Iranian | 83 | 0.1% |
| Irish | 9,049 | 11.0% |
| Israeli | 6 | 0.0% |
| Italian | 5,271 | 6.4% |
| Jamaican | 151 | 0.2% |
| Korean | 596 | 0.7% |
| Latvian | 113 | 0.1% |
| Lebanese | 114 | 0.1% |
| Lithuanian | 252 | 0.3% |
| Macedonian | 9 | 0.0% |
| Malaysian | 9 | 0.0% |
| Mexican | 1,768 | 2.1% |
| Native Hawaiian | 51 | 0.1% |
| New Zealander | 21 | 0.0% |
| Nicaraguan | 1,157 | 1.4% |
| Northern European | 27 | 0.0% |
| Norwegian | 762 | 0.9% |
| Pakistani | 20 | 0.0% |
| Panamanian | 58 | 0.1% |
| Pennsylvania German | 29 | 0.0% |
| Peruvian | 106 | 0.1% |
| Polish | 2,761 | 3.4% |
| Portuguese | 194 | 0.2% |
| Puerto Rican | 1,249 | 1.5% |
| Romanian | 266 | 0.3% |
| Russian | 782 | 0.9% |
| Salvadoran | 32 | 0.0% |
| Samoan | 284 | 0.4% |
| Scandinavian | 374 | 0.5% |
| Scotch-Irish | 734 | 0.9% |
| Scottish | 1,262 | 1.5% |
| Senegalese | 20 | 0.0% |
| Serbian | 59 | 0.1% |
| Sierra Leonean | 5 | 0.0% |
| Slavic | 67 | 0.1% |
| Slovak | 164 | 0.2% |
| Slovene | 21 | 0.0% |
| South African | 29 | 0.0% |
| South American | 1,432 | 1.8% |
| Spaniard | 304 | 0.4% |
| Spanish | 359 | 0.4% |
| Sri Lankan | 175 | 0.2% |
| Subsaharan African | 313 | 0.4% |
| Swedish | 1,257 | 1.5% |
| Swiss | 151 | 0.2% |
| Syrian | 65 | 0.1% |
| Thai | 296 | 0.4% |
| Trinidadian and Tobagonian | 15 | 0.0% |
| Ukrainian | 523 | 0.6% |
| Venezuelan | 293 | 0.4% |
| Vietnamese | 86 | 0.1% |
| Welsh | 548 | 0.7% |
| West Indian | 41 | 0.1% |
| Yaqui | 12 | 0.0% |
| Yugoslavian | 23 | 0.0% |
| Yuman | 12 | 0.0% | View All 110 Rows |
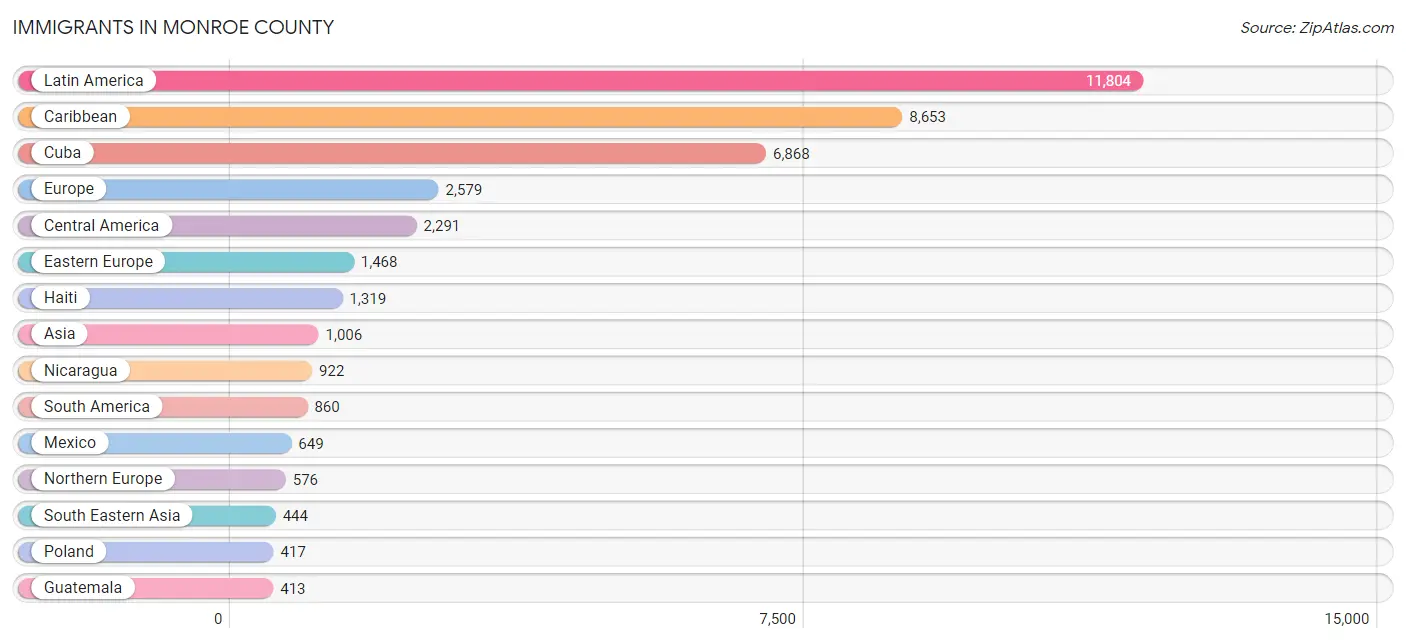
Immigrants in Monroe County
The most numerous immigrant groups reported in Monroe County came from Latin America (11,804 | 14.4%), Caribbean (8,653 | 10.5%), Cuba (6,868 | 8.4%), Europe (2,579 | 3.1%), and Central America (2,291 | 2.8%), together accounting for 39.2% of all Monroe County residents.
| Immigration Origin | # Population | % Population |
| Africa | 117 | 0.1% |
| Argentina | 161 | 0.2% |
| Asia | 1,006 | 1.2% |
| Australia | 82 | 0.1% |
| Bahamas | 5 | 0.0% |
| Bangladesh | 81 | 0.1% |
| Belgium | 10 | 0.0% |
| Belize | 12 | 0.0% |
| Bolivia | 24 | 0.0% |
| Brazil | 101 | 0.1% |
| Bulgaria | 25 | 0.0% |
| Canada | 380 | 0.5% |
| Caribbean | 8,653 | 10.5% |
| Central America | 2,291 | 2.8% |
| China | 90 | 0.1% |
| Colombia | 256 | 0.3% |
| Costa Rica | 43 | 0.1% |
| Cuba | 6,868 | 8.4% |
| Czechoslovakia | 128 | 0.2% |
| Denmark | 17 | 0.0% |
| Dominican Republic | 194 | 0.2% |
| Eastern Africa | 11 | 0.0% |
| Eastern Asia | 158 | 0.2% |
| Eastern Europe | 1,468 | 1.8% |
| El Salvador | 8 | 0.0% |
| England | 299 | 0.4% |
| Europe | 2,579 | 3.1% |
| France | 64 | 0.1% |
| Germany | 274 | 0.3% |
| Greece | 5 | 0.0% |
| Guatemala | 413 | 0.5% |
| Guyana | 85 | 0.1% |
| Haiti | 1,319 | 1.6% |
| Honduras | 186 | 0.2% |
| Hungary | 25 | 0.0% |
| India | 65 | 0.1% |
| Indonesia | 10 | 0.0% |
| Ireland | 21 | 0.0% |
| Italy | 81 | 0.1% |
| Jamaica | 183 | 0.2% |
| Japan | 12 | 0.0% |
| Kazakhstan | 110 | 0.1% |
| Korea | 56 | 0.1% |
| Laos | 9 | 0.0% |
| Latin America | 11,804 | 14.4% |
| Latvia | 62 | 0.1% |
| Lebanon | 25 | 0.0% |
| Liberia | 16 | 0.0% |
| Lithuania | 44 | 0.1% |
| Mexico | 649 | 0.8% |
| Moldova | 136 | 0.2% |
| Netherlands | 37 | 0.1% |
| Nicaragua | 922 | 1.1% |
| Northern Africa | 5 | 0.0% |
| Northern Europe | 576 | 0.7% |
| Norway | 8 | 0.0% |
| Oceania | 280 | 0.3% |
| Panama | 58 | 0.1% |
| Peru | 50 | 0.1% |
| Philippines | 371 | 0.4% |
| Poland | 417 | 0.5% |
| Portugal | 7 | 0.0% |
| Romania | 80 | 0.1% |
| Russia | 161 | 0.2% |
| Scotland | 6 | 0.0% |
| Senegal | 9 | 0.0% |
| Serbia | 30 | 0.0% |
| South Africa | 76 | 0.1% |
| South America | 860 | 1.1% |
| South Central Asia | 379 | 0.5% |
| South Eastern Asia | 444 | 0.5% |
| Southern Europe | 131 | 0.2% |
| Spain | 38 | 0.1% |
| Sri Lanka | 4 | 0.0% |
| Sweden | 45 | 0.1% |
| Switzerland | 11 | 0.0% |
| Thailand | 14 | 0.0% |
| Trinidad and Tobago | 58 | 0.1% |
| Uganda | 5 | 0.0% |
| Ukraine | 320 | 0.4% |
| Uzbekistan | 119 | 0.2% |
| Venezuela | 183 | 0.2% |
| Vietnam | 40 | 0.1% |
| Western Africa | 25 | 0.0% |
| Western Asia | 25 | 0.0% |
| Western Europe | 396 | 0.5% | View All 86 Rows |
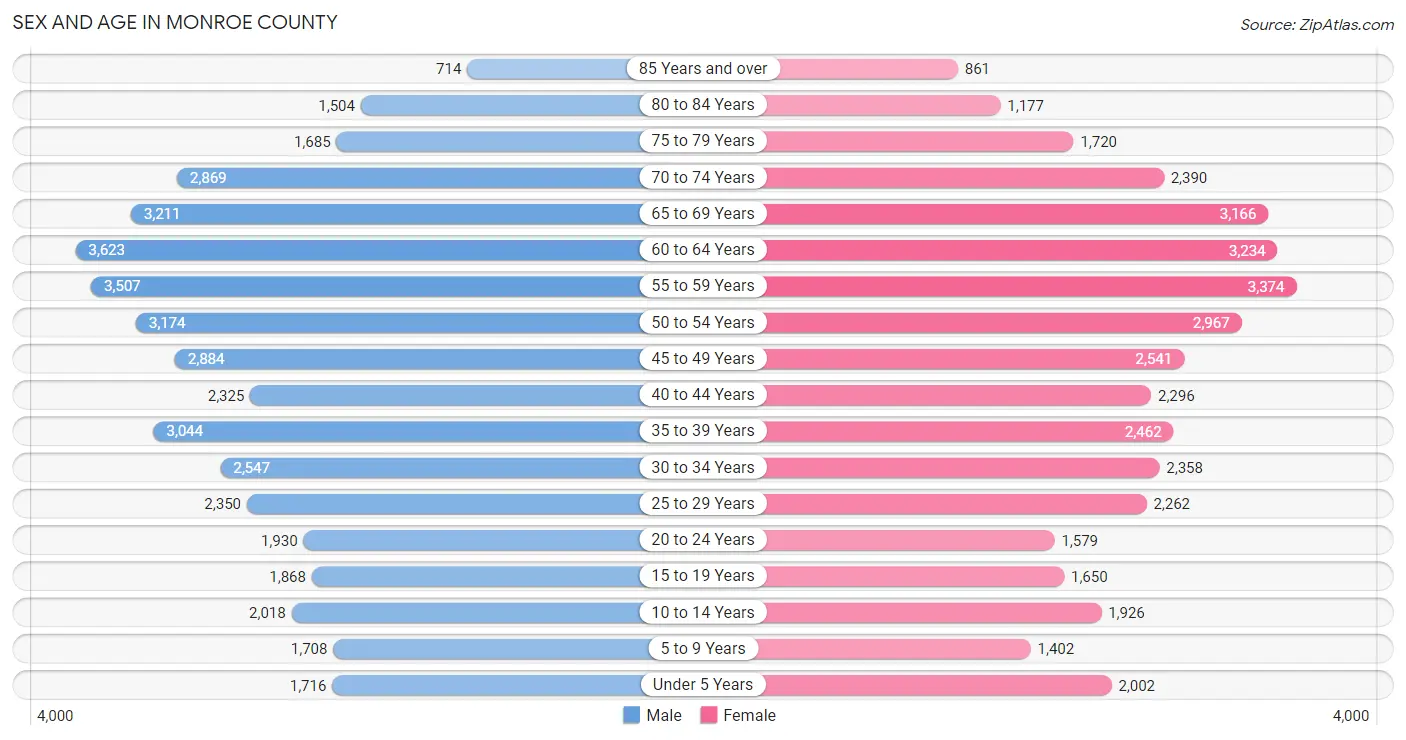
Sex and Age in Monroe County
Sex and Age in Monroe County
The most populous age groups in Monroe County are 60 to 64 Years (3,623 | 8.5%) for men and 55 to 59 Years (3,374 | 8.6%) for women.
| Age Bracket | Male | Female |
| Under 5 Years | 1,716 (4.0%) | 2,002 (5.1%) |
| 5 to 9 Years | 1,708 (4.0%) | 1,402 (3.6%) |
| 10 to 14 Years | 2,018 (4.7%) | 1,926 (4.9%) |
| 15 to 19 Years | 1,868 (4.4%) | 1,650 (4.2%) |
| 20 to 24 Years | 1,930 (4.5%) | 1,579 (4.0%) |
| 25 to 29 Years | 2,350 (5.5%) | 2,262 (5.8%) |
| 30 to 34 Years | 2,547 (6.0%) | 2,358 (6.0%) |
| 35 to 39 Years | 3,044 (7.1%) | 2,462 (6.2%) |
| 40 to 44 Years | 2,325 (5.4%) | 2,296 (5.8%) |
| 45 to 49 Years | 2,884 (6.8%) | 2,541 (6.5%) |
| 50 to 54 Years | 3,174 (7.4%) | 2,967 (7.5%) |
| 55 to 59 Years | 3,507 (8.2%) | 3,374 (8.6%) |
| 60 to 64 Years | 3,623 (8.5%) | 3,234 (8.2%) |
| 65 to 69 Years | 3,211 (7.5%) | 3,166 (8.0%) |
| 70 to 74 Years | 2,869 (6.7%) | 2,390 (6.1%) |
| 75 to 79 Years | 1,685 (4.0%) | 1,720 (4.4%) |
| 80 to 84 Years | 1,504 (3.5%) | 1,177 (3.0%) |
| 85 Years and over | 714 (1.7%) | 861 (2.2%) |
| Total | 42,677 (100.0%) | 39,367 (100.0%) |
Families and Households in Monroe County
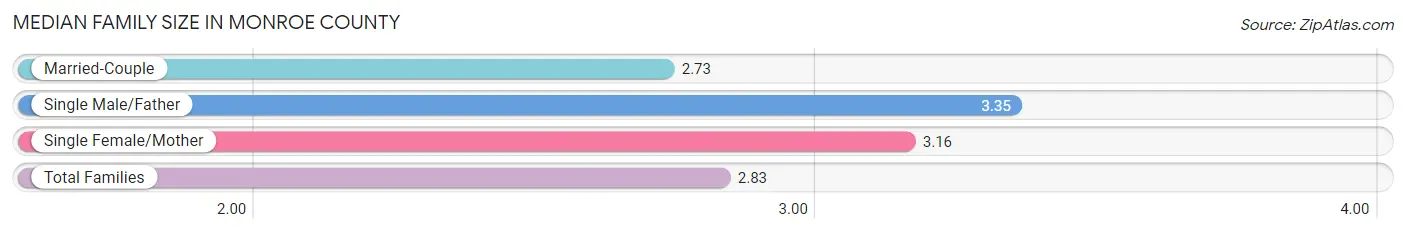
Median Family Size in Monroe County
The median family size in Monroe County is 2.83 persons per family, with single male/father families (1,620 | 7.9%) accounting for the largest median family size of 3.35 persons per family. On the other hand, married-couple families (16,482 | 80.0%) represent the smallest median family size with 2.73 persons per family.
| Family Type | # Families | Family Size |
| Married-Couple | 16,482 (80.0%) | 2.73 |
| Single Male/Father | 1,620 (7.9%) | 3.35 |
| Single Female/Mother | 2,491 (12.1%) | 3.16 |
| Total Families | 20,593 (100.0%) | 2.83 |
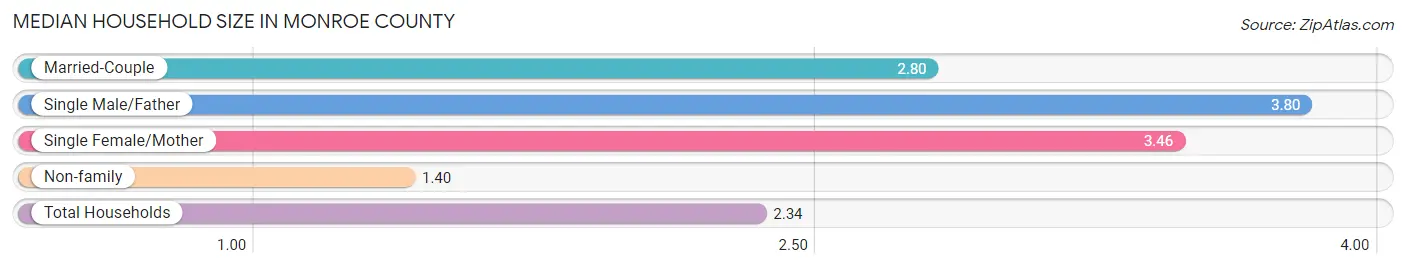
Median Household Size in Monroe County
The median household size in Monroe County is 2.34 persons per household, with single male/father households (1,620 | 4.7%) accounting for the largest median household size of 3.8 persons per household. non-family households (13,795 | 40.1%) represent the smallest median household size with 1.40 persons per household.
| Household Type | # Households | Household Size |
| Married-Couple | 16,482 (47.9%) | 2.80 |
| Single Male/Father | 1,620 (4.7%) | 3.80 |
| Single Female/Mother | 2,491 (7.2%) | 3.46 |
| Non-family | 13,795 (40.1%) | 1.40 |
| Total Households | 34,388 (100.0%) | 2.34 |
Household Size by Marriage Status in Monroe County
Out of a total of 34,388 households in Monroe County, 20,593 (59.9%) are family households, while 13,795 (40.1%) are nonfamily households. The most numerous type of family households are 2-person households, comprising 12,117, and the most common type of nonfamily households are 1-person households, comprising 9,616.
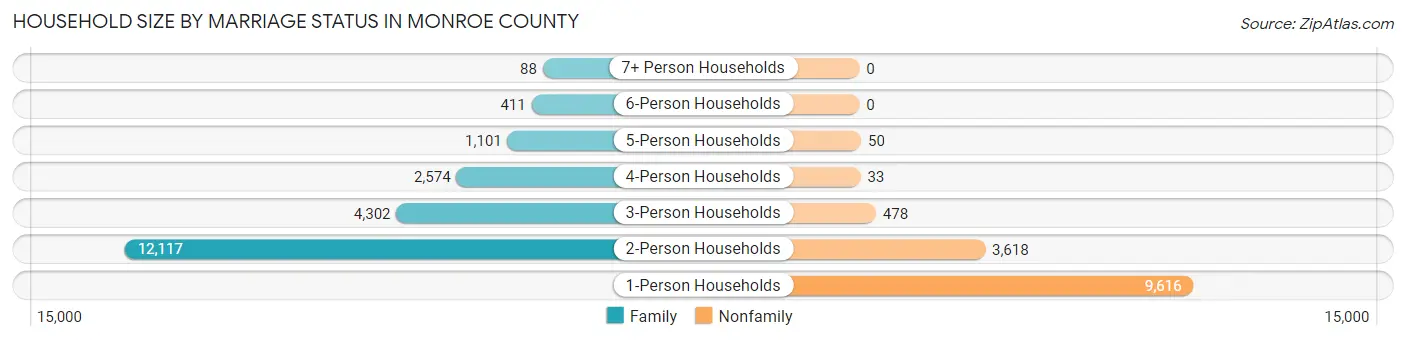
| Household Size | Family Households | Nonfamily Households |
| 1-Person Households | - | 9,616 (28.0%) |
| 2-Person Households | 12,117 (35.2%) | 3,618 (10.5%) |
| 3-Person Households | 4,302 (12.5%) | 478 (1.4%) |
| 4-Person Households | 2,574 (7.5%) | 33 (0.1%) |
| 5-Person Households | 1,101 (3.2%) | 50 (0.2%) |
| 6-Person Households | 411 (1.2%) | 0 (0.0%) |
| 7+ Person Households | 88 (0.3%) | 0 (0.0%) |
| Total | 20,593 (59.9%) | 13,795 (40.1%) |
Female Fertility in Monroe County
Fertility by Age in Monroe County
Average fertility rate in Monroe County is 50.0 births per 1,000 women. Women in the age bracket of 20 to 34 years have the highest fertility rate with 98.0 births per 1,000 women. Women in the age bracket of 20 to 34 years acount for 77.6% of all women with births.
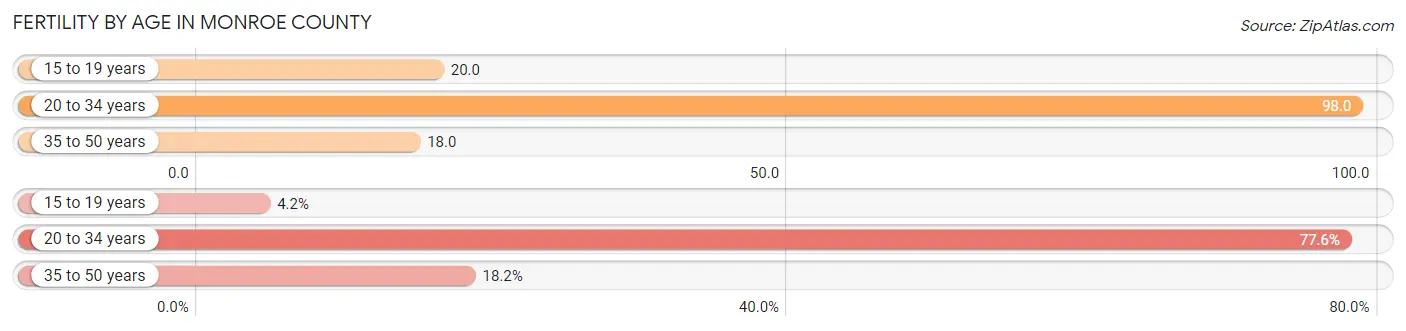
| Age Bracket | Women with Births | Births / 1,000 Women |
| 15 to 19 years | 33 (4.2%) | 20.0 |
| 20 to 34 years | 607 (77.6%) | 98.0 |
| 35 to 50 years | 142 (18.2%) | 18.0 |
| Total | 782 (100.0%) | 50.0 |
Fertility by Age by Marriage Status in Monroe County
65.7% of women with births (782) in Monroe County are married. The highest percentage of unmarried women with births falls into 15 to 19 years age bracket with 100.0% of them unmarried at the time of birth, while the lowest percentage of unmarried women with births belong to 35 to 50 years age bracket with 20.4% of them unmarried.
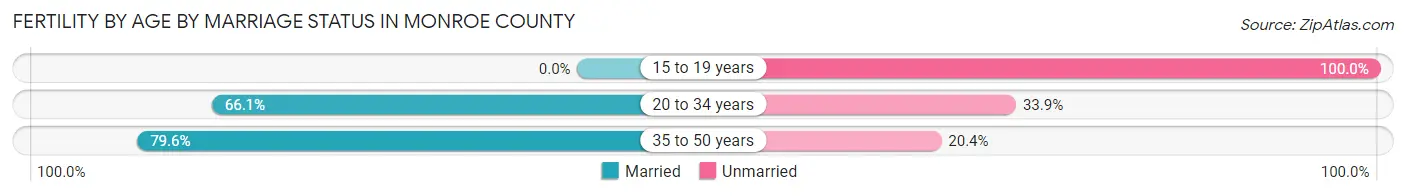
| Age Bracket | Married | Unmarried |
| 15 to 19 years | 0 (0.0%) | 33 (100.0%) |
| 20 to 34 years | 401 (66.1%) | 206 (33.9%) |
| 35 to 50 years | 113 (79.6%) | 29 (20.4%) |
| Total | 514 (65.7%) | 268 (34.3%) |
Fertility by Education in Monroe County
Average fertility rate in Monroe County is 50.0 births per 1,000 women. Women with the education attainment of less than high school have the highest fertility rate of 76.0 births per 1,000 women, while women with the education attainment of high school diploma have the lowest fertility at 37.0 births per 1,000 women. Women with the education attainment of college or associate's degree represent 26.5% of all women with births.
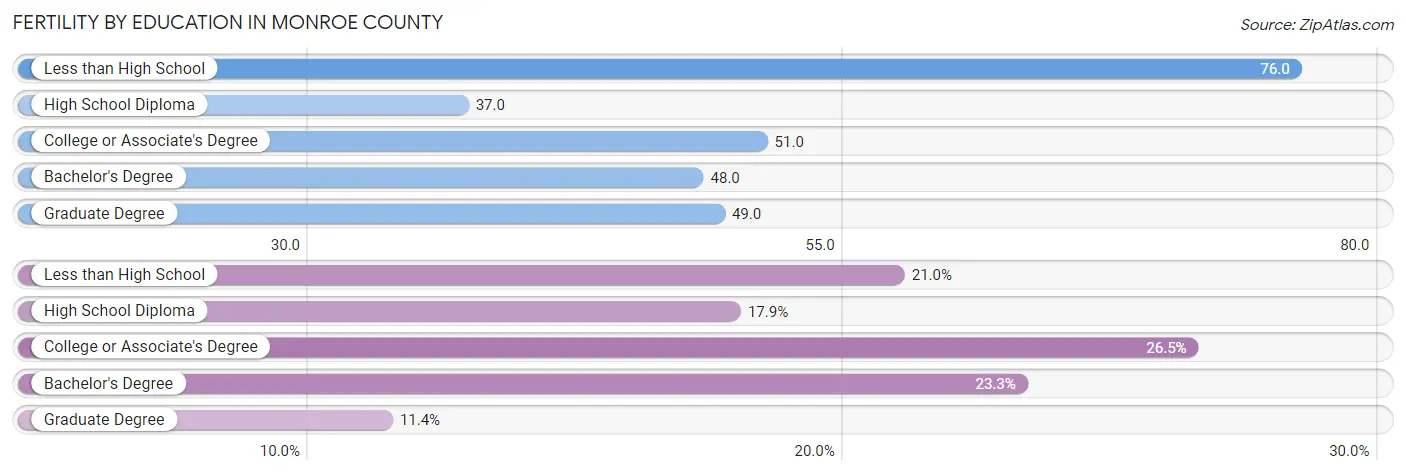
| Educational Attainment | Women with Births | Births / 1,000 Women |
| Less than High School | 164 (21.0%) | 76.0 |
| High School Diploma | 140 (17.9%) | 37.0 |
| College or Associate's Degree | 207 (26.5%) | 51.0 |
| Bachelor's Degree | 182 (23.3%) | 48.0 |
| Graduate Degree | 89 (11.4%) | 49.0 |
| Total | 782 (100.0%) | 50.0 |
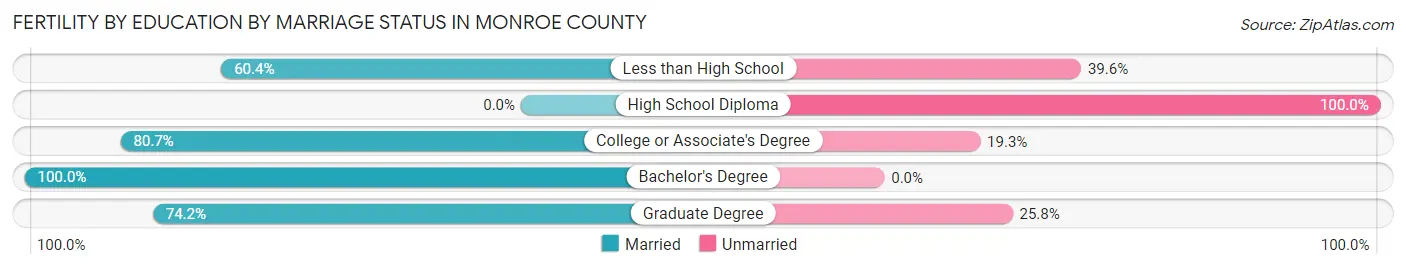
Fertility by Education by Marriage Status in Monroe County
34.3% of women with births in Monroe County are unmarried. Women with the educational attainment of bachelor's degree are most likely to be married with 100.0% of them married at childbirth, while women with the educational attainment of high school diploma are least likely to be married with 100.0% of them unmarried at childbirth.
| Educational Attainment | Married | Unmarried |
| Less than High School | 99 (60.4%) | 65 (39.6%) |
| High School Diploma | 0 (0.0%) | 140 (100.0%) |
| College or Associate's Degree | 167 (80.7%) | 40 (19.3%) |
| Bachelor's Degree | 182 (100.0%) | 0 (0.0%) |
| Graduate Degree | 66 (74.2%) | 23 (25.8%) |
| Total | 514 (65.7%) | 268 (34.3%) |
Employment Characteristics in Monroe County
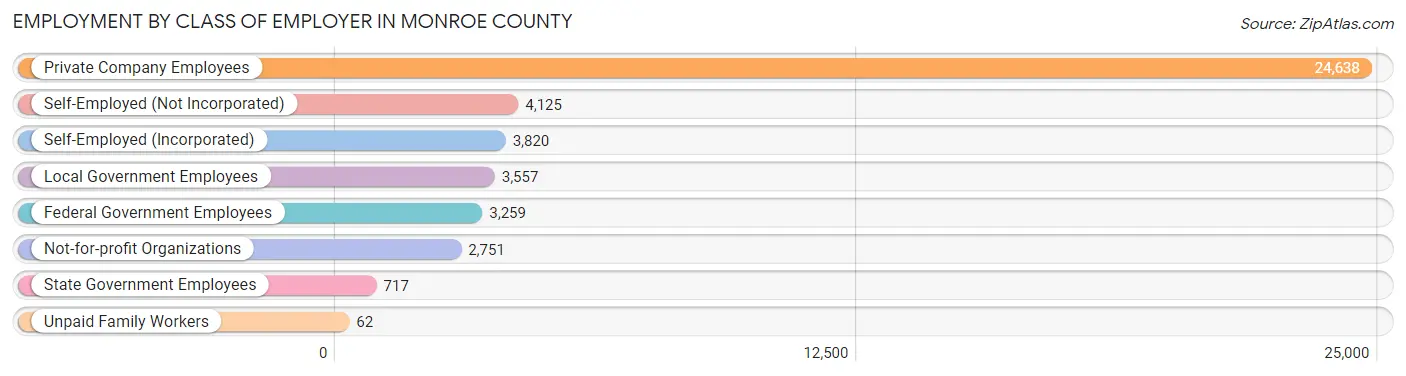
Employment by Class of Employer in Monroe County
Among the 42,929 employed individuals in Monroe County, private company employees (24,638 | 57.4%), self-employed (not incorporated) (4,125 | 9.6%), and self-employed (incorporated) (3,820 | 8.9%) make up the most common classes of employment.
| Employer Class | # Employees | % Employees |
| Private Company Employees | 24,638 | 57.4% |
| Self-Employed (Incorporated) | 3,820 | 8.9% |
| Self-Employed (Not Incorporated) | 4,125 | 9.6% |
| Not-for-profit Organizations | 2,751 | 6.4% |
| Local Government Employees | 3,557 | 8.3% |
| State Government Employees | 717 | 1.7% |
| Federal Government Employees | 3,259 | 7.6% |
| Unpaid Family Workers | 62 | 0.1% |
| Total | 42,929 | 100.0% |
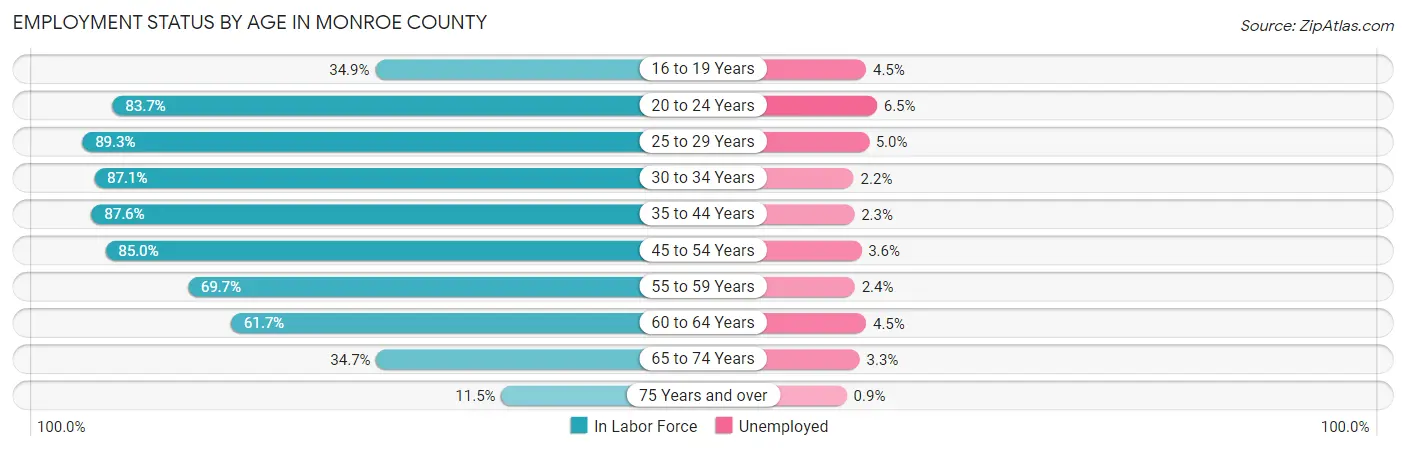
Employment Status by Age in Monroe County
According to the labor force statistics for Monroe County, out of the total population over 16 years of age (70,880), 63.6% or 45,080 individuals are in the labor force, with 3.4% or 1,533 of them unemployed. The age group with the highest labor force participation rate is 25 to 29 years, with 89.3% or 4,119 individuals in the labor force. Within the labor force, the 20 to 24 years age range has the highest percentage of unemployed individuals, with 6.5% or 191 of them being unemployed.
| Age Bracket | In Labor Force | Unemployed |
| 16 to 19 Years | 1,091 (34.9%) | 49 (4.5%) |
| 20 to 24 Years | 2,937 (83.7%) | 191 (6.5%) |
| 25 to 29 Years | 4,119 (89.3%) | 206 (5.0%) |
| 30 to 34 Years | 4,272 (87.1%) | 94 (2.2%) |
| 35 to 44 Years | 8,871 (87.6%) | 204 (2.3%) |
| 45 to 54 Years | 9,831 (85.0%) | 354 (3.6%) |
| 55 to 59 Years | 4,796 (69.7%) | 115 (2.4%) |
| 60 to 64 Years | 4,231 (61.7%) | 190 (4.5%) |
| 65 to 74 Years | 4,038 (34.7%) | 133 (3.3%) |
| 75 Years and over | 881 (11.5%) | 8 (0.9%) |
| Total | 45,080 (63.6%) | 1,533 (3.4%) |
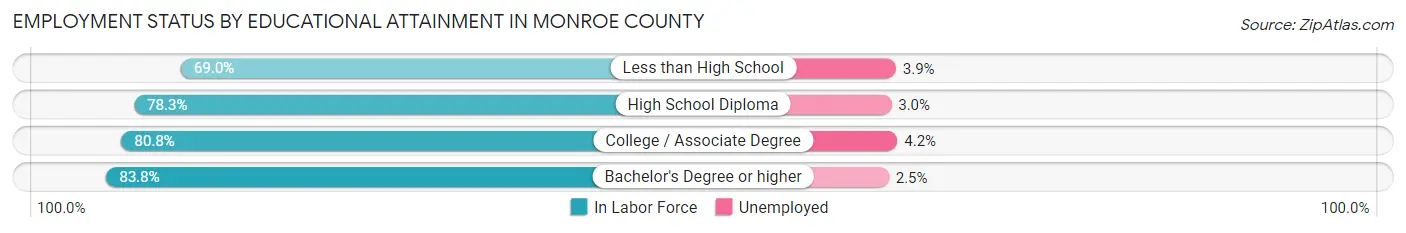
Employment Status by Educational Attainment in Monroe County
According to labor force statistics for Monroe County, 80.4% of individuals (36,138) out of the total population between 25 and 64 years of age (44,948) are in the labor force, with 3.2% or 1,156 of them being unemployed. The group with the highest labor force participation rate are those with the educational attainment of bachelor's degree or higher, with 83.8% or 13,641 individuals in the labor force. Within the labor force, individuals with college / associate degree education have the highest percentage of unemployment, with 4.2% or 424 of them being unemployed.
| Educational Attainment | In Labor Force | Unemployed |
| Less than High School | 2,216 (69.0%) | 125 (3.9%) |
| High School Diploma | 10,148 (78.3%) | 389 (3.0%) |
| College / Associate Degree | 10,099 (80.8%) | 525 (4.2%) |
| Bachelor's Degree or higher | 13,641 (83.8%) | 407 (2.5%) |
| Total | 36,138 (80.4%) | 1,438 (3.2%) |
Employment Occupations by Sex in Monroe County
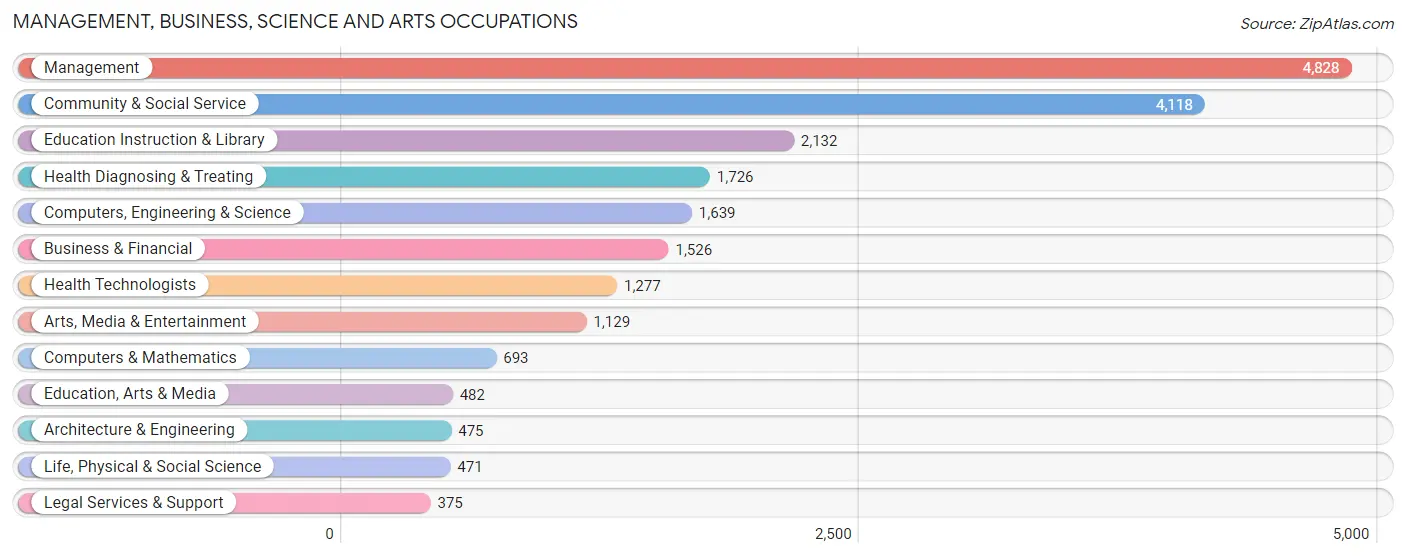
Management, Business, Science and Arts Occupations
The most common Management, Business, Science and Arts occupations in Monroe County are Management (4,828 | 11.4%), Community & Social Service (4,118 | 9.8%), Education Instruction & Library (2,132 | 5.1%), Health Diagnosing & Treating (1,726 | 4.1%), and Computers, Engineering & Science (1,639 | 3.9%).
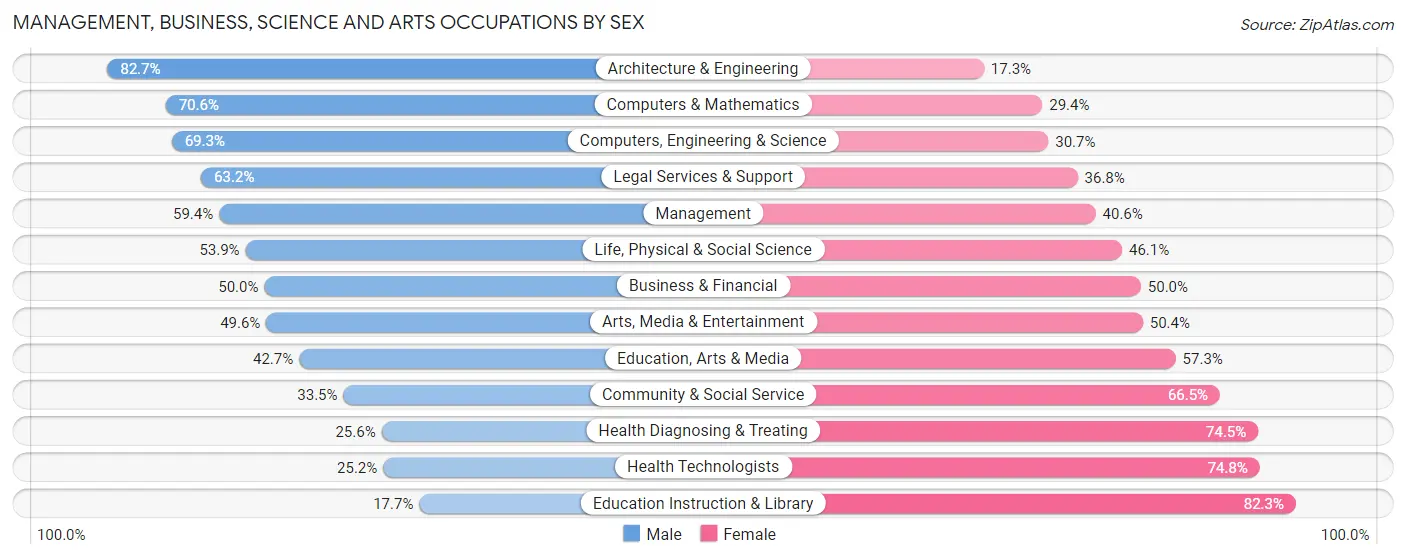
Management, Business, Science and Arts Occupations by Sex
Within the Management, Business, Science and Arts occupations in Monroe County, the most male-oriented occupations are Architecture & Engineering (82.7%), Computers & Mathematics (70.6%), and Computers, Engineering & Science (69.3%), while the most female-oriented occupations are Education Instruction & Library (82.3%), Health Technologists (74.8%), and Health Diagnosing & Treating (74.5%).
| Occupation | Male | Female |
| Management | 2,870 (59.4%) | 1,958 (40.6%) |
| Business & Financial | 763 (50.0%) | 763 (50.0%) |
| Computers, Engineering & Science | 1,136 (69.3%) | 503 (30.7%) |
| Computers & Mathematics | 489 (70.6%) | 204 (29.4%) |
| Architecture & Engineering | 393 (82.7%) | 82 (17.3%) |
| Life, Physical & Social Science | 254 (53.9%) | 217 (46.1%) |
| Community & Social Service | 1,380 (33.5%) | 2,738 (66.5%) |
| Education, Arts & Media | 206 (42.7%) | 276 (57.3%) |
| Legal Services & Support | 237 (63.2%) | 138 (36.8%) |
| Education Instruction & Library | 377 (17.7%) | 1,755 (82.3%) |
| Arts, Media & Entertainment | 560 (49.6%) | 569 (50.4%) |
| Health Diagnosing & Treating | 441 (25.6%) | 1,285 (74.5%) |
| Health Technologists | 322 (25.2%) | 955 (74.8%) |
| Total (Category) | 6,590 (47.6%) | 7,247 (52.4%) |
| Total (Overall) | 22,975 (54.4%) | 19,235 (45.6%) |
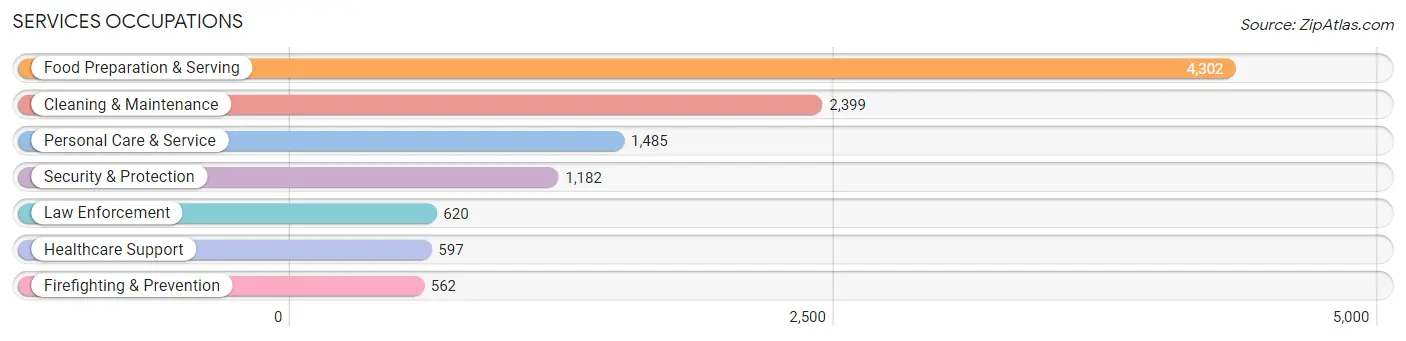
Services Occupations
The most common Services occupations in Monroe County are Food Preparation & Serving (4,302 | 10.2%), Cleaning & Maintenance (2,399 | 5.7%), Personal Care & Service (1,485 | 3.5%), Security & Protection (1,182 | 2.8%), and Law Enforcement (620 | 1.5%).
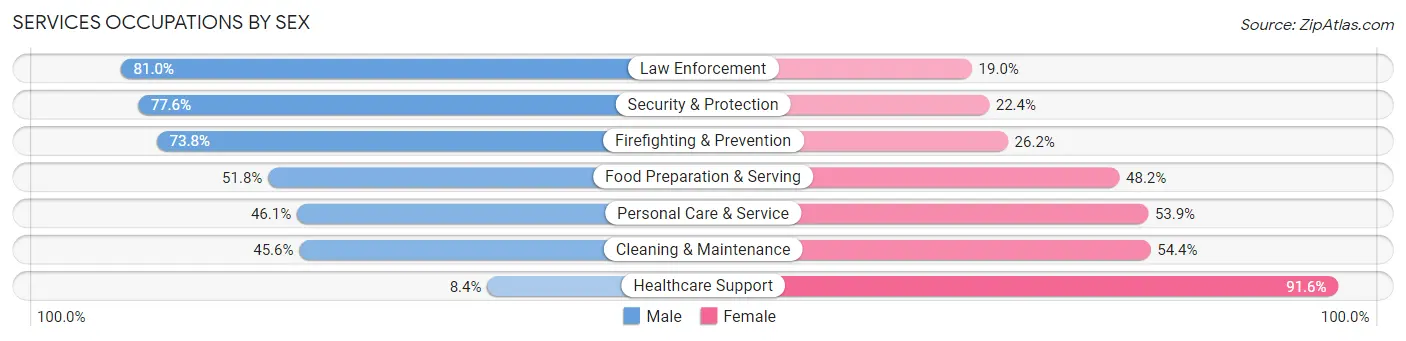
Services Occupations by Sex
Within the Services occupations in Monroe County, the most male-oriented occupations are Law Enforcement (81.0%), Security & Protection (77.6%), and Firefighting & Prevention (73.8%), while the most female-oriented occupations are Healthcare Support (91.6%), Cleaning & Maintenance (54.4%), and Personal Care & Service (53.9%).
| Occupation | Male | Female |
| Healthcare Support | 50 (8.4%) | 547 (91.6%) |
| Security & Protection | 917 (77.6%) | 265 (22.4%) |
| Firefighting & Prevention | 415 (73.8%) | 147 (26.2%) |
| Law Enforcement | 502 (81.0%) | 118 (19.0%) |
| Food Preparation & Serving | 2,227 (51.8%) | 2,075 (48.2%) |
| Cleaning & Maintenance | 1,094 (45.6%) | 1,305 (54.4%) |
| Personal Care & Service | 684 (46.1%) | 801 (53.9%) |
| Total (Category) | 4,972 (49.9%) | 4,993 (50.1%) |
| Total (Overall) | 22,975 (54.4%) | 19,235 (45.6%) |
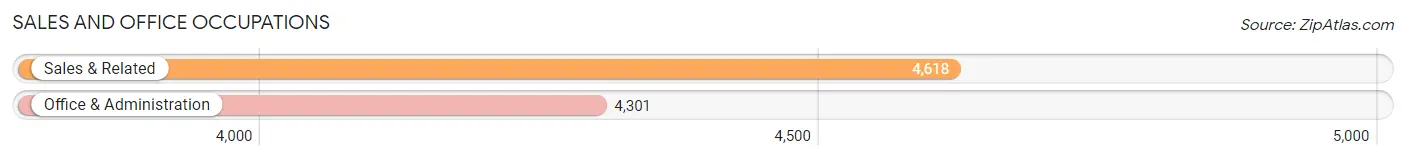
Sales and Office Occupations
The most common Sales and Office occupations in Monroe County are Sales & Related (4,618 | 10.9%), and Office & Administration (4,301 | 10.2%).
Sales and Office Occupations by Sex
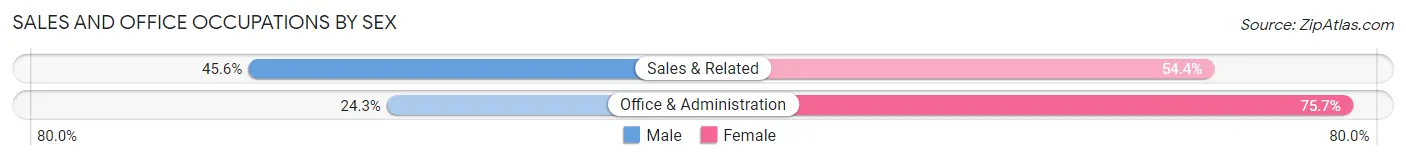
| Occupation | Male | Female |
| Sales & Related | 2,107 (45.6%) | 2,511 (54.4%) |
| Office & Administration | 1,045 (24.3%) | 3,256 (75.7%) |
| Total (Category) | 3,152 (35.3%) | 5,767 (64.7%) |
| Total (Overall) | 22,975 (54.4%) | 19,235 (45.6%) |
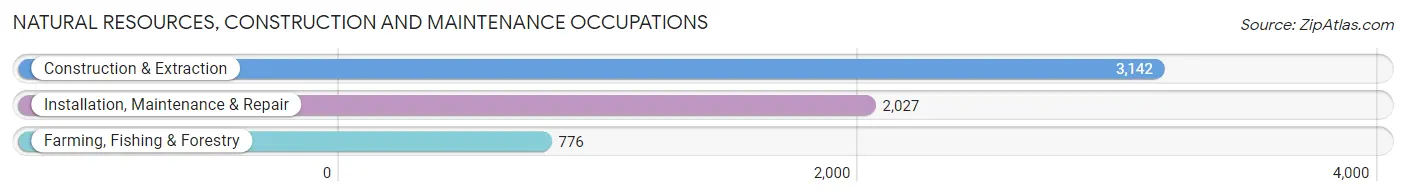
Natural Resources, Construction and Maintenance Occupations
The most common Natural Resources, Construction and Maintenance occupations in Monroe County are Construction & Extraction (3,142 | 7.4%), Installation, Maintenance & Repair (2,027 | 4.8%), and Farming, Fishing & Forestry (776 | 1.8%).
Natural Resources, Construction and Maintenance Occupations by Sex
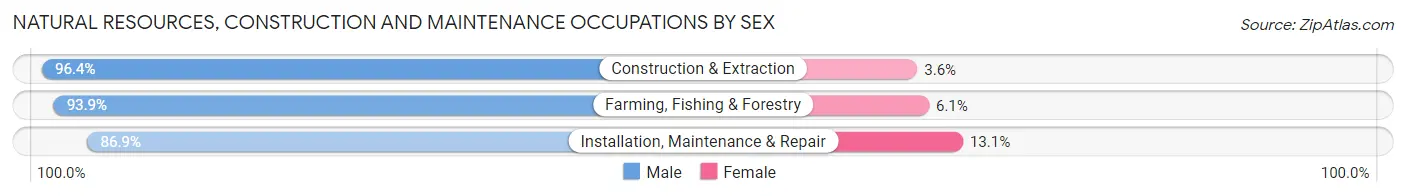
| Occupation | Male | Female |
| Farming, Fishing & Forestry | 729 (93.9%) | 47 (6.1%) |
| Construction & Extraction | 3,028 (96.4%) | 114 (3.6%) |
| Installation, Maintenance & Repair | 1,761 (86.9%) | 266 (13.1%) |
| Total (Category) | 5,518 (92.8%) | 427 (7.2%) |
| Total (Overall) | 22,975 (54.4%) | 19,235 (45.6%) |
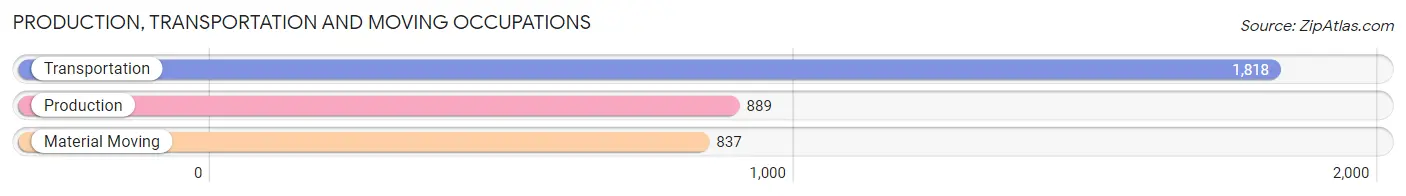
Production, Transportation and Moving Occupations
The most common Production, Transportation and Moving occupations in Monroe County are Transportation (1,818 | 4.3%), Production (889 | 2.1%), and Material Moving (837 | 2.0%).
Production, Transportation and Moving Occupations by Sex
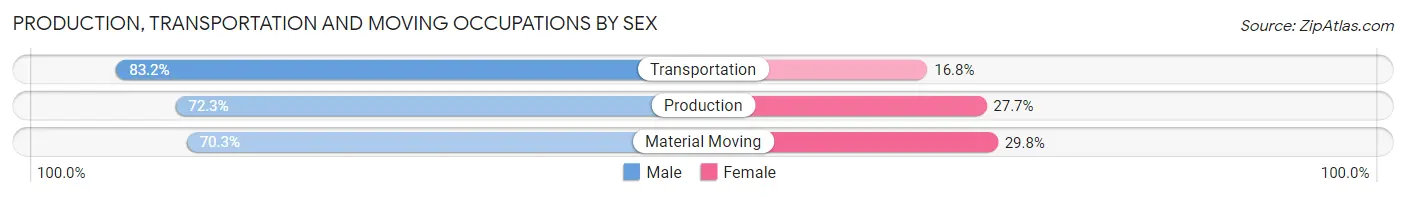
| Occupation | Male | Female |
| Production | 643 (72.3%) | 246 (27.7%) |
| Transportation | 1,512 (83.2%) | 306 (16.8%) |
| Material Moving | 588 (70.3%) | 249 (29.7%) |
| Total (Category) | 2,743 (77.4%) | 801 (22.6%) |
| Total (Overall) | 22,975 (54.4%) | 19,235 (45.6%) |
Employment Industries by Sex in Monroe County
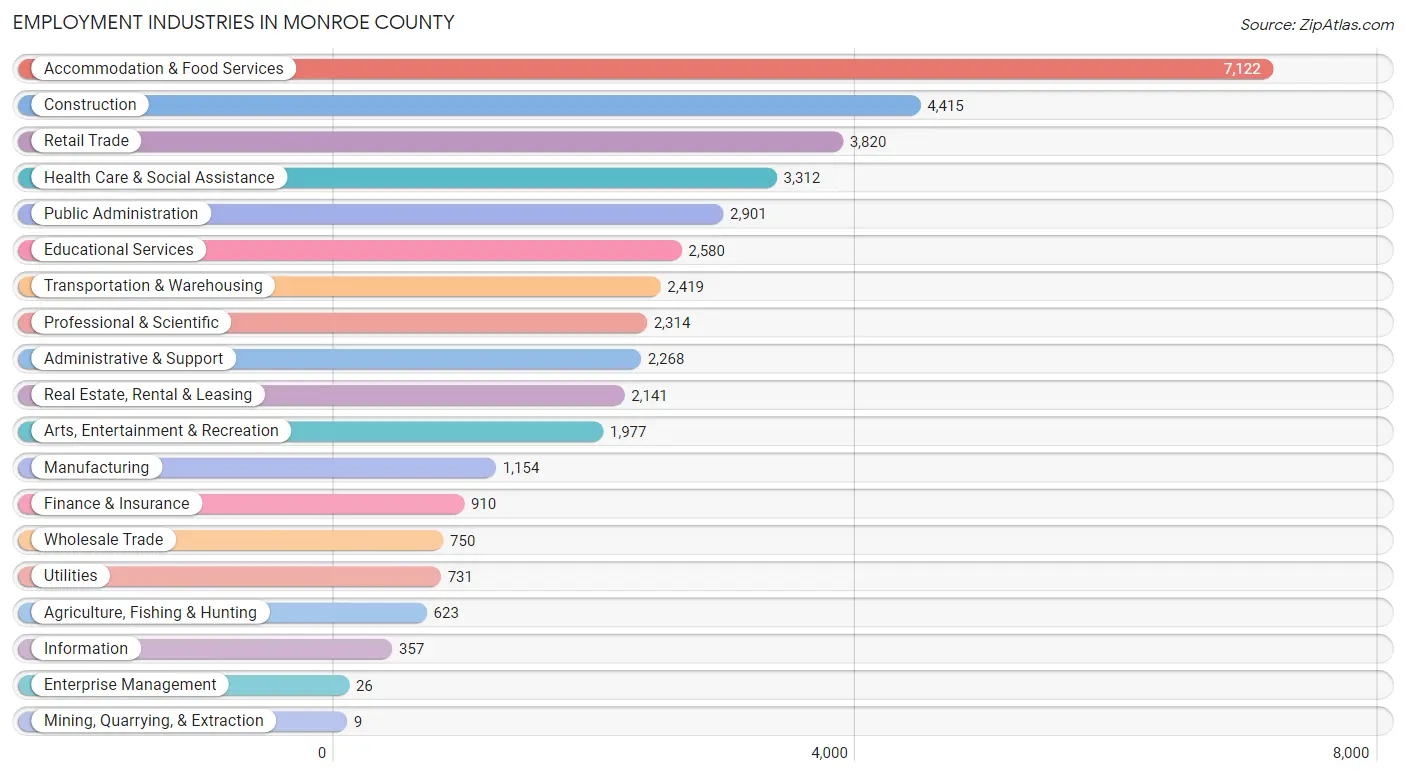
Employment Industries in Monroe County
The major employment industries in Monroe County include Accommodation & Food Services (7,122 | 16.9%), Construction (4,415 | 10.5%), Retail Trade (3,820 | 9.0%), Health Care & Social Assistance (3,312 | 7.9%), and Public Administration (2,901 | 6.9%).
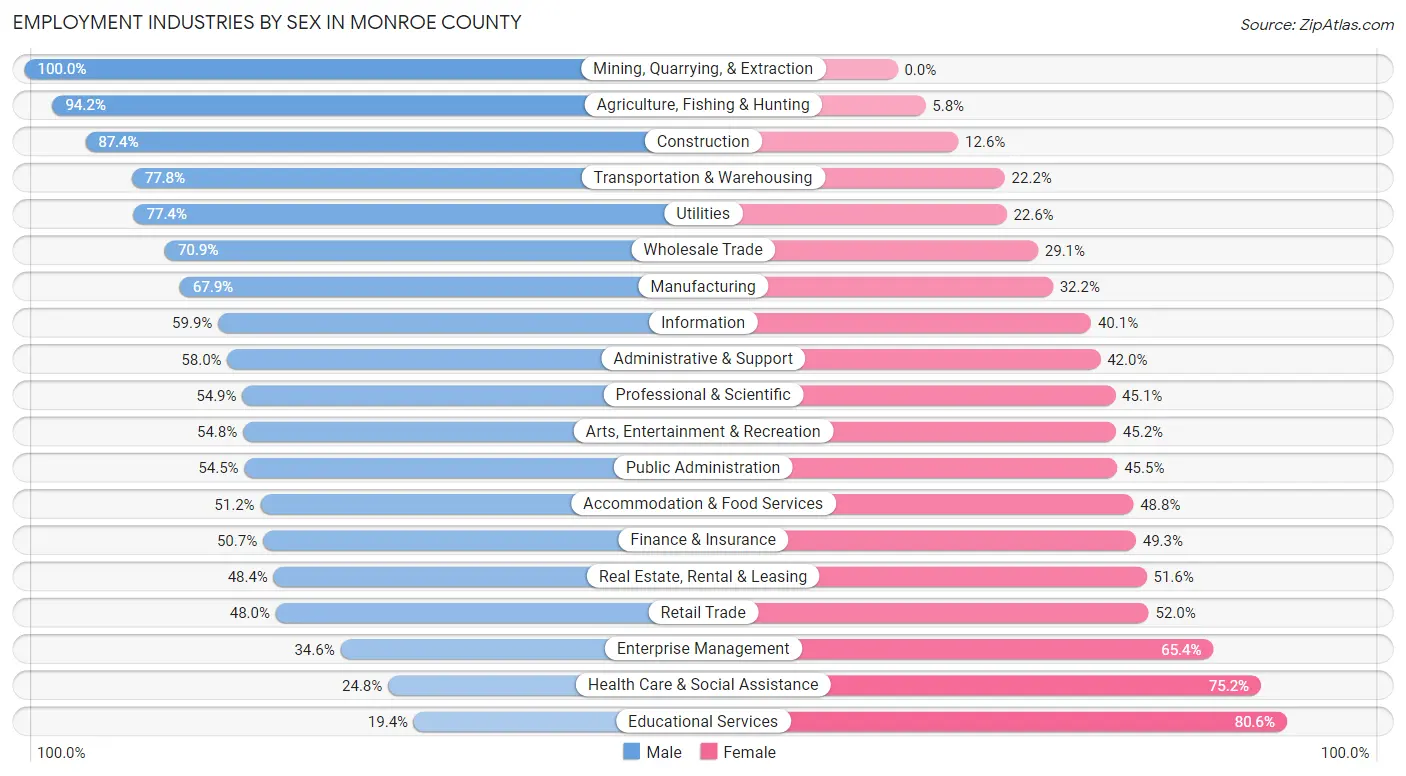
Employment Industries by Sex in Monroe County
The Monroe County industries that see more men than women are Mining, Quarrying, & Extraction (100.0%), Agriculture, Fishing & Hunting (94.2%), and Construction (87.4%), whereas the industries that tend to have a higher number of women are Educational Services (80.6%), Health Care & Social Assistance (75.2%), and Enterprise Management (65.4%).
| Industry | Male | Female |
| Agriculture, Fishing & Hunting | 587 (94.2%) | 36 (5.8%) |
| Mining, Quarrying, & Extraction | 9 (100.0%) | 0 (0.0%) |
| Construction | 3,860 (87.4%) | 555 (12.6%) |
| Manufacturing | 783 (67.8%) | 371 (32.2%) |
| Wholesale Trade | 532 (70.9%) | 218 (29.1%) |
| Retail Trade | 1,834 (48.0%) | 1,986 (52.0%) |
| Transportation & Warehousing | 1,882 (77.8%) | 537 (22.2%) |
| Utilities | 566 (77.4%) | 165 (22.6%) |
| Information | 214 (59.9%) | 143 (40.1%) |
| Finance & Insurance | 461 (50.7%) | 449 (49.3%) |
| Real Estate, Rental & Leasing | 1,037 (48.4%) | 1,104 (51.6%) |
| Professional & Scientific | 1,271 (54.9%) | 1,043 (45.1%) |
| Enterprise Management | 9 (34.6%) | 17 (65.4%) |
| Administrative & Support | 1,316 (58.0%) | 952 (42.0%) |
| Educational Services | 501 (19.4%) | 2,079 (80.6%) |
| Health Care & Social Assistance | 820 (24.8%) | 2,492 (75.2%) |
| Arts, Entertainment & Recreation | 1,083 (54.8%) | 894 (45.2%) |
| Accommodation & Food Services | 3,646 (51.2%) | 3,476 (48.8%) |
| Public Administration | 1,581 (54.5%) | 1,320 (45.5%) |
| Total | 22,975 (54.4%) | 19,235 (45.6%) |
Education in Monroe County
School Enrollment in Monroe County
The most common levels of schooling among the 13,251 students in Monroe County are middle school (3,353 | 25.3%), high school (2,974 | 22.4%), and college / undergraduate (2,461 | 18.6%).
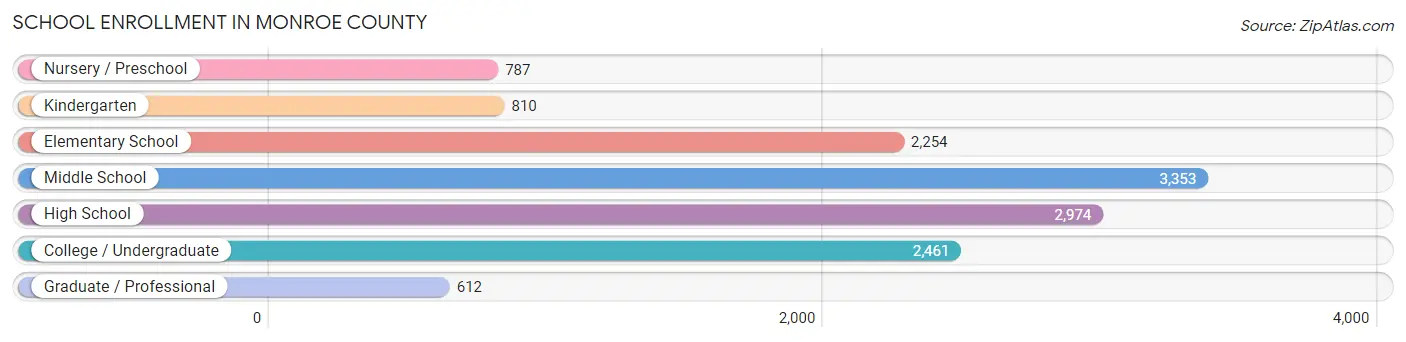
| School Level | # Students | % Students |
| Nursery / Preschool | 787 | 5.9% |
| Kindergarten | 810 | 6.1% |
| Elementary School | 2,254 | 17.0% |
| Middle School | 3,353 | 25.3% |
| High School | 2,974 | 22.4% |
| College / Undergraduate | 2,461 | 18.6% |
| Graduate / Professional | 612 | 4.6% |
| Total | 13,251 | 100.0% |
School Enrollment by Age by Funding Source in Monroe County
Out of a total of 13,251 students who are enrolled in schools in Monroe County, 1,762 (13.3%) attend a private institution, while the remaining 11,489 (86.7%) are enrolled in public schools. The age group of 3 to 4 year olds has the highest likelihood of being enrolled in private schools, with 283 (40.8% in the age bracket) enrolled. Conversely, the age group of 15 to 17 year olds has the lowest likelihood of being enrolled in a private school, with 1,986 (96.7% in the age bracket) attending a public institution.
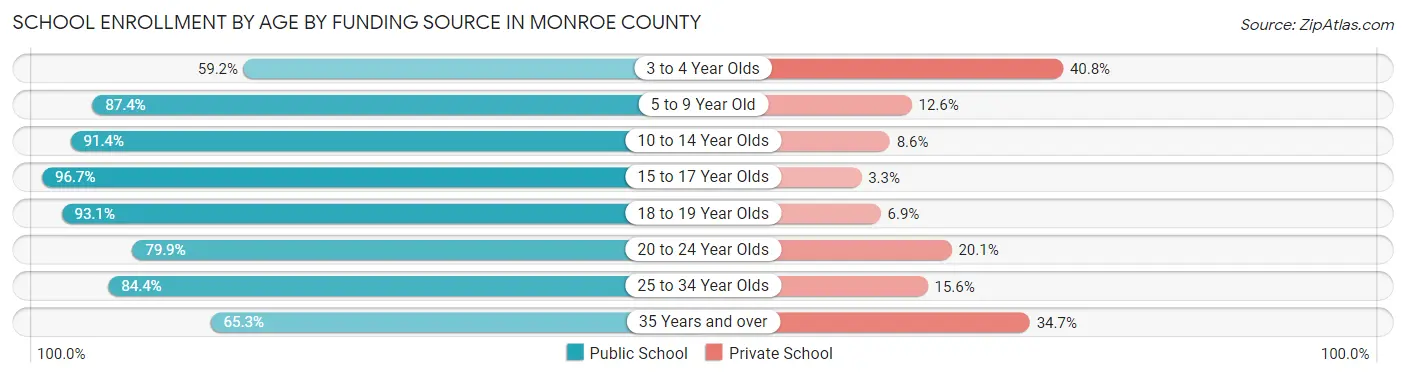
| Age Bracket | Public School | Private School |
| 3 to 4 Year Olds | 410 (59.2%) | 283 (40.8%) |
| 5 to 9 Year Old | 2,598 (87.4%) | 376 (12.6%) |
| 10 to 14 Year Olds | 3,536 (91.4%) | 332 (8.6%) |
| 15 to 17 Year Olds | 1,986 (96.7%) | 67 (3.3%) |
| 18 to 19 Year Olds | 975 (93.1%) | 72 (6.9%) |
| 20 to 24 Year Olds | 808 (79.9%) | 203 (20.1%) |
| 25 to 34 Year Olds | 551 (84.4%) | 102 (15.6%) |
| 35 Years and over | 622 (65.3%) | 330 (34.7%) |
| Total | 11,489 (86.7%) | 1,762 (13.3%) |
Educational Attainment by Field of Study in Monroe County
Business (5,639 | 22.1%), education (2,517 | 9.9%), science & technology (2,409 | 9.5%), social sciences (2,316 | 9.1%), and visual & performing arts (1,651 | 6.5%) are the most common fields of study among 25,491 individuals in Monroe County who have obtained a bachelor's degree or higher.
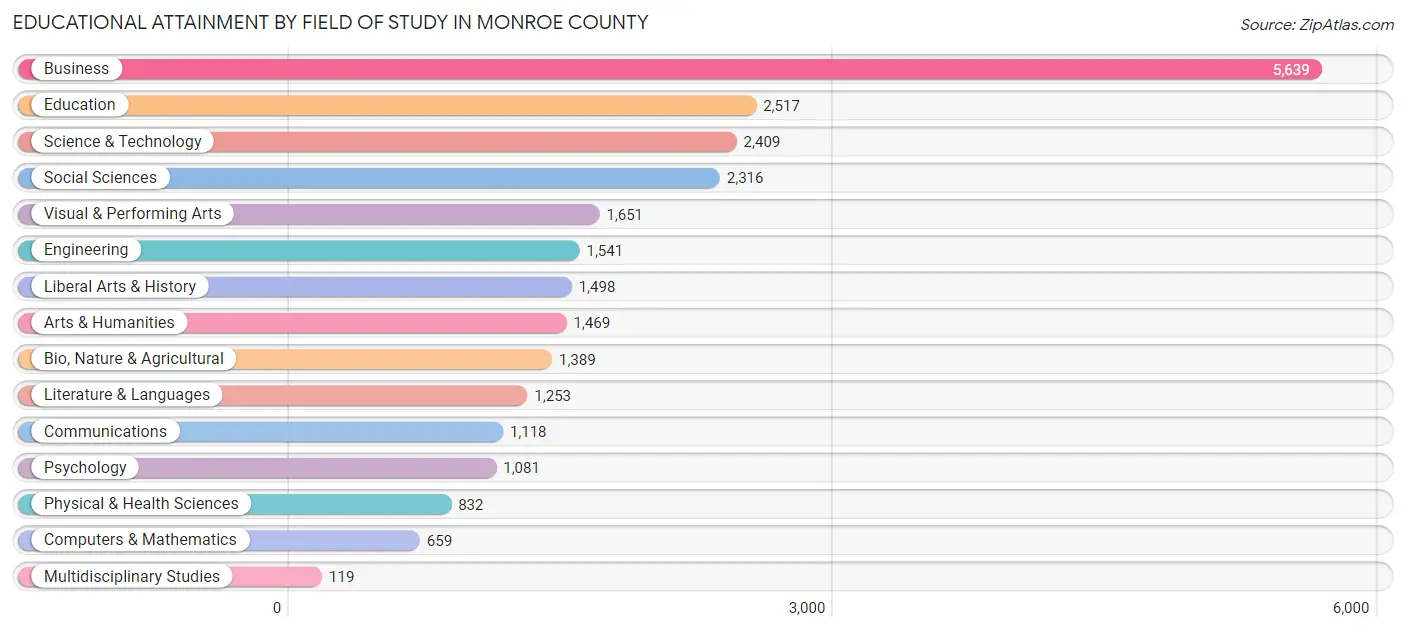
| Field of Study | # Graduates | % Graduates |
| Computers & Mathematics | 659 | 2.6% |
| Bio, Nature & Agricultural | 1,389 | 5.4% |
| Physical & Health Sciences | 832 | 3.3% |
| Psychology | 1,081 | 4.2% |
| Social Sciences | 2,316 | 9.1% |
| Engineering | 1,541 | 6.0% |
| Multidisciplinary Studies | 119 | 0.5% |
| Science & Technology | 2,409 | 9.5% |
| Business | 5,639 | 22.1% |
| Education | 2,517 | 9.9% |
| Literature & Languages | 1,253 | 4.9% |
| Liberal Arts & History | 1,498 | 5.9% |
| Visual & Performing Arts | 1,651 | 6.5% |
| Communications | 1,118 | 4.4% |
| Arts & Humanities | 1,469 | 5.8% |
| Total | 25,491 | 100.0% |
Transportation & Commute in Monroe County
Vehicle Availability by Sex in Monroe County
The most prevalent vehicle ownership categories in Monroe County are males with 2 vehicles (9,924, accounting for 42.1%) and females with 2 vehicles (7,779, making up 52.3%).
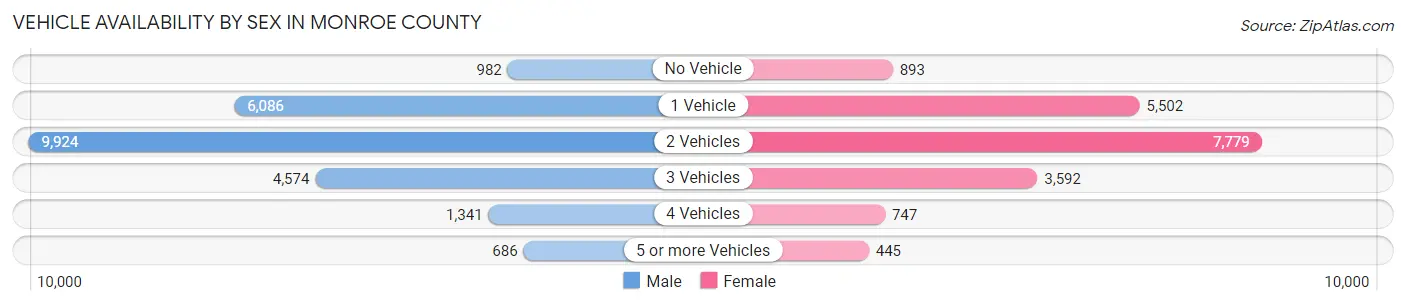
| Vehicles Available | Male | Female |
| No Vehicle | 982 (4.2%) | 893 (4.7%) |
| 1 Vehicle | 6,086 (25.8%) | 5,502 (29.0%) |
| 2 Vehicles | 9,924 (42.1%) | 7,779 (41.0%) |
| 3 Vehicles | 4,574 (19.4%) | 3,592 (19.0%) |
| 4 Vehicles | 1,341 (5.7%) | 747 (3.9%) |
| 5 or more Vehicles | 686 (2.9%) | 445 (2.4%) |
| Total | 23,593 (100.0%) | 18,958 (100.0%) |
Commute Time in Monroe County
The most frequently occuring commute durations in Monroe County are 10 to 14 minutes (8,215 commuters, 21.3%), 5 to 9 minutes (6,892 commuters, 17.9%), and 15 to 19 minutes (6,645 commuters, 17.2%).
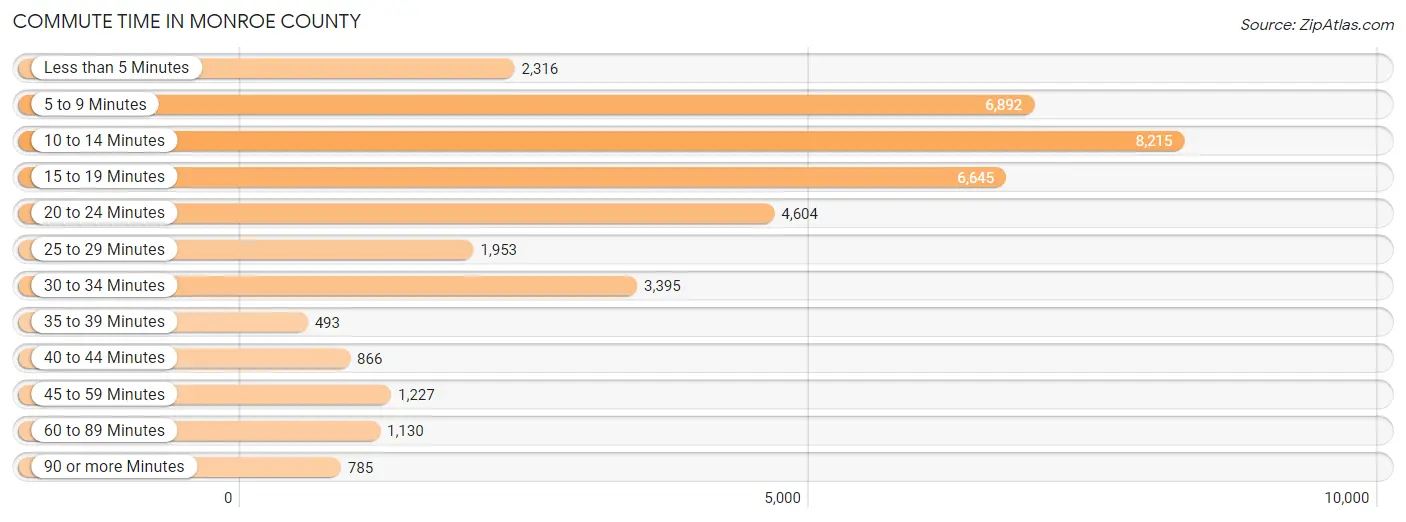
| Commute Time | # Commuters | % Commuters |
| Less than 5 Minutes | 2,316 | 6.0% |
| 5 to 9 Minutes | 6,892 | 17.9% |
| 10 to 14 Minutes | 8,215 | 21.3% |
| 15 to 19 Minutes | 6,645 | 17.2% |
| 20 to 24 Minutes | 4,604 | 11.9% |
| 25 to 29 Minutes | 1,953 | 5.1% |
| 30 to 34 Minutes | 3,395 | 8.8% |
| 35 to 39 Minutes | 493 | 1.3% |
| 40 to 44 Minutes | 866 | 2.2% |
| 45 to 59 Minutes | 1,227 | 3.2% |
| 60 to 89 Minutes | 1,130 | 2.9% |
| 90 or more Minutes | 785 | 2.0% |
Commute Time by Sex in Monroe County
The most common commute times in Monroe County are 10 to 14 minutes (4,479 commuters, 20.7%) for males and 10 to 14 minutes (3,736 commuters, 22.1%) for females.
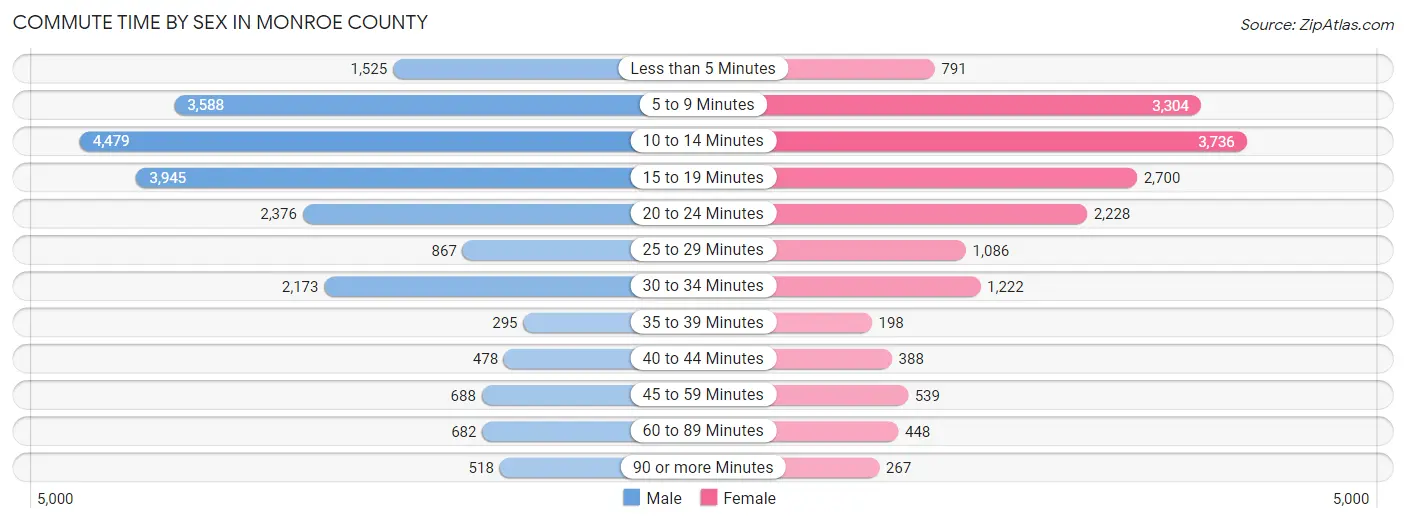
| Commute Time | Male | Female |
| Less than 5 Minutes | 1,525 (7.1%) | 791 (4.7%) |
| 5 to 9 Minutes | 3,588 (16.6%) | 3,304 (19.5%) |
| 10 to 14 Minutes | 4,479 (20.7%) | 3,736 (22.1%) |
| 15 to 19 Minutes | 3,945 (18.2%) | 2,700 (16.0%) |
| 20 to 24 Minutes | 2,376 (11.0%) | 2,228 (13.2%) |
| 25 to 29 Minutes | 867 (4.0%) | 1,086 (6.4%) |
| 30 to 34 Minutes | 2,173 (10.1%) | 1,222 (7.2%) |
| 35 to 39 Minutes | 295 (1.4%) | 198 (1.2%) |
| 40 to 44 Minutes | 478 (2.2%) | 388 (2.3%) |
| 45 to 59 Minutes | 688 (3.2%) | 539 (3.2%) |
| 60 to 89 Minutes | 682 (3.2%) | 448 (2.6%) |
| 90 or more Minutes | 518 (2.4%) | 267 (1.6%) |
Time of Departure to Work by Sex in Monroe County
The most frequent times of departure to work in Monroe County are 7:00 AM to 7:29 AM (3,409, 15.8%) for males and 7:30 AM to 7:59 AM (2,866, 17.0%) for females.
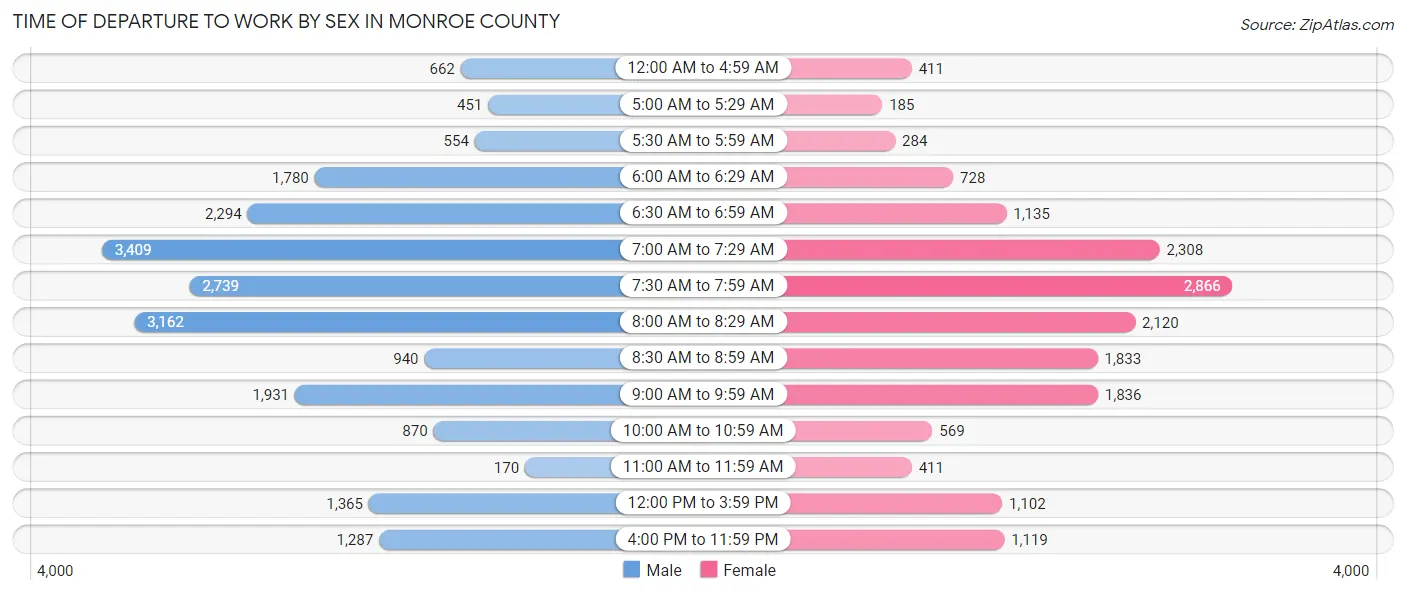
| Time of Departure | Male | Female |
| 12:00 AM to 4:59 AM | 662 (3.1%) | 411 (2.4%) |
| 5:00 AM to 5:29 AM | 451 (2.1%) | 185 (1.1%) |
| 5:30 AM to 5:59 AM | 554 (2.6%) | 284 (1.7%) |
| 6:00 AM to 6:29 AM | 1,780 (8.2%) | 728 (4.3%) |
| 6:30 AM to 6:59 AM | 2,294 (10.6%) | 1,135 (6.7%) |
| 7:00 AM to 7:29 AM | 3,409 (15.8%) | 2,308 (13.7%) |
| 7:30 AM to 7:59 AM | 2,739 (12.7%) | 2,866 (17.0%) |
| 8:00 AM to 8:29 AM | 3,162 (14.6%) | 2,120 (12.5%) |
| 8:30 AM to 8:59 AM | 940 (4.3%) | 1,833 (10.8%) |
| 9:00 AM to 9:59 AM | 1,931 (8.9%) | 1,836 (10.9%) |
| 10:00 AM to 10:59 AM | 870 (4.0%) | 569 (3.4%) |
| 11:00 AM to 11:59 AM | 170 (0.8%) | 411 (2.4%) |
| 12:00 PM to 3:59 PM | 1,365 (6.3%) | 1,102 (6.5%) |
| 4:00 PM to 11:59 PM | 1,287 (5.9%) | 1,119 (6.6%) |
| Total | 21,614 (100.0%) | 16,907 (100.0%) |
Housing Occupancy in Monroe County
Occupancy by Ownership in Monroe County
Of the total 34,388 dwellings in Monroe County, owner-occupied units account for 21,391 (62.2%), while renter-occupied units make up 12,997 (37.8%).
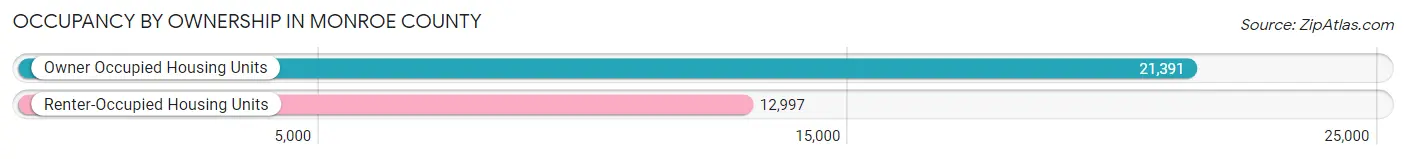
| Occupancy | # Housing Units | % Housing Units |
| Owner Occupied Housing Units | 21,391 | 62.2% |
| Renter-Occupied Housing Units | 12,997 | 37.8% |
| Total Occupied Housing Units | 34,388 | 100.0% |
Occupancy by Household Size in Monroe County
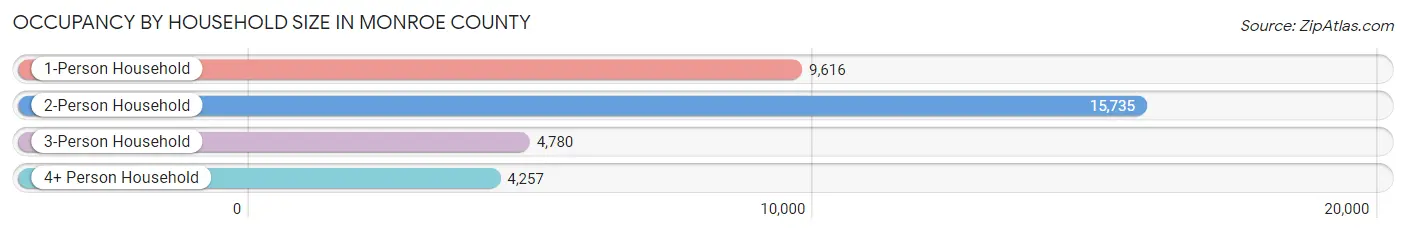
| Household Size | # Housing Units | % Housing Units |
| 1-Person Household | 9,616 | 28.0% |
| 2-Person Household | 15,735 | 45.8% |
| 3-Person Household | 4,780 | 13.9% |
| 4+ Person Household | 4,257 | 12.4% |
| Total Housing Units | 34,388 | 100.0% |
Occupancy by Ownership by Household Size in Monroe County
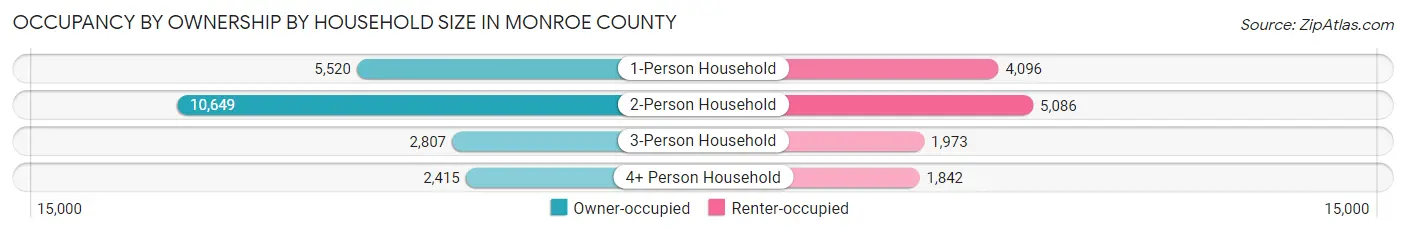
| Household Size | Owner-occupied | Renter-occupied |
| 1-Person Household | 5,520 (57.4%) | 4,096 (42.6%) |
| 2-Person Household | 10,649 (67.7%) | 5,086 (32.3%) |
| 3-Person Household | 2,807 (58.7%) | 1,973 (41.3%) |
| 4+ Person Household | 2,415 (56.7%) | 1,842 (43.3%) |
| Total Housing Units | 21,391 (62.2%) | 12,997 (37.8%) |
Occupancy by Educational Attainment in Monroe County
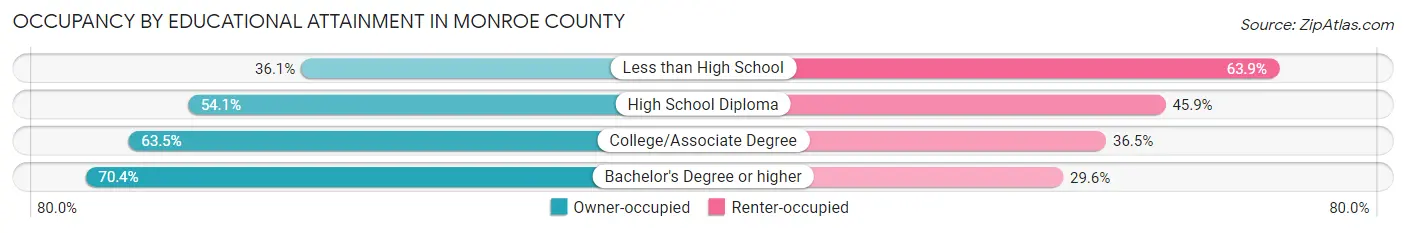
| Household Size | Owner-occupied | Renter-occupied |
| Less than High School | 720 (36.1%) | 1,272 (63.9%) |
| High School Diploma | 4,745 (54.1%) | 4,022 (45.9%) |
| College/Associate Degree | 6,520 (63.5%) | 3,741 (36.5%) |
| Bachelor's Degree or higher | 9,406 (70.4%) | 3,962 (29.6%) |
Occupancy by Age of Householder in Monroe County
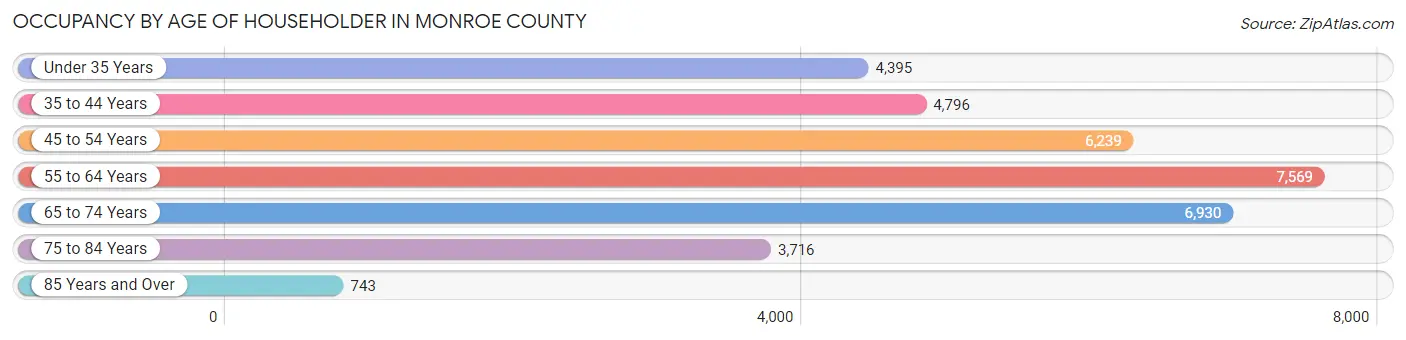
| Age Bracket | # Households | % Households |
| Under 35 Years | 4,395 | 12.8% |
| 35 to 44 Years | 4,796 | 14.0% |
| 45 to 54 Years | 6,239 | 18.1% |
| 55 to 64 Years | 7,569 | 22.0% |
| 65 to 74 Years | 6,930 | 20.2% |
| 75 to 84 Years | 3,716 | 10.8% |
| 85 Years and Over | 743 | 2.2% |
| Total | 34,388 | 100.0% |
Housing Finances in Monroe County
Median Income by Occupancy in Monroe County
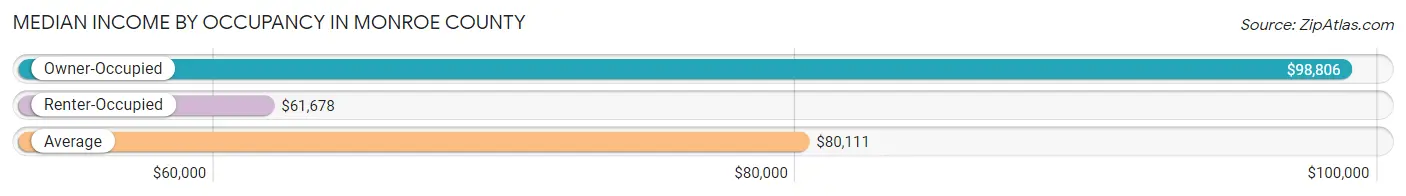
| Occupancy Type | # Households | Median Income |
| Owner-Occupied | 21,391 (62.2%) | $98,806 |
| Renter-Occupied | 12,997 (37.8%) | $61,678 |
| Average | 34,388 (100.0%) | $80,111 |
Occupancy by Householder Income Bracket in Monroe County
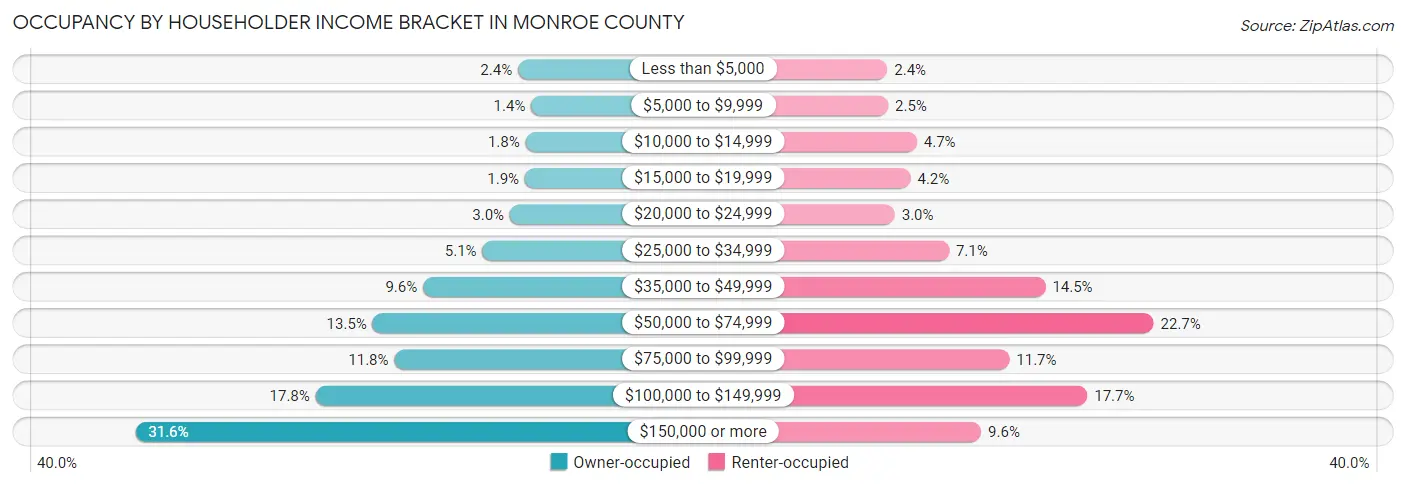
| Income Bracket | Owner-occupied | Renter-occupied |
| Less than $5,000 | 516 (2.4%) | 314 (2.4%) |
| $5,000 to $9,999 | 300 (1.4%) | 322 (2.5%) |
| $10,000 to $14,999 | 391 (1.8%) | 607 (4.7%) |
| $15,000 to $19,999 | 402 (1.9%) | 545 (4.2%) |
| $20,000 to $24,999 | 645 (3.0%) | 389 (3.0%) |
| $25,000 to $34,999 | 1,095 (5.1%) | 925 (7.1%) |
| $35,000 to $49,999 | 2,062 (9.6%) | 1,881 (14.5%) |
| $50,000 to $74,999 | 2,883 (13.5%) | 2,952 (22.7%) |
| $75,000 to $99,999 | 2,530 (11.8%) | 1,523 (11.7%) |
| $100,000 to $149,999 | 3,815 (17.8%) | 2,295 (17.7%) |
| $150,000 or more | 6,752 (31.6%) | 1,244 (9.6%) |
| Total | 21,391 (100.0%) | 12,997 (100.0%) |
Monthly Housing Cost Tiers in Monroe County
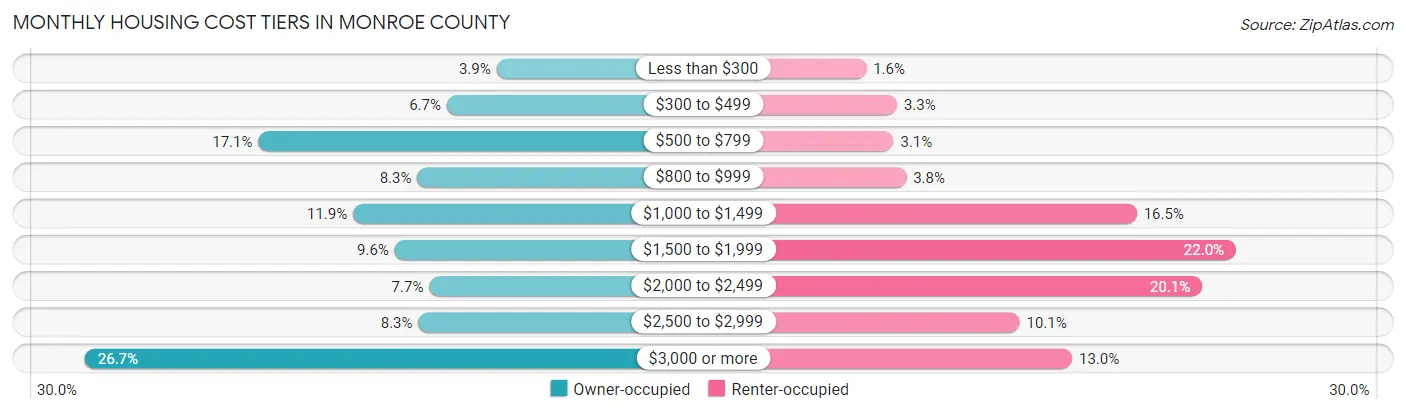
| Monthly Cost | Owner-occupied | Renter-occupied |
| Less than $300 | 841 (3.9%) | 207 (1.6%) |
| $300 to $499 | 1,428 (6.7%) | 427 (3.3%) |
| $500 to $799 | 3,655 (17.1%) | 403 (3.1%) |
| $800 to $999 | 1,778 (8.3%) | 494 (3.8%) |
| $1,000 to $1,499 | 2,538 (11.9%) | 2,148 (16.5%) |
| $1,500 to $1,999 | 2,044 (9.6%) | 2,860 (22.0%) |
| $2,000 to $2,499 | 1,637 (7.6%) | 2,617 (20.1%) |
| $2,500 to $2,999 | 1,765 (8.3%) | 1,307 (10.1%) |
| $3,000 or more | 5,705 (26.7%) | 1,684 (13.0%) |
| Total | 21,391 (100.0%) | 12,997 (100.0%) |
Physical Housing Characteristics in Monroe County
Housing Structures in Monroe County
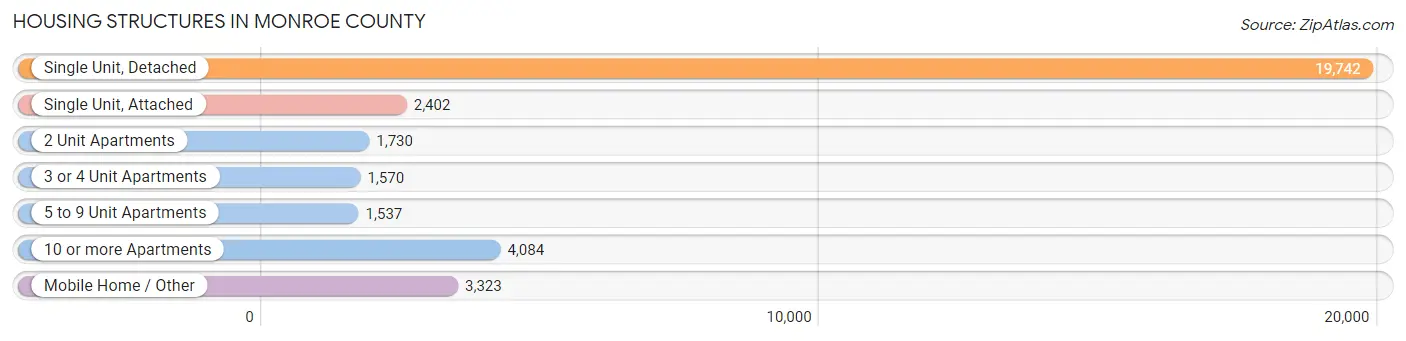
| Structure Type | # Housing Units | % Housing Units |
| Single Unit, Detached | 19,742 | 57.4% |
| Single Unit, Attached | 2,402 | 7.0% |
| 2 Unit Apartments | 1,730 | 5.0% |
| 3 or 4 Unit Apartments | 1,570 | 4.6% |
| 5 to 9 Unit Apartments | 1,537 | 4.5% |
| 10 or more Apartments | 4,084 | 11.9% |
| Mobile Home / Other | 3,323 | 9.7% |
| Total | 34,388 | 100.0% |
Housing Structures by Occupancy in Monroe County
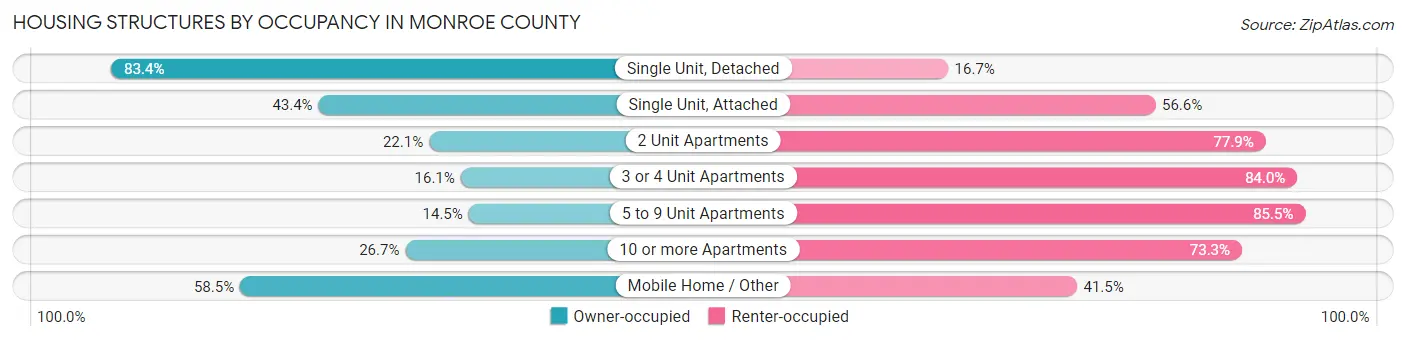
| Structure Type | Owner-occupied | Renter-occupied |
| Single Unit, Detached | 16,454 (83.4%) | 3,288 (16.7%) |
| Single Unit, Attached | 1,043 (43.4%) | 1,359 (56.6%) |
| 2 Unit Apartments | 383 (22.1%) | 1,347 (77.9%) |
| 3 or 4 Unit Apartments | 252 (16.1%) | 1,318 (84.0%) |
| 5 to 9 Unit Apartments | 223 (14.5%) | 1,314 (85.5%) |
| 10 or more Apartments | 1,091 (26.7%) | 2,993 (73.3%) |
| Mobile Home / Other | 1,945 (58.5%) | 1,378 (41.5%) |
| Total | 21,391 (62.2%) | 12,997 (37.8%) |
Housing Structures by Number of Rooms in Monroe County
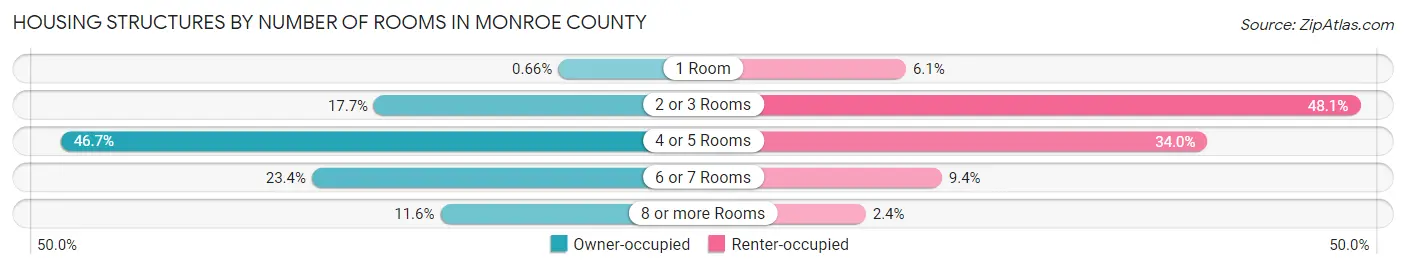
| Number of Rooms | Owner-occupied | Renter-occupied |
| 1 Room | 141 (0.7%) | 794 (6.1%) |
| 2 or 3 Rooms | 3,784 (17.7%) | 6,252 (48.1%) |
| 4 or 5 Rooms | 9,980 (46.7%) | 4,416 (34.0%) |
| 6 or 7 Rooms | 5,015 (23.4%) | 1,225 (9.4%) |
| 8 or more Rooms | 2,471 (11.6%) | 310 (2.4%) |
| Total | 21,391 (100.0%) | 12,997 (100.0%) |
Housing Structure by Heating Type in Monroe County
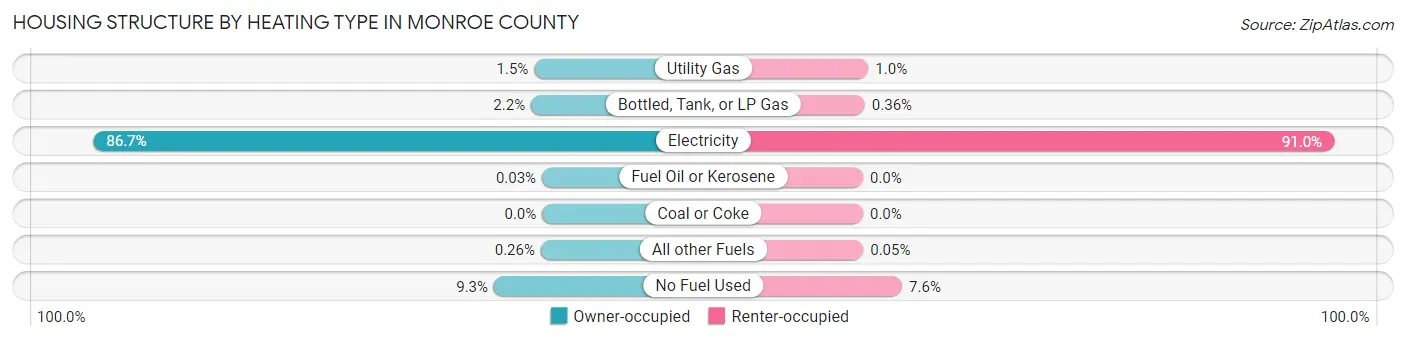
| Heating Type | Owner-occupied | Renter-occupied |
| Utility Gas | 327 (1.5%) | 135 (1.0%) |
| Bottled, Tank, or LP Gas | 460 (2.1%) | 47 (0.4%) |
| Electricity | 18,548 (86.7%) | 11,826 (91.0%) |
| Fuel Oil or Kerosene | 6 (0.0%) | 0 (0.0%) |
| Coal or Coke | 0 (0.0%) | 0 (0.0%) |
| All other Fuels | 56 (0.3%) | 6 (0.1%) |
| No Fuel Used | 1,994 (9.3%) | 983 (7.6%) |
| Total | 21,391 (100.0%) | 12,997 (100.0%) |
Household Vehicle Usage in Monroe County
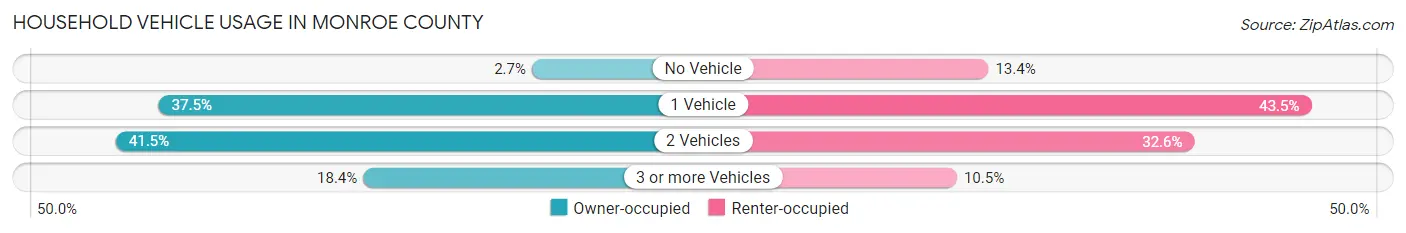
| Vehicles per Household | Owner-occupied | Renter-occupied |
| No Vehicle | 566 (2.6%) | 1,741 (13.4%) |
| 1 Vehicle | 8,017 (37.5%) | 5,658 (43.5%) |
| 2 Vehicles | 8,873 (41.5%) | 4,238 (32.6%) |
| 3 or more Vehicles | 3,935 (18.4%) | 1,360 (10.5%) |
| Total | 21,391 (100.0%) | 12,997 (100.0%) |
Real Estate & Mortgages in Monroe County
Real Estate and Mortgage Overview in Monroe County
| Characteristic | Without Mortgage | With Mortgage |
| Housing Units | 11,434 | 9,957 |
| Median Property Value | $700,200 | $694,200 |
| Median Household Income | $80,154 | $3,887 |
| Monthly Housing Costs | $794 | $5,430 |
| Real Estate Taxes | $3,475 | $205 |
Property Value by Mortgage Status in Monroe County
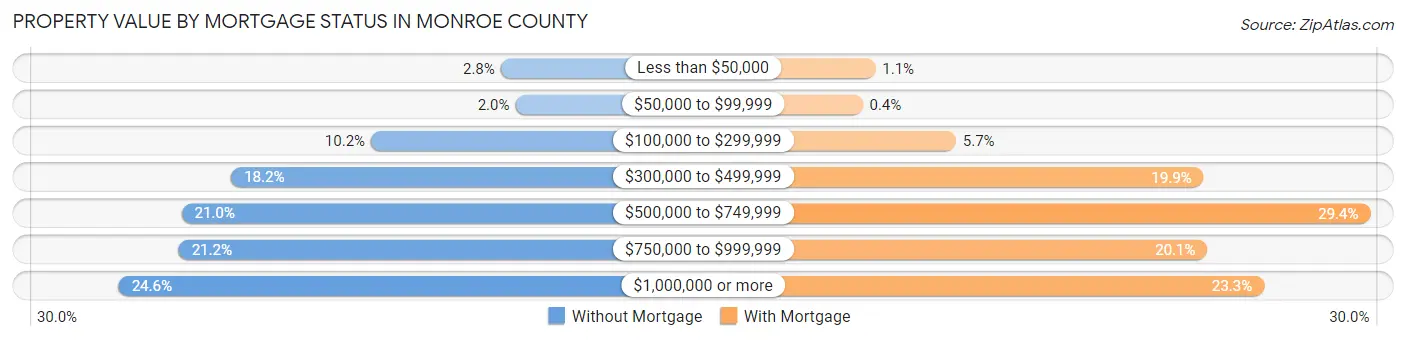
| Property Value | Without Mortgage | With Mortgage |
| Less than $50,000 | 320 (2.8%) | 113 (1.1%) |
| $50,000 to $99,999 | 224 (2.0%) | 40 (0.4%) |
| $100,000 to $299,999 | 1,167 (10.2%) | 571 (5.7%) |
| $300,000 to $499,999 | 2,080 (18.2%) | 1,980 (19.9%) |
| $500,000 to $749,999 | 2,405 (21.0%) | 2,928 (29.4%) |
| $750,000 to $999,999 | 2,423 (21.2%) | 2,001 (20.1%) |
| $1,000,000 or more | 2,815 (24.6%) | 2,324 (23.3%) |
| Total | 11,434 (100.0%) | 9,957 (100.0%) |
Household Income by Mortgage Status in Monroe County
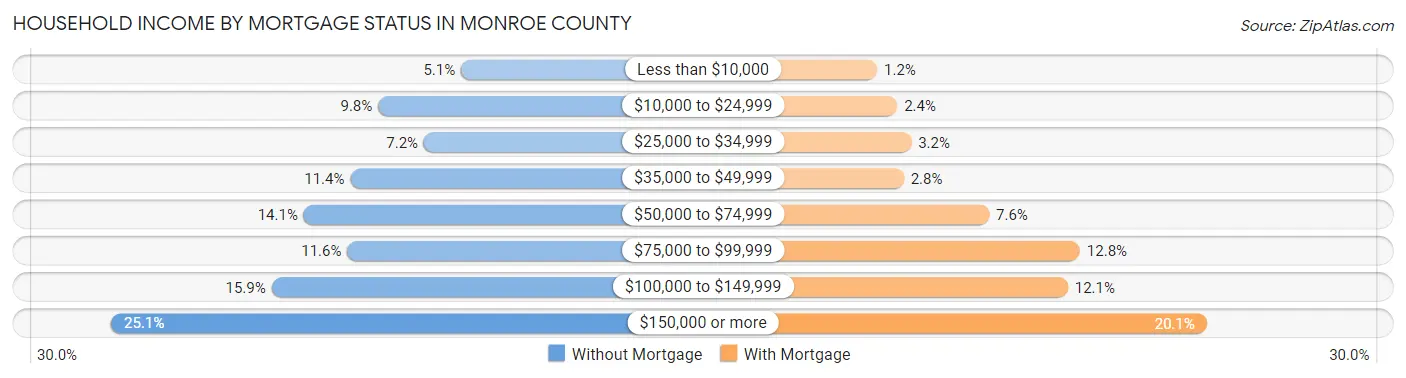
| Household Income | Without Mortgage | With Mortgage |
| Less than $10,000 | 579 (5.1%) | 122 (1.2%) |
| $10,000 to $24,999 | 1,121 (9.8%) | 237 (2.4%) |
| $25,000 to $34,999 | 821 (7.2%) | 317 (3.2%) |
| $35,000 to $49,999 | 1,302 (11.4%) | 274 (2.8%) |
| $50,000 to $74,999 | 1,607 (14.1%) | 760 (7.6%) |
| $75,000 to $99,999 | 1,322 (11.6%) | 1,276 (12.8%) |
| $100,000 to $149,999 | 1,817 (15.9%) | 1,208 (12.1%) |
| $150,000 or more | 2,865 (25.1%) | 1,998 (20.1%) |
| Total | 11,434 (100.0%) | 9,957 (100.0%) |
Property Value to Household Income Ratio in Monroe County
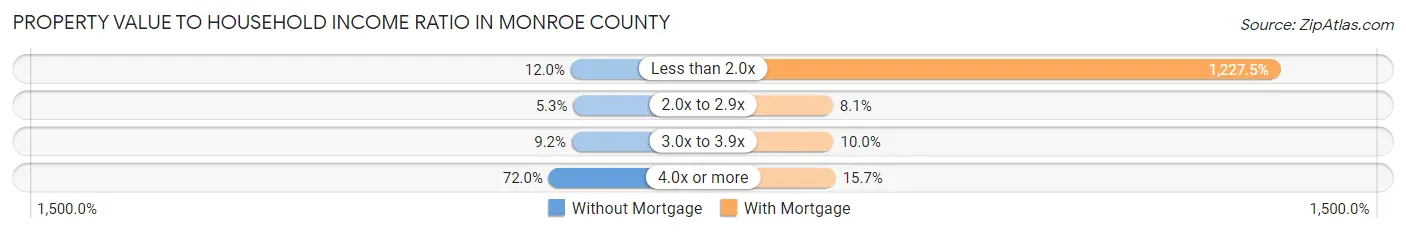
| Value-to-Income Ratio | Without Mortgage | With Mortgage |
| Less than 2.0x | 1,367 (12.0%) | 122,221 (1,227.5%) |
| 2.0x to 2.9x | 605 (5.3%) | 809 (8.1%) |
| 3.0x to 3.9x | 1,048 (9.2%) | 994 (10.0%) |
| 4.0x or more | 8,229 (72.0%) | 1,567 (15.7%) |
| Total | 11,434 (100.0%) | 9,957 (100.0%) |
Real Estate Taxes by Mortgage Status in Monroe County
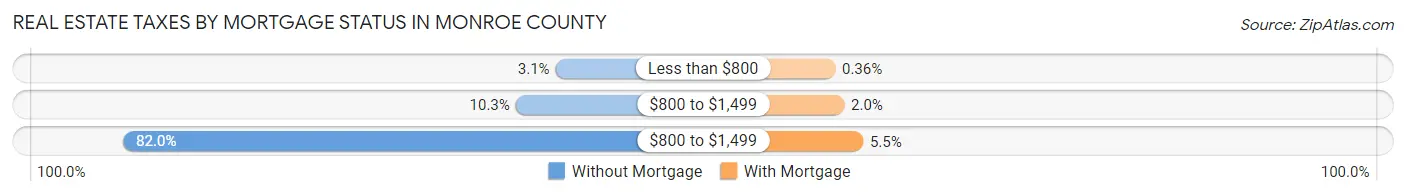
| Property Taxes | Without Mortgage | With Mortgage |
| Less than $800 | 349 (3.0%) | 36 (0.4%) |
| $800 to $1,499 | 1,180 (10.3%) | 201 (2.0%) |
| $800 to $1,499 | 9,378 (82.0%) | 544 (5.5%) |
| Total | 11,434 (100.0%) | 9,957 (100.0%) |
Health & Disability in Monroe County
Health Insurance Coverage by Age in Monroe County
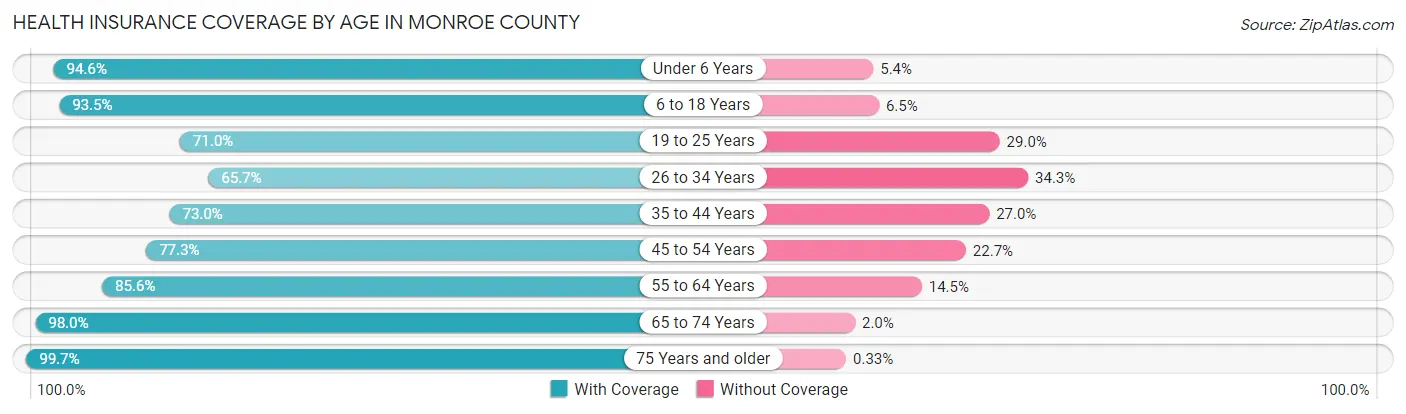
| Age Bracket | With Coverage | Without Coverage |
| Under 6 Years | 4,302 (94.6%) | 246 (5.4%) |
| 6 to 18 Years | 8,557 (93.5%) | 591 (6.5%) |
| 19 to 25 Years | 3,079 (71.0%) | 1,256 (29.0%) |
| 26 to 34 Years | 5,244 (65.7%) | 2,735 (34.3%) |
| 35 to 44 Years | 7,116 (73.0%) | 2,634 (27.0%) |
| 45 to 54 Years | 8,838 (77.3%) | 2,593 (22.7%) |
| 55 to 64 Years | 11,652 (85.6%) | 1,968 (14.4%) |
| 65 to 74 Years | 11,362 (98.0%) | 232 (2.0%) |
| 75 Years and older | 7,524 (99.7%) | 25 (0.3%) |
| Total | 67,674 (84.6%) | 12,280 (15.4%) |
Health Insurance Coverage by Citizenship Status in Monroe County
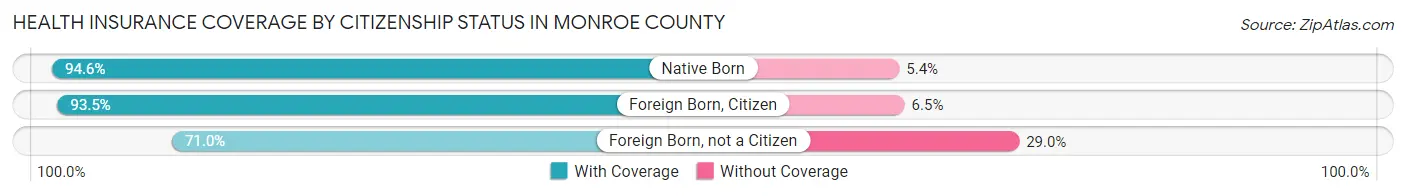
| Citizenship Status | With Coverage | Without Coverage |
| Native Born | 4,302 (94.6%) | 246 (5.4%) |
| Foreign Born, Citizen | 8,557 (93.5%) | 591 (6.5%) |
| Foreign Born, not a Citizen | 3,079 (71.0%) | 1,256 (29.0%) |
Health Insurance Coverage by Household Income in Monroe County
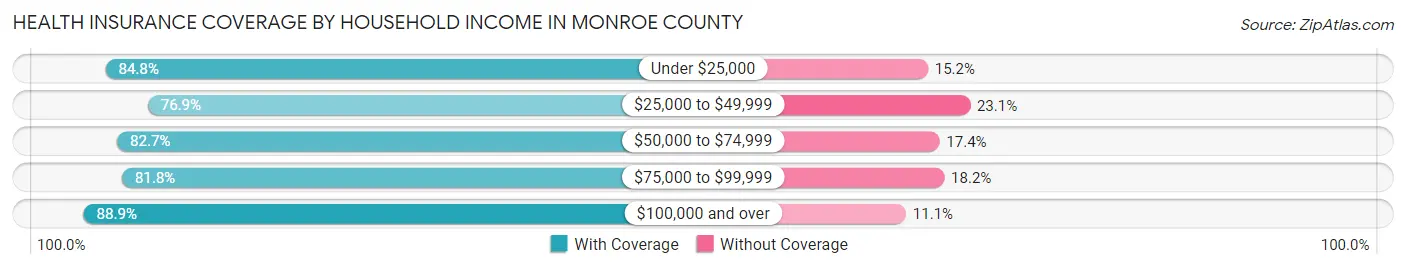
| Household Income | With Coverage | Without Coverage |
| Under $25,000 | 5,875 (84.8%) | 1,051 (15.2%) |
| $25,000 to $49,999 | 8,813 (76.9%) | 2,644 (23.1%) |
| $50,000 to $74,999 | 10,818 (82.7%) | 2,271 (17.3%) |
| $75,000 to $99,999 | 8,289 (81.8%) | 1,849 (18.2%) |
| $100,000 and over | 33,438 (88.9%) | 4,163 (11.1%) |
Public vs Private Health Insurance Coverage by Age in Monroe County
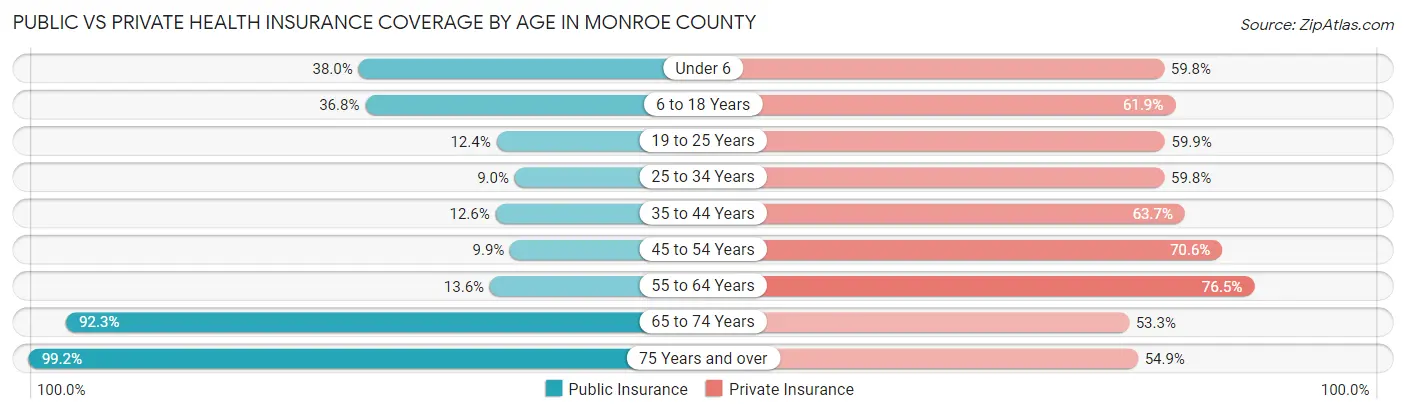
| Age Bracket | Public Insurance | Private Insurance |
| Under 6 | 1,729 (38.0%) | 2,718 (59.8%) |
| 6 to 18 Years | 3,364 (36.8%) | 5,659 (61.9%) |
| 19 to 25 Years | 538 (12.4%) | 2,597 (59.9%) |
| 25 to 34 Years | 719 (9.0%) | 4,773 (59.8%) |
| 35 to 44 Years | 1,228 (12.6%) | 6,206 (63.6%) |
| 45 to 54 Years | 1,128 (9.9%) | 8,070 (70.6%) |
| 55 to 64 Years | 1,857 (13.6%) | 10,424 (76.5%) |
| 65 to 74 Years | 10,703 (92.3%) | 6,175 (53.3%) |
| 75 Years and over | 7,491 (99.2%) | 4,146 (54.9%) |
| Total | 28,757 (36.0%) | 50,768 (63.5%) |
Disability Status by Sex by Age in Monroe County
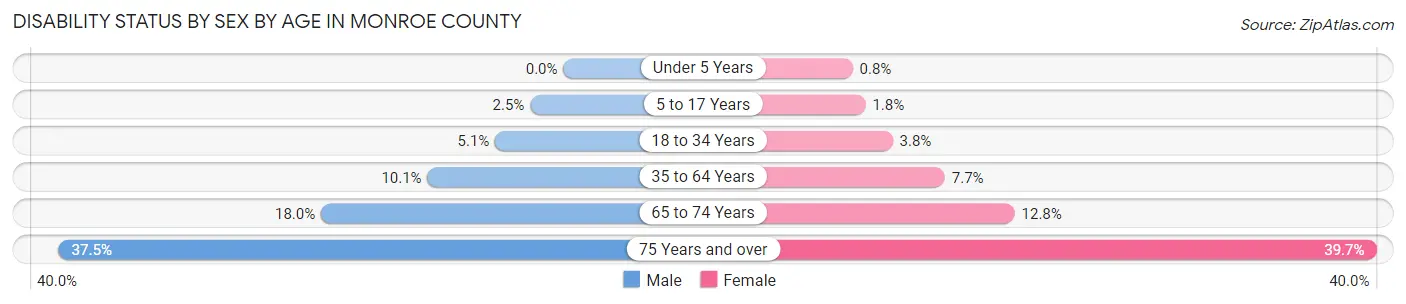
| Age Bracket | Male | Female |
| Under 5 Years | 0 (0.0%) | 16 (0.8%) |
| 5 to 17 Years | 120 (2.5%) | 75 (1.8%) |
| 18 to 34 Years | 324 (5.1%) | 254 (3.8%) |
| 35 to 64 Years | 1,815 (10.1%) | 1,286 (7.6%) |
| 65 to 74 Years | 1,092 (18.0%) | 709 (12.8%) |
| 75 Years and over | 1,454 (37.5%) | 1,456 (39.7%) |
Disability Class by Sex by Age in Monroe County
Disability Class: Hearing Difficulty
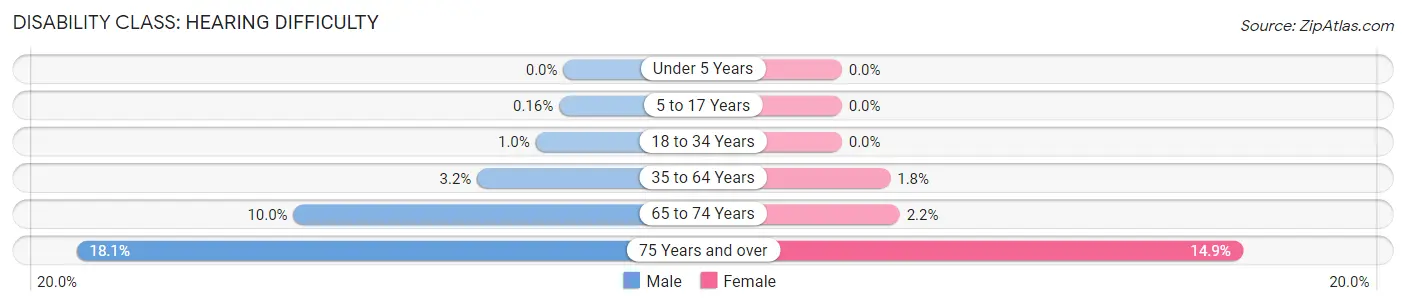
| Age Bracket | Male | Female |
| Under 5 Years | 0 (0.0%) | 0 (0.0%) |
| 5 to 17 Years | 8 (0.2%) | 0 (0.0%) |
| 18 to 34 Years | 66 (1.0%) | 0 (0.0%) |
| 35 to 64 Years | 576 (3.2%) | 302 (1.8%) |
| 65 to 74 Years | 608 (10.0%) | 119 (2.1%) |
| 75 Years and over | 701 (18.1%) | 546 (14.9%) |
Disability Class: Vision Difficulty
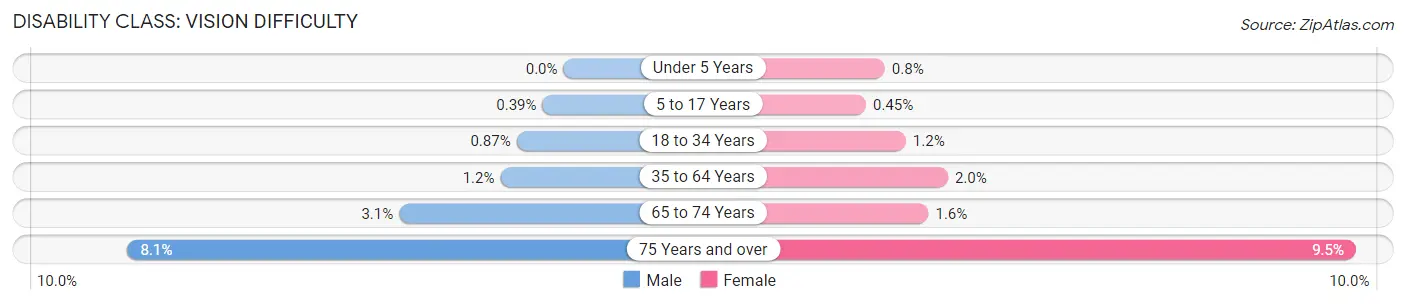
| Age Bracket | Male | Female |
| Under 5 Years | 0 (0.0%) | 16 (0.8%) |
| 5 to 17 Years | 19 (0.4%) | 19 (0.4%) |
| 18 to 34 Years | 56 (0.9%) | 80 (1.2%) |
| 35 to 64 Years | 210 (1.2%) | 331 (2.0%) |
| 65 to 74 Years | 185 (3.0%) | 89 (1.6%) |
| 75 Years and over | 314 (8.1%) | 350 (9.5%) |
Disability Class: Cognitive Difficulty
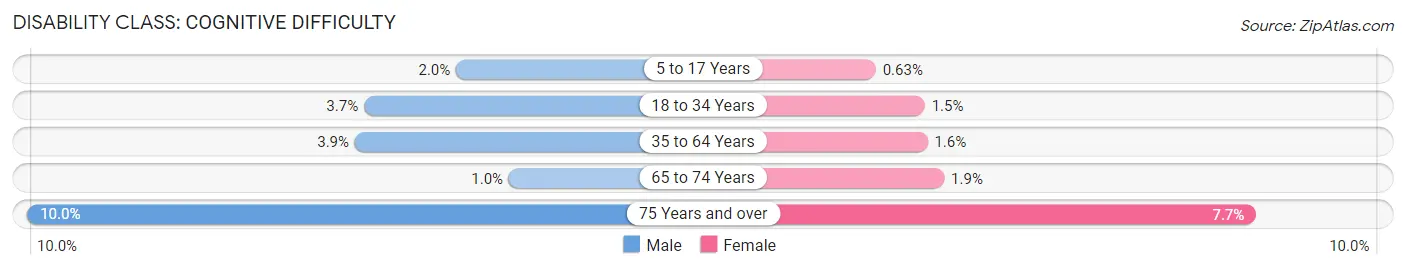
| Age Bracket | Male | Female |
| 5 to 17 Years | 97 (2.0%) | 27 (0.6%) |
| 18 to 34 Years | 237 (3.7%) | 104 (1.5%) |
| 35 to 64 Years | 697 (3.9%) | 268 (1.6%) |
| 65 to 74 Years | 61 (1.0%) | 105 (1.9%) |
| 75 Years and over | 386 (10.0%) | 282 (7.7%) |
Disability Class: Ambulatory Difficulty
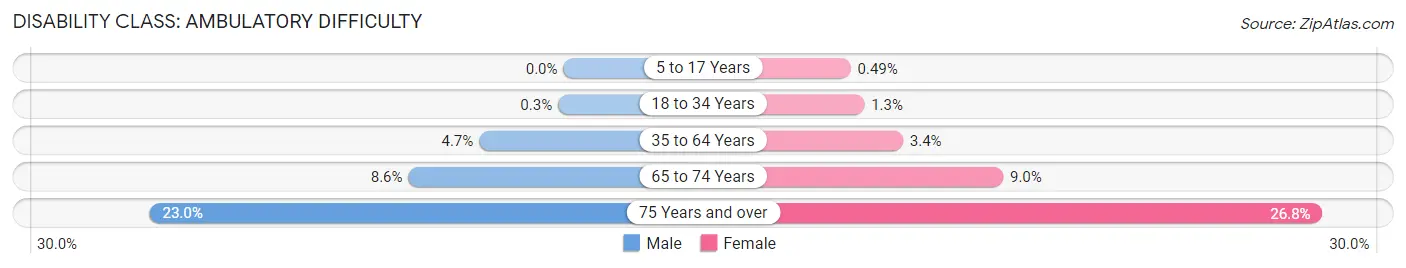
| Age Bracket | Male | Female |
| 5 to 17 Years | 0 (0.0%) | 21 (0.5%) |
| 18 to 34 Years | 19 (0.3%) | 84 (1.3%) |
| 35 to 64 Years | 843 (4.7%) | 571 (3.4%) |
| 65 to 74 Years | 524 (8.6%) | 496 (9.0%) |
| 75 Years and over | 894 (23.0%) | 982 (26.8%) |
Disability Class: Self-Care Difficulty
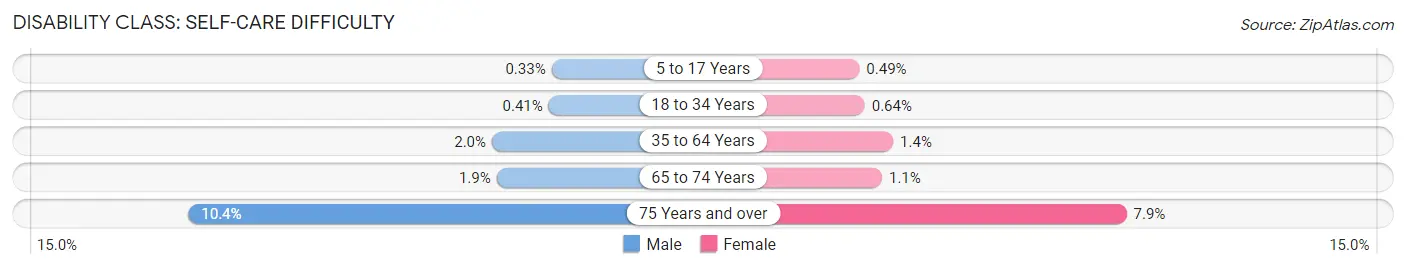
| Age Bracket | Male | Female |
| 5 to 17 Years | 16 (0.3%) | 21 (0.5%) |
| 18 to 34 Years | 26 (0.4%) | 43 (0.6%) |
| 35 to 64 Years | 358 (2.0%) | 240 (1.4%) |
| 65 to 74 Years | 113 (1.9%) | 62 (1.1%) |
| 75 Years and over | 405 (10.4%) | 291 (7.9%) |
Technology Access in Monroe County
Computing Device Access in Monroe County
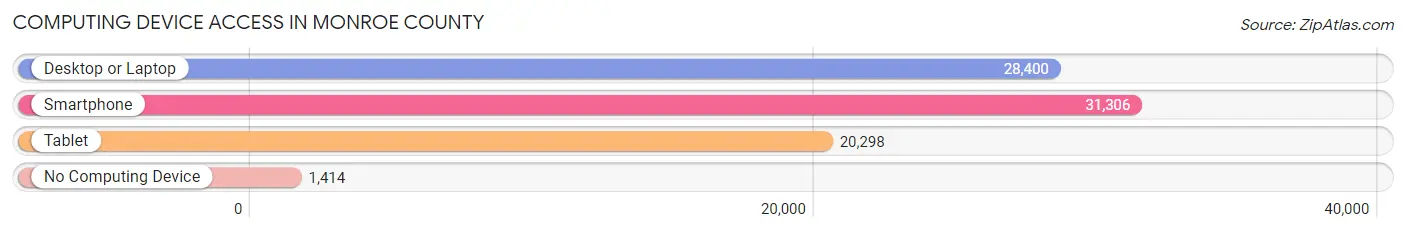
| Device Type | # Households | % Households |
| Desktop or Laptop | 28,400 | 82.6% |
| Smartphone | 31,306 | 91.0% |
| Tablet | 20,298 | 59.0% |
| No Computing Device | 1,414 | 4.1% |
| Total | 34,388 | 100.0% |
Internet Access in Monroe County
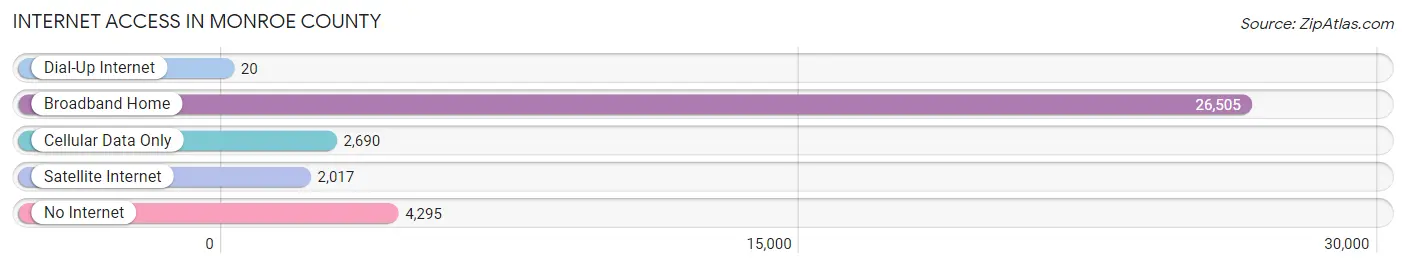
| Internet Type | # Households | % Households |
| Dial-Up Internet | 20 | 0.1% |
| Broadband Home | 26,505 | 77.1% |
| Cellular Data Only | 2,690 | 7.8% |
| Satellite Internet | 2,017 | 5.9% |
| No Internet | 4,295 | 12.5% |
| Total | 34,388 | 100.0% |
Monroe County Summary
Monroe County is located in the southernmost part of the U.S. state of Florida. It is the southernmost county in the continental United States. The county is bordered by the Atlantic Ocean to the east, the Florida Straits to the south, and the Gulf of Mexico to the west. It is part of the Florida Keys archipelago, and is the only county in the state that is entirely composed of islands. The county seat is Key West, which is also the county's largest city.
History
Monroe County was created in 1823, when it was split off from Miami-Dade County. It was named for James Monroe, the fifth President of the United States. The county was originally part of the Territory of Florida, and was later part of the State of Florida when it was admitted to the Union in 1845.
In the early 1900s, the county was a popular destination for wealthy Americans, who built large estates on the islands. The county was also home to a large fishing industry, which provided a major source of income for the local population.
In 1935, the county was devastated by a powerful hurricane, which destroyed many of the homes and businesses in the area. The county was also hit hard by the Great Depression, and many of the wealthy residents left the area.
In the 1950s, the county began to experience a resurgence, as tourism began to take off. The county was also home to a large military presence, as the U.S. Navy and Air Force had bases in the area.
Geography
Monroe County is located in the southernmost part of the state of Florida. It is bordered by the Atlantic Ocean to the east, the Florida Straits to the south, and the Gulf of Mexico to the west. The county is composed of a number of islands, including Key West, Big Pine Key, Sugarloaf Key, and Marathon Key. The county is also home to a number of smaller islands, such as Stock Island, Cudjoe Key, and Ramrod Key.
The county has a total area of 3,738 square miles, of which 2,890 square miles is land and 848 square miles is water. The county is home to a number of protected areas, including the Florida Keys National Marine Sanctuary, the Great White Heron National Wildlife Refuge, and the Key West National Wildlife Refuge.
Economy
Monroe County has a diverse economy, with a number of industries providing employment opportunities. The county is home to a large tourism industry, which is the largest source of employment in the area. The county is also home to a large fishing industry, which provides a significant source of income for the local population.
The county is also home to a number of military bases, which provide employment opportunities for local residents. The county is also home to a number of manufacturing and technology companies, which provide employment opportunities for skilled workers.
Demographics
As of the 2010 census, Monroe County had a population of 73,090. The population was spread out, with 24.3% under the age of 18, 8.2% from 18 to 24, 28.2% from 25 to 44, 24.3% from 45 to 64, and 14.0% who were 65 years of age or older. The median age was 38.4 years.
The racial makeup of the county was 79.2% White, 8.3% African American, 0.3% Native American, 1.2% Asian, 0.1% Pacific Islander, 8.3% from other races, and 2.6% from two or more races. Hispanic or Latino of any race were 24.3% of the population.
The median income for a household in the county was $50,890, and the median income for a family was $60,890. The per capita income for the county was $30,890. About 11.2% of families and 15.2% of the population were below the poverty line, including 22.2% of those under age 18 and 8.2% of those age 65 or over.
Common Questions
What is Per Capita Income in Monroe County?
Per Capita income in Monroe County is $54,630.
What is the Median Family Income in Monroe County?
Median Family Income in Monroe County is $95,165.
What is the Median Household income in Monroe County?
Median Household Income in Monroe County is $80,111.
What is Income or Wage Gap in Monroe County?
Income or Wage Gap in Monroe County is 27.6%.
Women in Monroe County earn 72.4 cents for every dollar earned by a man.
What is Family Income Deficit in Monroe County?
Family Income Deficit in Monroe County is $9,110.
Families that are below poverty line in Monroe County earn $9,110 less on average than the poverty threshold level.
What is Inequality or Gini Index in Monroe County?
Inequality or Gini Index in Monroe County is 0.52.
What is the Total Population of Monroe County?
Total Population of Monroe County is 82,044.
What is the Total Male Population of Monroe County?
Total Male Population of Monroe County is 42,677.
What is the Total Female Population of Monroe County?
Total Female Population of Monroe County is 39,367.
What is the Ratio of Males per 100 Females in Monroe County?
There are 108.41 Males per 100 Females in Monroe County.
What is the Ratio of Females per 100 Males in Monroe County?
There are 92.24 Females per 100 Males in Monroe County.
What is the Median Population Age in Monroe County?
Median Population Age in Monroe County is 48.3 Years.
What is the Average Family Size in Monroe County
Average Family Size in Monroe County is 2.8 People.
What is the Average Household Size in Monroe County
Average Household Size in Monroe County is 2.3 People.
How Large is the Labor Force in Monroe County?
There are 45,080 People in the Labor Forcein in Monroe County.
What is the Percentage of People in the Labor Force in Monroe County?
63.6% of People are in the Labor Force in Monroe County.
What is the Unemployment Rate in Monroe County?
Unemployment Rate in Monroe County is 3.4%.