Indian River County, FL Map & Demographics
Indian River County Map
Indian River County Overview
$44,102
PER CAPITA INCOME
$81,181
AVG FAMILY INCOME
$67,543
AVG HOUSEHOLD INCOME
24.6%
WAGE / INCOME GAP [ % ]
75.4¢/ $1
WAGE / INCOME GAP [ $ ]
$11,747
FAMILY INCOME DEFICIT
0.51
INEQUALITY / GINI INDEX
160,986
TOTAL POPULATION
78,378
MALE POPULATION
82,608
FEMALE POPULATION
94.88
MALES / 100 FEMALES
105.40
FEMALES / 100 MALES
54.8
MEDIAN AGE
3.0
AVG FAMILY SIZE
2.4
AVG HOUSEHOLD SIZE
67,655
LABOR FORCE [ PEOPLE ]
48.5%
PERCENT IN LABOR FORCE
5.9%
UNEMPLOYMENT RATE
Indian River County Area Codes
Income in Indian River County
Income Overview in Indian River County
Per Capita Income in Indian River County is $44,102, while median incomes of families and households are $81,181 and $67,543 respectively.
| Characteristic | Number | Measure |
| Per Capita Income | 160,986 | $44,102 |
| Median Family Income | 41,027 | $81,181 |
| Mean Family Income | 41,027 | $120,309 |
| Median Household Income | 65,735 | $67,543 |
| Mean Household Income | 65,735 | $101,260 |
| Income Deficit | 41,027 | $11,747 |
| Wage / Income Gap (%) | 160,986 | 24.56% |
| Wage / Income Gap ($) | 160,986 | 75.44¢ per $1 |
| Gini / Inequality Index | 160,986 | 0.51 |
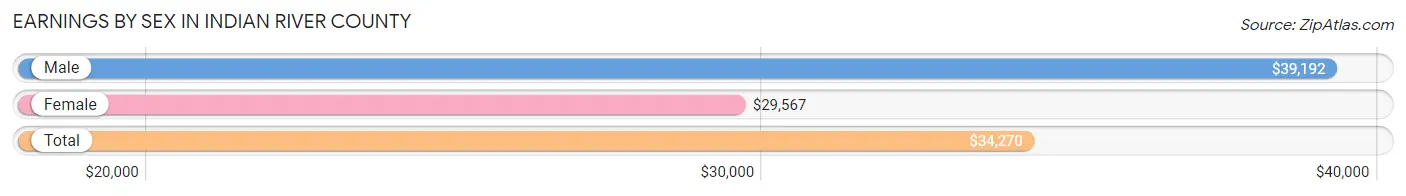
Earnings by Sex in Indian River County
Average Earnings in Indian River County are $34,270, $39,192 for men and $29,567 for women, a difference of 24.6%.
| Sex | Number | Average Earnings |
| Male | 36,968 (51.4%) | $39,192 |
| Female | 34,941 (48.6%) | $29,567 |
| Total | 71,909 (100.0%) | $34,270 |
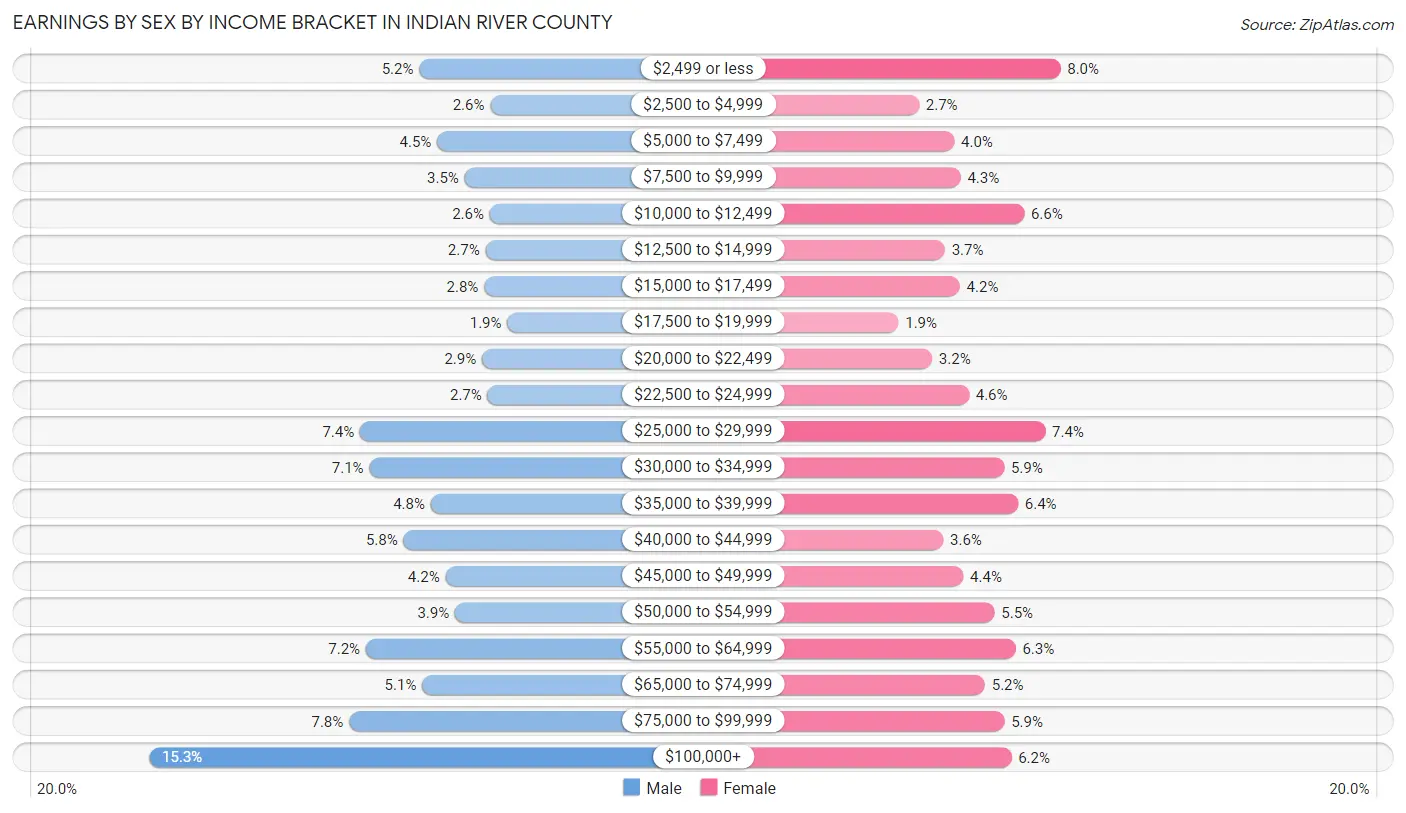
Earnings by Sex by Income Bracket in Indian River County
The most common earnings brackets in Indian River County are $100,000+ for men (5,671 | 15.3%) and $2,499 or less for women (2,794 | 8.0%).
| Income | Male | Female |
| $2,499 or less | 1,927 (5.2%) | 2,794 (8.0%) |
| $2,500 to $4,999 | 943 (2.5%) | 943 (2.7%) |
| $5,000 to $7,499 | 1,680 (4.5%) | 1,406 (4.0%) |
| $7,500 to $9,999 | 1,298 (3.5%) | 1,488 (4.3%) |
| $10,000 to $12,499 | 949 (2.6%) | 2,321 (6.6%) |
| $12,500 to $14,999 | 1,009 (2.7%) | 1,284 (3.7%) |
| $15,000 to $17,499 | 1,026 (2.8%) | 1,478 (4.2%) |
| $17,500 to $19,999 | 705 (1.9%) | 674 (1.9%) |
| $20,000 to $22,499 | 1,057 (2.9%) | 1,114 (3.2%) |
| $22,500 to $24,999 | 981 (2.6%) | 1,597 (4.6%) |
| $25,000 to $29,999 | 2,748 (7.4%) | 2,596 (7.4%) |
| $30,000 to $34,999 | 2,617 (7.1%) | 2,058 (5.9%) |
| $35,000 to $39,999 | 1,767 (4.8%) | 2,240 (6.4%) |
| $40,000 to $44,999 | 2,143 (5.8%) | 1,260 (3.6%) |
| $45,000 to $49,999 | 1,564 (4.2%) | 1,524 (4.4%) |
| $50,000 to $54,999 | 1,432 (3.9%) | 1,933 (5.5%) |
| $55,000 to $64,999 | 2,666 (7.2%) | 2,210 (6.3%) |
| $65,000 to $74,999 | 1,887 (5.1%) | 1,807 (5.2%) |
| $75,000 to $99,999 | 2,898 (7.8%) | 2,061 (5.9%) |
| $100,000+ | 5,671 (15.3%) | 2,153 (6.2%) |
| Total | 36,968 (100.0%) | 34,941 (100.0%) |
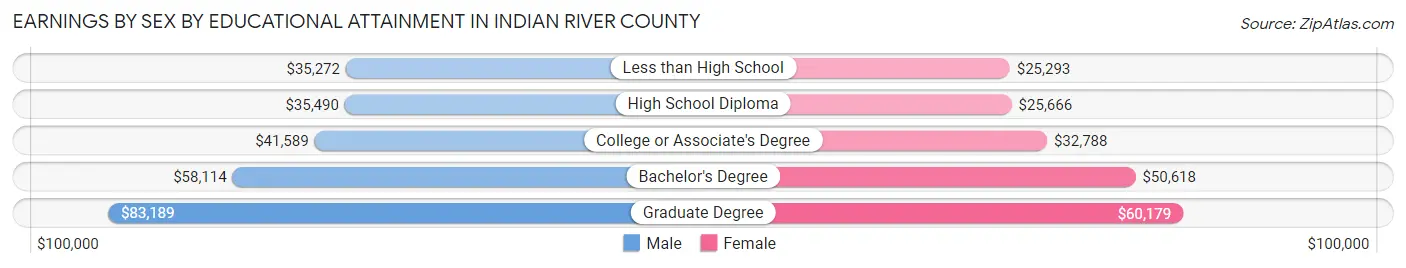
Earnings by Sex by Educational Attainment in Indian River County
Average earnings in Indian River County are $44,968 for men and $34,411 for women, a difference of 23.5%. Men with an educational attainment of graduate degree enjoy the highest average annual earnings of $83,189, while those with less than high school education earn the least with $35,272. Women with an educational attainment of graduate degree earn the most with the average annual earnings of $60,179, while those with less than high school education have the smallest earnings of $25,293.
| Educational Attainment | Male Income | Female Income |
| Less than High School | $35,272 | $25,293 |
| High School Diploma | $35,490 | $25,666 |
| College or Associate's Degree | $41,589 | $32,788 |
| Bachelor's Degree | $58,114 | $50,618 |
| Graduate Degree | $83,189 | $60,179 |
| Total | $44,968 | $34,411 |
Family Income in Indian River County
Family Income Brackets in Indian River County
According to the Indian River County family income data, there are 8,205 families falling into the $50,000 to $74,999 income range, which is the most common income bracket and makes up 20.0% of all families. Conversely, the $10,000 to $14,999 income bracket is the least frequent group with only 656 families (1.6%) belonging to this category.
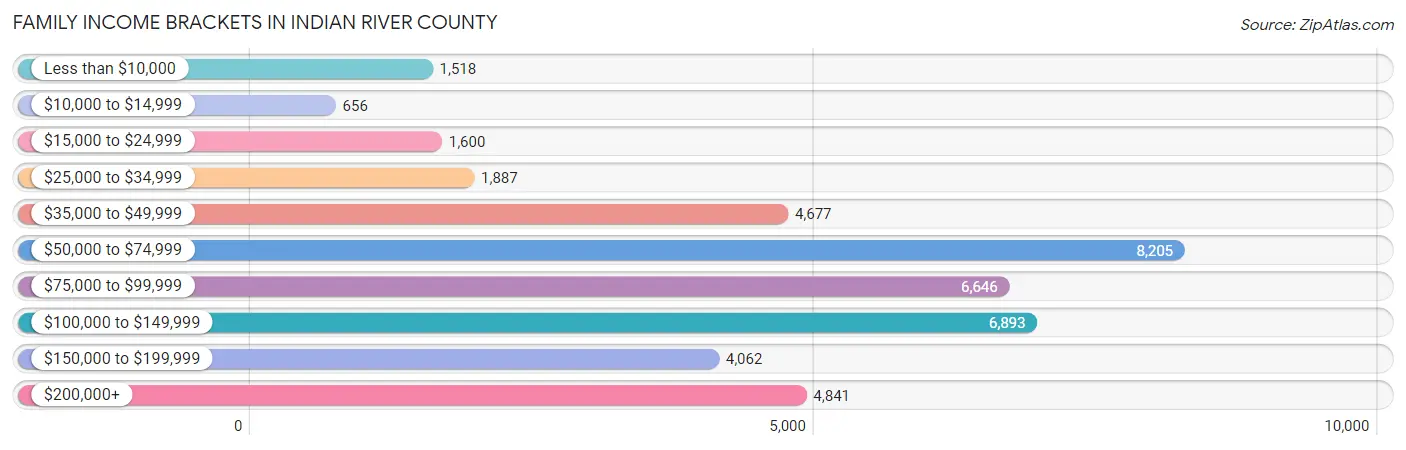
| Income Bracket | # Families | % Families |
| Less than $10,000 | 1,518 | 3.7% |
| $10,000 to $14,999 | 656 | 1.6% |
| $15,000 to $24,999 | 1,600 | 3.9% |
| $25,000 to $34,999 | 1,887 | 4.6% |
| $35,000 to $49,999 | 4,677 | 11.4% |
| $50,000 to $74,999 | 8,205 | 20.0% |
| $75,000 to $99,999 | 6,646 | 16.2% |
| $100,000 to $149,999 | 6,893 | 16.8% |
| $150,000 to $199,999 | 4,062 | 9.9% |
| $200,000+ | 4,841 | 11.8% |
Family Income by Famaliy Size in Indian River County
5-person families (1,717 | 4.2%) account for the highest median family income in Indian River County with $123,304 per family, while 2-person families (27,482 | 67.0%) have the highest median income of $39,470 per family member.
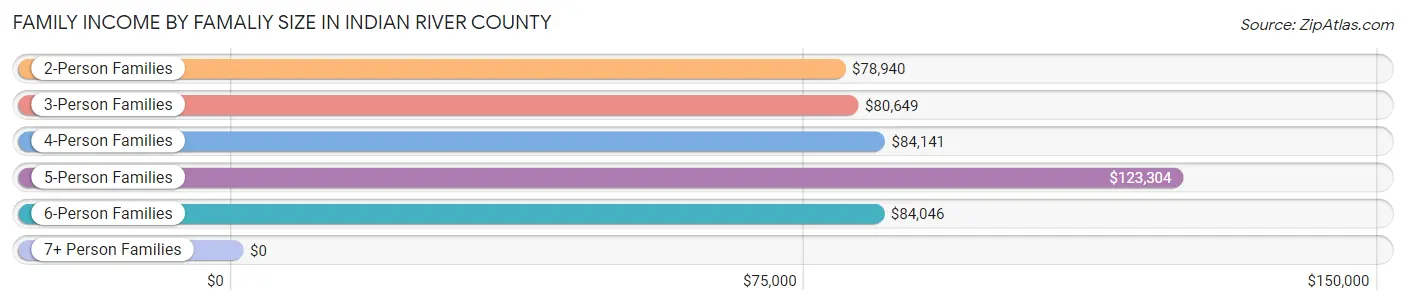
| Income Bracket | # Families | Median Income |
| 2-Person Families | 27,482 (67.0%) | $78,940 |
| 3-Person Families | 6,383 (15.6%) | $80,649 |
| 4-Person Families | 4,836 (11.8%) | $84,141 |
| 5-Person Families | 1,717 (4.2%) | $123,304 |
| 6-Person Families | 311 (0.8%) | $84,046 |
| 7+ Person Families | 298 (0.7%) | $0 |
| Total | 41,027 (100.0%) | $81,181 |
Family Income by Number of Earners in Indian River County
The median family income in Indian River County is $81,181, with families comprising 3+ earners (3,232) having the highest median family income of $104,792, while families with 1 earner (12,736) have the lowest median family income of $69,248, accounting for 7.9% and 31.0% of families, respectively.
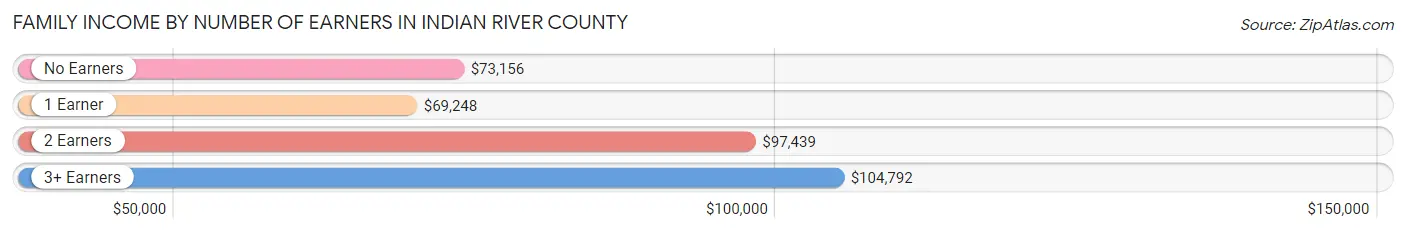
| Number of Earners | # Families | Median Income |
| No Earners | 13,340 (32.5%) | $73,156 |
| 1 Earner | 12,736 (31.0%) | $69,248 |
| 2 Earners | 11,719 (28.6%) | $97,439 |
| 3+ Earners | 3,232 (7.9%) | $104,792 |
| Total | 41,027 (100.0%) | $81,181 |
Household Income in Indian River County
Household Income Brackets in Indian River County
With 12,095 households falling in the category, the $50,000 to $74,999 income range is the most frequent in Indian River County, accounting for 18.4% of all households. In contrast, only 2,301 households (3.5%) fall into the $10,000 to $14,999 income bracket, making it the least populous group.
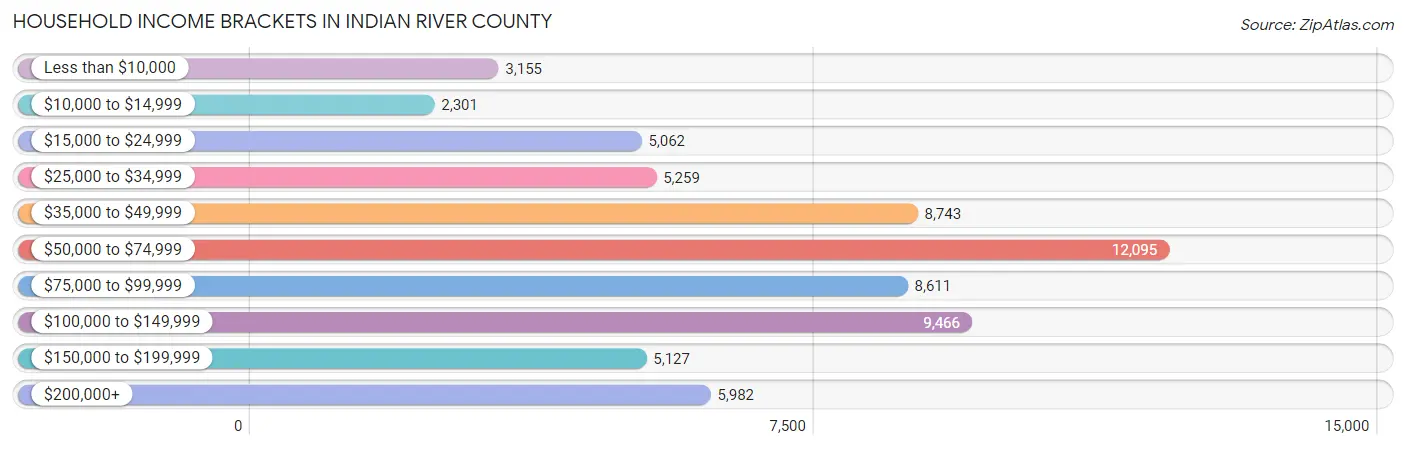
| Income Bracket | # Households | % Households |
| Less than $10,000 | 3,155 | 4.8% |
| $10,000 to $14,999 | 2,301 | 3.5% |
| $15,000 to $24,999 | 5,062 | 7.7% |
| $25,000 to $34,999 | 5,259 | 8.0% |
| $35,000 to $49,999 | 8,743 | 13.3% |
| $50,000 to $74,999 | 12,095 | 18.4% |
| $75,000 to $99,999 | 8,611 | 13.1% |
| $100,000 to $149,999 | 9,466 | 14.4% |
| $150,000 to $199,999 | 5,127 | 7.8% |
| $200,000+ | 5,982 | 9.1% |
Household Income by Householder Age in Indian River County
The median household income in Indian River County is $67,543, with the highest median household income of $72,810 found in the 45 to 64 years age bracket for the primary householder. A total of 22,514 households (34.3%) fall into this category. Meanwhile, the 15 to 24 years age bracket for the primary householder has the lowest median household income of $48,417, with 644 households (1.0%) in this group.
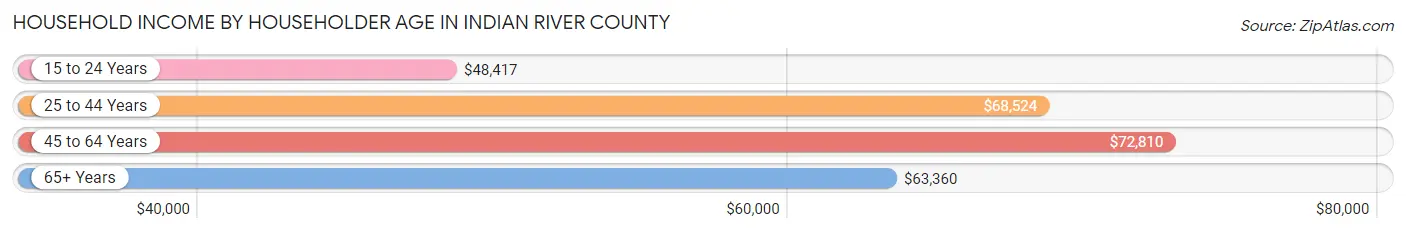
| Income Bracket | # Households | Median Income |
| 15 to 24 Years | 644 (1.0%) | $48,417 |
| 25 to 44 Years | 10,610 (16.1%) | $68,524 |
| 45 to 64 Years | 22,514 (34.3%) | $72,810 |
| 65+ Years | 31,967 (48.6%) | $63,360 |
| Total | 65,735 (100.0%) | $67,543 |
Poverty in Indian River County
Income Below Poverty by Sex and Age in Indian River County
With 11.1% poverty level for males and 11.7% for females among the residents of Indian River County, 15 year old males and 15 year old females are the most vulnerable to poverty, with 218 males (31.2%) and 214 females (29.7%) in their respective age groups living below the poverty level.
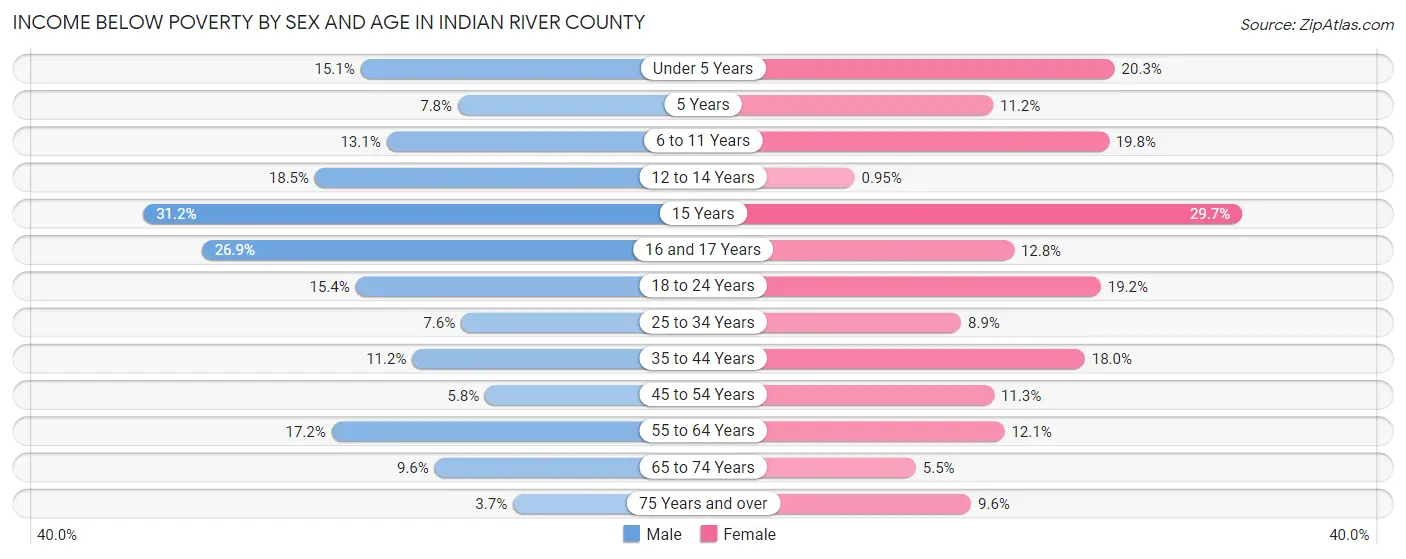
| Age Bracket | Male | Female |
| Under 5 Years | 505 (15.1%) | 575 (20.3%) |
| 5 Years | 49 (7.8%) | 82 (11.2%) |
| 6 to 11 Years | 482 (13.1%) | 839 (19.8%) |
| 12 to 14 Years | 468 (18.4%) | 17 (0.9%) |
| 15 Years | 218 (31.2%) | 214 (29.7%) |
| 16 and 17 Years | 548 (26.9%) | 141 (12.8%) |
| 18 to 24 Years | 789 (15.4%) | 983 (19.2%) |
| 25 to 34 Years | 551 (7.6%) | 566 (8.9%) |
| 35 to 44 Years | 827 (11.2%) | 1,378 (18.0%) |
| 45 to 54 Years | 471 (5.8%) | 1,005 (11.3%) |
| 55 to 64 Years | 2,008 (17.2%) | 1,639 (12.1%) |
| 65 to 74 Years | 1,261 (9.6%) | 829 (5.5%) |
| 75 Years and over | 443 (3.7%) | 1,333 (9.6%) |
| Total | 8,620 (11.1%) | 9,601 (11.7%) |
Income Above Poverty by Sex and Age in Indian River County
According to the poverty statistics in Indian River County, males aged 75 years and over and females aged 12 to 14 years are the age groups that are most secure financially, with 96.3% of males and 99.1% of females in these age groups living above the poverty line.
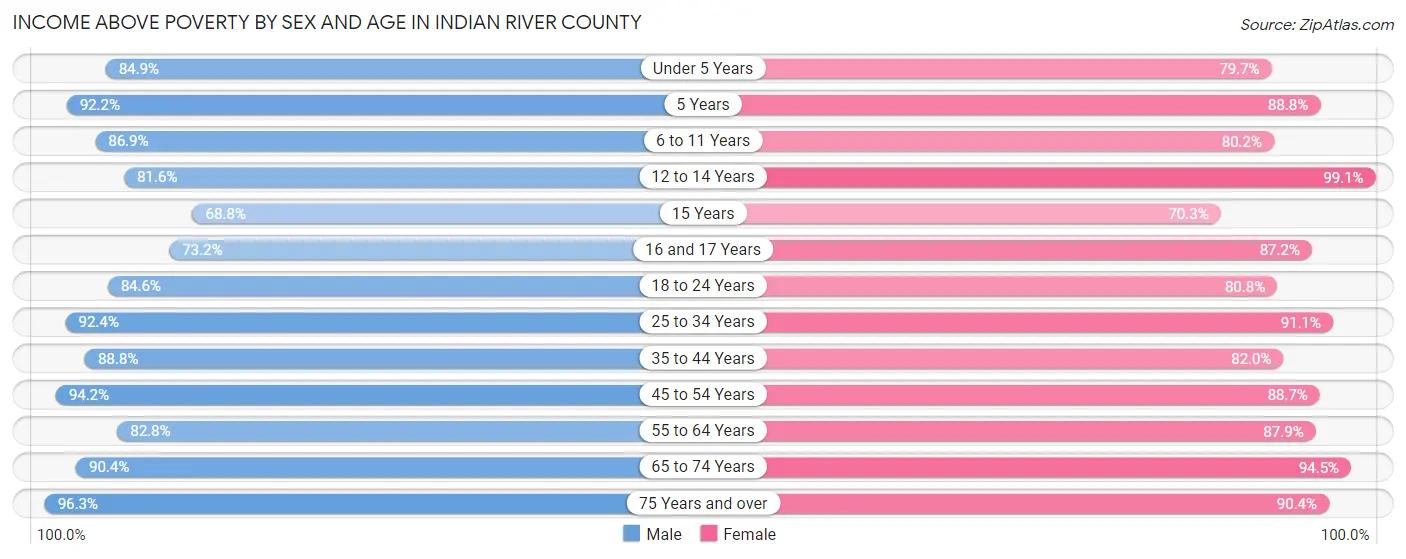
| Age Bracket | Male | Female |
| Under 5 Years | 2,849 (84.9%) | 2,263 (79.7%) |
| 5 Years | 577 (92.2%) | 648 (88.8%) |
| 6 to 11 Years | 3,188 (86.9%) | 3,394 (80.2%) |
| 12 to 14 Years | 2,068 (81.6%) | 1,773 (99.1%) |
| 15 Years | 481 (68.8%) | 506 (70.3%) |
| 16 and 17 Years | 1,493 (73.2%) | 962 (87.2%) |
| 18 to 24 Years | 4,326 (84.6%) | 4,128 (80.8%) |
| 25 to 34 Years | 6,697 (92.4%) | 5,822 (91.1%) |
| 35 to 44 Years | 6,547 (88.8%) | 6,259 (82.0%) |
| 45 to 54 Years | 7,640 (94.2%) | 7,891 (88.7%) |
| 55 to 64 Years | 9,662 (82.8%) | 11,925 (87.9%) |
| 65 to 74 Years | 11,928 (90.4%) | 14,251 (94.5%) |
| 75 Years and over | 11,387 (96.3%) | 12,550 (90.4%) |
| Total | 68,843 (88.9%) | 72,372 (88.3%) |
Income Below Poverty Among Married-Couple Families in Indian River County
The poverty statistics for married-couple families in Indian River County show that 3.5% or 1,144 of the total 33,085 families live below the poverty line. Families with no children have the highest poverty rate of 3.6%, comprising of 960 families. On the other hand, families with 5 or more children have the lowest poverty rate of 0.0%, which includes 0 families.
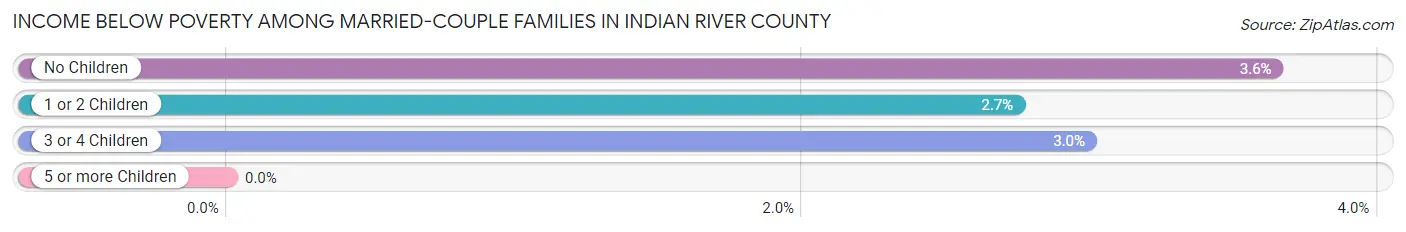
| Children | Above Poverty | Below Poverty |
| No Children | 25,413 (96.4%) | 960 (3.6%) |
| 1 or 2 Children | 5,324 (97.3%) | 150 (2.7%) |
| 3 or 4 Children | 1,103 (97.0%) | 34 (3.0%) |
| 5 or more Children | 101 (100.0%) | 0 (0.0%) |
| Total | 31,941 (96.5%) | 1,144 (3.5%) |
Income Below Poverty Among Single-Parent Households in Indian River County
According to the poverty data in Indian River County, 21.3% or 448 single-father households and 22.8% or 1,333 single-mother households are living below the poverty line. Among single-father households, those with no children have the highest poverty rate, with 274 households (27.1%) experiencing poverty. Likewise, among single-mother households, those with 3 or 4 children have the highest poverty rate, with 321 households (86.1%) falling below the poverty line.
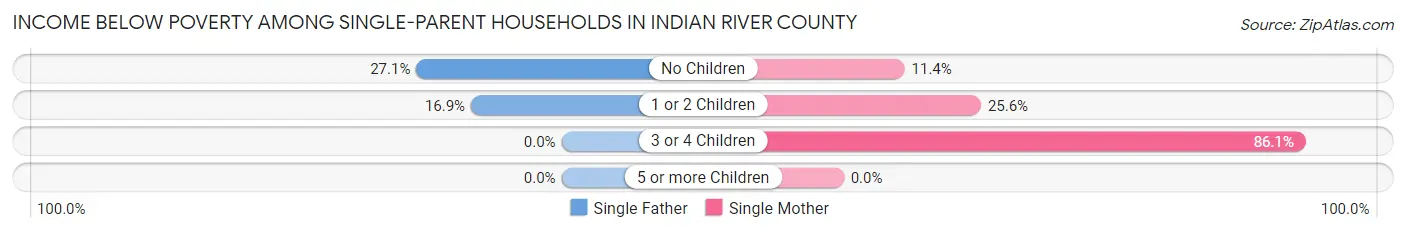
| Children | Single Father | Single Mother |
| No Children | 274 (27.1%) | 307 (11.4%) |
| 1 or 2 Children | 174 (16.9%) | 705 (25.6%) |
| 3 or 4 Children | 0 (0.0%) | 321 (86.1%) |
| 5 or more Children | 0 (0.0%) | 0 (0.0%) |
| Total | 448 (21.3%) | 1,333 (22.8%) |
Income Below Poverty Among Married-Couple vs Single-Parent Households in Indian River County
The poverty data for Indian River County shows that 1,144 of the married-couple family households (3.5%) and 1,781 of the single-parent households (22.4%) are living below the poverty level. Within the married-couple family households, those with no children have the highest poverty rate, with 960 households (3.6%) falling below the poverty line. Among the single-parent households, those with 3 or 4 children have the highest poverty rate, with 321 household (73.8%) living below poverty.
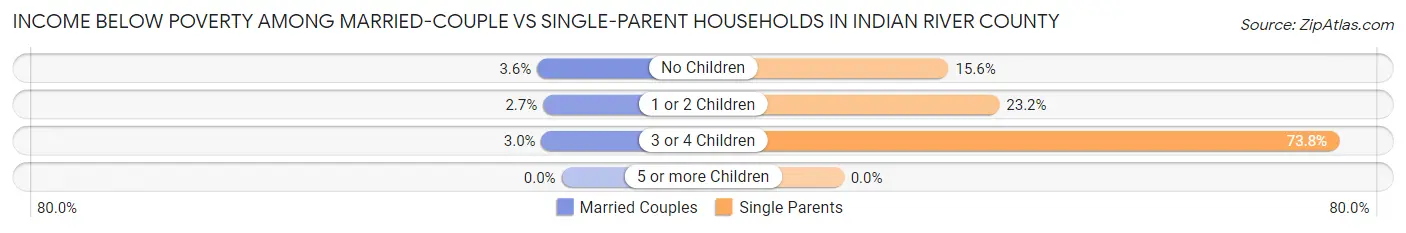
| Children | Married-Couple Families | Single-Parent Households |
| No Children | 960 (3.6%) | 581 (15.6%) |
| 1 or 2 Children | 150 (2.7%) | 879 (23.2%) |
| 3 or 4 Children | 34 (3.0%) | 321 (73.8%) |
| 5 or more Children | 0 (0.0%) | 0 (0.0%) |
| Total | 1,144 (3.5%) | 1,781 (22.4%) |
Race in Indian River County
The most populous races in Indian River County are White / Caucasian (127,687 | 79.3%), Hispanic or Latino (21,240 | 13.2%), and Black / African American (13,146 | 8.2%).
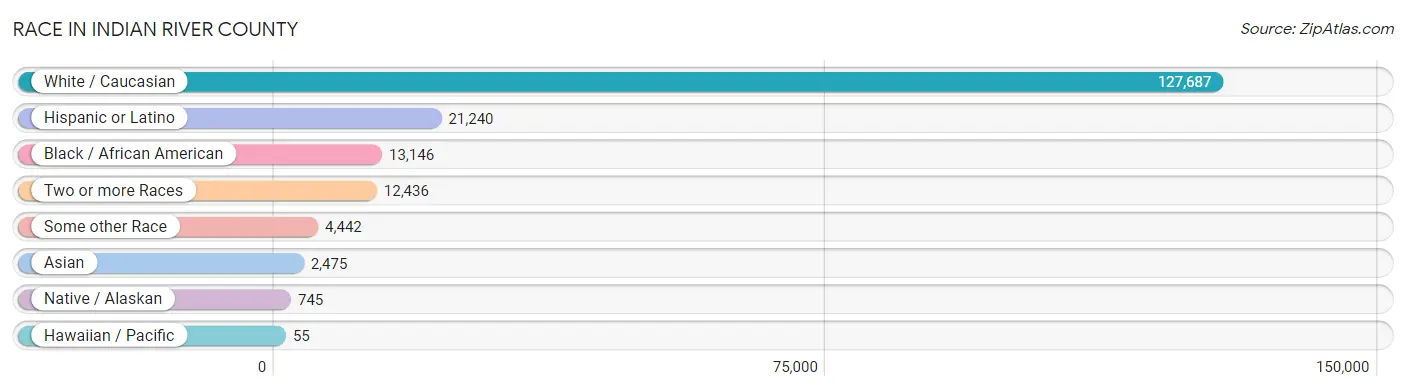
| Race | # Population | % Population |
| Asian | 2,475 | 1.5% |
| Black / African American | 13,146 | 8.2% |
| Hawaiian / Pacific | 55 | 0.0% |
| Hispanic or Latino | 21,240 | 13.2% |
| Native / Alaskan | 745 | 0.5% |
| White / Caucasian | 127,687 | 79.3% |
| Two or more Races | 12,436 | 7.7% |
| Some other Race | 4,442 | 2.8% |
| Total | 160,986 | 100.0% |
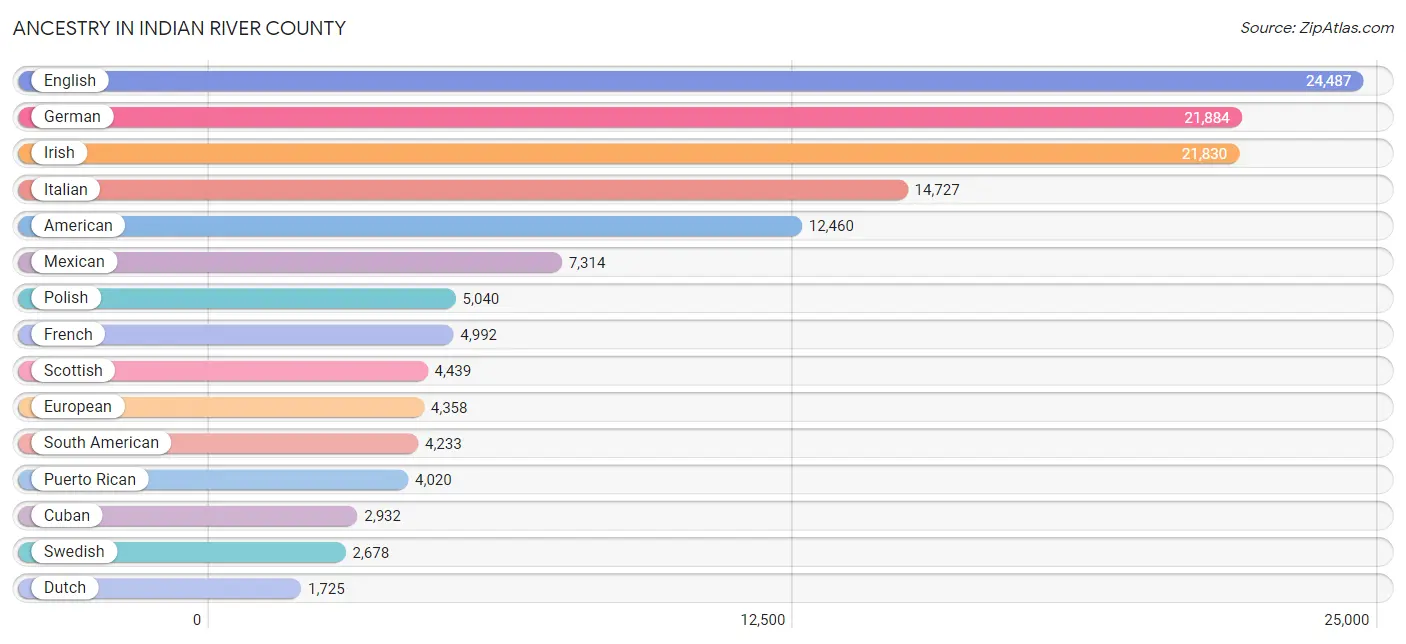
Ancestry in Indian River County
The most populous ancestries reported in Indian River County are English (24,487 | 15.2%), German (21,884 | 13.6%), Irish (21,830 | 13.6%), Italian (14,727 | 9.1%), and American (12,460 | 7.7%), together accounting for 59.3% of all Indian River County residents.
| Ancestry | # Population | % Population |
| African | 470 | 0.3% |
| Albanian | 68 | 0.0% |
| Alsatian | 8 | 0.0% |
| American | 12,460 | 7.7% |
| Apache | 49 | 0.0% |
| Arab | 462 | 0.3% |
| Argentinean | 590 | 0.4% |
| Armenian | 105 | 0.1% |
| Assyrian / Chaldean / Syriac | 20 | 0.0% |
| Australian | 72 | 0.0% |
| Austrian | 551 | 0.3% |
| Bahamian | 108 | 0.1% |
| Bangladeshi | 83 | 0.1% |
| Barbadian | 34 | 0.0% |
| Basque | 24 | 0.0% |
| Belgian | 296 | 0.2% |
| Bhutanese | 392 | 0.2% |
| Blackfeet | 18 | 0.0% |
| Bolivian | 5 | 0.0% |
| Brazilian | 547 | 0.3% |
| British | 1,350 | 0.8% |
| British West Indian | 9 | 0.0% |
| Bulgarian | 15 | 0.0% |
| Burmese | 219 | 0.1% |
| Canadian | 505 | 0.3% |
| Cape Verdean | 19 | 0.0% |
| Celtic | 56 | 0.0% |
| Central American | 1,299 | 0.8% |
| Central American Indian | 160 | 0.1% |
| Cherokee | 208 | 0.1% |
| Chilean | 101 | 0.1% |
| Chippewa | 8 | 0.0% |
| Choctaw | 5 | 0.0% |
| Colombian | 1,540 | 1.0% |
| Comanche | 25 | 0.0% |
| Costa Rican | 84 | 0.1% |
| Creek | 59 | 0.0% |
| Croatian | 90 | 0.1% |
| Cuban | 2,932 | 1.8% |
| Cypriot | 17 | 0.0% |
| Czech | 577 | 0.4% |
| Czechoslovakian | 102 | 0.1% |
| Danish | 314 | 0.2% |
| Dominican | 166 | 0.1% |
| Dutch | 1,725 | 1.1% |
| Dutch West Indian | 12 | 0.0% |
| Eastern European | 465 | 0.3% |
| Ecuadorian | 214 | 0.1% |
| Egyptian | 32 | 0.0% |
| English | 24,487 | 15.2% |
| Estonian | 71 | 0.0% |
| European | 4,358 | 2.7% |
| Finnish | 222 | 0.1% |
| French | 4,992 | 3.1% |
| French Canadian | 1,612 | 1.0% |
| German | 21,884 | 13.6% |
| Greek | 849 | 0.5% |
| Guamanian / Chamorro | 27 | 0.0% |
| Guatemalan | 250 | 0.2% |
| Guyanese | 91 | 0.1% |
| Haitian | 831 | 0.5% |
| Honduran | 368 | 0.2% |
| Hungarian | 743 | 0.5% |
| Icelander | 25 | 0.0% |
| Indian (Asian) | 506 | 0.3% |
| Indonesian | 92 | 0.1% |
| Iranian | 35 | 0.0% |
| Irish | 21,830 | 13.6% |
| Iroquois | 89 | 0.1% |
| Israeli | 98 | 0.1% |
| Italian | 14,727 | 9.1% |
| Jamaican | 577 | 0.4% |
| Japanese | 24 | 0.0% |
| Jordanian | 19 | 0.0% |
| Korean | 683 | 0.4% |
| Latvian | 12 | 0.0% |
| Lebanese | 257 | 0.2% |
| Lithuanian | 442 | 0.3% |
| Luxembourger | 30 | 0.0% |
| Maltese | 24 | 0.0% |
| Mexican | 7,314 | 4.5% |
| Mexican American Indian | 280 | 0.2% |
| Native Hawaiian | 38 | 0.0% |
| New Zealander | 12 | 0.0% |
| Nicaraguan | 263 | 0.2% |
| Nigerian | 53 | 0.0% |
| Northern European | 300 | 0.2% |
| Norwegian | 1,653 | 1.0% |
| Pakistani | 134 | 0.1% |
| Panamanian | 170 | 0.1% |
| Pennsylvania German | 74 | 0.1% |
| Peruvian | 464 | 0.3% |
| Polish | 5,040 | 3.1% |
| Portuguese | 585 | 0.4% |
| Potawatomi | 161 | 0.1% |
| Puerto Rican | 4,020 | 2.5% |
| Romanian | 244 | 0.2% |
| Russian | 1,578 | 1.0% |
| Salvadoran | 164 | 0.1% |
| Scandinavian | 457 | 0.3% |
| Scotch-Irish | 1,605 | 1.0% |
| Scottish | 4,439 | 2.8% |
| Seminole | 141 | 0.1% |
| Serbian | 81 | 0.1% |
| Sioux | 10 | 0.0% |
| Slavic | 167 | 0.1% |
| Slovak | 219 | 0.1% |
| Slovene | 29 | 0.0% |
| South African | 171 | 0.1% |
| South American | 4,233 | 2.6% |
| South American Indian | 10 | 0.0% |
| Spaniard | 342 | 0.2% |
| Spanish | 475 | 0.3% |
| Sri Lankan | 720 | 0.4% |
| Subsaharan African | 713 | 0.4% |
| Swedish | 2,678 | 1.7% |
| Swiss | 634 | 0.4% |
| Syrian | 87 | 0.1% |
| Thai | 535 | 0.3% |
| Trinidadian and Tobagonian | 420 | 0.3% |
| Turkish | 33 | 0.0% |
| U.S. Virgin Islander | 6 | 0.0% |
| Ukrainian | 446 | 0.3% |
| Uruguayan | 64 | 0.0% |
| Venezuelan | 1,126 | 0.7% |
| Welsh | 971 | 0.6% |
| West Indian | 34 | 0.0% |
| Yugoslavian | 26 | 0.0% | View All 128 Rows |
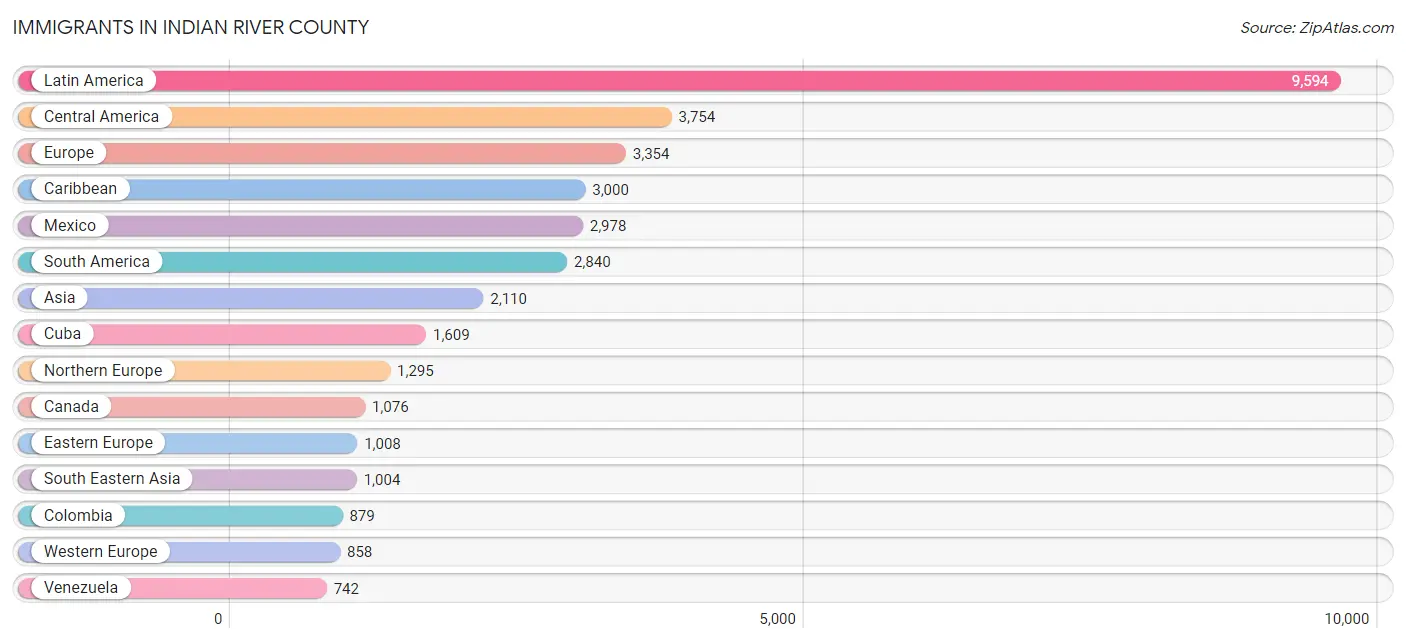
Immigrants in Indian River County
The most numerous immigrant groups reported in Indian River County came from Latin America (9,594 | 6.0%), Central America (3,754 | 2.3%), Europe (3,354 | 2.1%), Caribbean (3,000 | 1.9%), and Mexico (2,978 | 1.8%), together accounting for 14.1% of all Indian River County residents.
| Immigration Origin | # Population | % Population |
| Africa | 301 | 0.2% |
| Argentina | 113 | 0.1% |
| Asia | 2,110 | 1.3% |
| Australia | 39 | 0.0% |
| Austria | 82 | 0.1% |
| Bahamas | 51 | 0.0% |
| Belarus | 22 | 0.0% |
| Belgium | 15 | 0.0% |
| Brazil | 508 | 0.3% |
| Cambodia | 24 | 0.0% |
| Canada | 1,076 | 0.7% |
| Caribbean | 3,000 | 1.9% |
| Central America | 3,754 | 2.3% |
| Chile | 68 | 0.0% |
| China | 240 | 0.2% |
| Colombia | 879 | 0.5% |
| Costa Rica | 5 | 0.0% |
| Cuba | 1,609 | 1.0% |
| Czechoslovakia | 37 | 0.0% |
| Denmark | 22 | 0.0% |
| Dominican Republic | 87 | 0.1% |
| Eastern Africa | 37 | 0.0% |
| Eastern Asia | 426 | 0.3% |
| Eastern Europe | 1,008 | 0.6% |
| Ecuador | 187 | 0.1% |
| Egypt | 11 | 0.0% |
| El Salvador | 175 | 0.1% |
| England | 375 | 0.2% |
| Ethiopia | 8 | 0.0% |
| Europe | 3,354 | 2.1% |
| France | 110 | 0.1% |
| Germany | 494 | 0.3% |
| Greece | 52 | 0.0% |
| Grenada | 3 | 0.0% |
| Guatemala | 150 | 0.1% |
| Guyana | 43 | 0.0% |
| Haiti | 617 | 0.4% |
| Honduras | 275 | 0.2% |
| Hong Kong | 53 | 0.0% |
| Hungary | 111 | 0.1% |
| India | 204 | 0.1% |
| Indonesia | 54 | 0.0% |
| Iran | 64 | 0.0% |
| Iraq | 41 | 0.0% |
| Ireland | 145 | 0.1% |
| Israel | 51 | 0.0% |
| Italy | 124 | 0.1% |
| Jamaica | 557 | 0.4% |
| Japan | 152 | 0.1% |
| Jordan | 19 | 0.0% |
| Korea | 34 | 0.0% |
| Latin America | 9,594 | 6.0% |
| Lebanon | 108 | 0.1% |
| Lithuania | 66 | 0.0% |
| Mexico | 2,978 | 1.8% |
| Netherlands | 101 | 0.1% |
| Nicaragua | 143 | 0.1% |
| Nigeria | 19 | 0.0% |
| Northern Africa | 29 | 0.0% |
| Northern Europe | 1,295 | 0.8% |
| Norway | 13 | 0.0% |
| Oceania | 39 | 0.0% |
| Pakistan | 18 | 0.0% |
| Panama | 28 | 0.0% |
| Peru | 300 | 0.2% |
| Philippines | 261 | 0.2% |
| Poland | 362 | 0.2% |
| Romania | 101 | 0.1% |
| Russia | 108 | 0.1% |
| Saudi Arabia | 26 | 0.0% |
| Scotland | 188 | 0.1% |
| Senegal | 50 | 0.0% |
| South Africa | 166 | 0.1% |
| South America | 2,840 | 1.8% |
| South Central Asia | 435 | 0.3% |
| South Eastern Asia | 1,004 | 0.6% |
| Southern Europe | 193 | 0.1% |
| Spain | 17 | 0.0% |
| St. Vincent and the Grenadines | 50 | 0.0% |
| Sweden | 79 | 0.1% |
| Switzerland | 56 | 0.0% |
| Taiwan | 30 | 0.0% |
| Thailand | 188 | 0.1% |
| Trinidad and Tobago | 20 | 0.0% |
| Ukraine | 95 | 0.1% |
| Uzbekistan | 131 | 0.1% |
| Venezuela | 742 | 0.5% |
| Vietnam | 385 | 0.2% |
| Western Africa | 69 | 0.0% |
| Western Asia | 245 | 0.2% |
| Western Europe | 858 | 0.5% |
| Zimbabwe | 29 | 0.0% | View All 92 Rows |
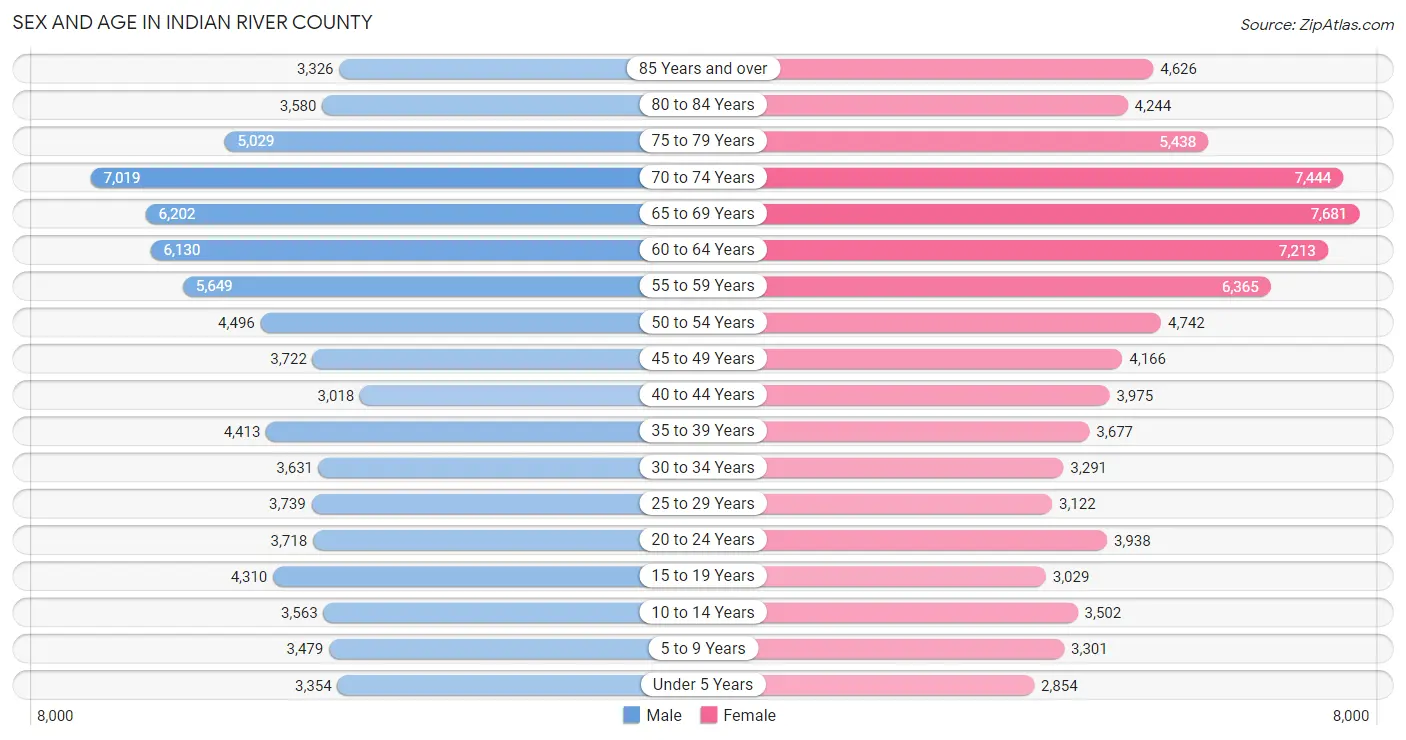
Sex and Age in Indian River County
Sex and Age in Indian River County
The most populous age groups in Indian River County are 70 to 74 Years (7,019 | 9.0%) for men and 65 to 69 Years (7,681 | 9.3%) for women.
| Age Bracket | Male | Female |
| Under 5 Years | 3,354 (4.3%) | 2,854 (3.5%) |
| 5 to 9 Years | 3,479 (4.4%) | 3,301 (4.0%) |
| 10 to 14 Years | 3,563 (4.5%) | 3,502 (4.2%) |
| 15 to 19 Years | 4,310 (5.5%) | 3,029 (3.7%) |
| 20 to 24 Years | 3,718 (4.7%) | 3,938 (4.8%) |
| 25 to 29 Years | 3,739 (4.8%) | 3,122 (3.8%) |
| 30 to 34 Years | 3,631 (4.6%) | 3,291 (4.0%) |
| 35 to 39 Years | 4,413 (5.6%) | 3,677 (4.4%) |
| 40 to 44 Years | 3,018 (3.8%) | 3,975 (4.8%) |
| 45 to 49 Years | 3,722 (4.8%) | 4,166 (5.0%) |
| 50 to 54 Years | 4,496 (5.7%) | 4,742 (5.7%) |
| 55 to 59 Years | 5,649 (7.2%) | 6,365 (7.7%) |
| 60 to 64 Years | 6,130 (7.8%) | 7,213 (8.7%) |
| 65 to 69 Years | 6,202 (7.9%) | 7,681 (9.3%) |
| 70 to 74 Years | 7,019 (9.0%) | 7,444 (9.0%) |
| 75 to 79 Years | 5,029 (6.4%) | 5,438 (6.6%) |
| 80 to 84 Years | 3,580 (4.6%) | 4,244 (5.1%) |
| 85 Years and over | 3,326 (4.2%) | 4,626 (5.6%) |
| Total | 78,378 (100.0%) | 82,608 (100.0%) |
Families and Households in Indian River County
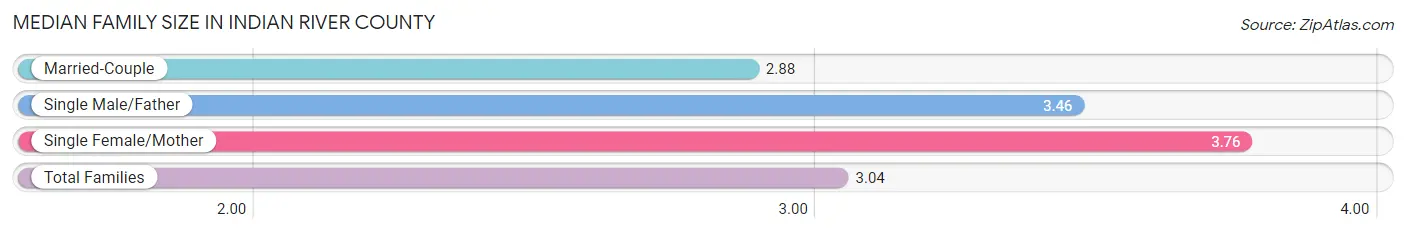
Median Family Size in Indian River County
The median family size in Indian River County is 3.04 persons per family, with single female/mother families (5,835 | 14.2%) accounting for the largest median family size of 3.76 persons per family. On the other hand, married-couple families (33,085 | 80.6%) represent the smallest median family size with 2.88 persons per family.
| Family Type | # Families | Family Size |
| Married-Couple | 33,085 (80.6%) | 2.88 |
| Single Male/Father | 2,107 (5.1%) | 3.46 |
| Single Female/Mother | 5,835 (14.2%) | 3.76 |
| Total Families | 41,027 (100.0%) | 3.04 |
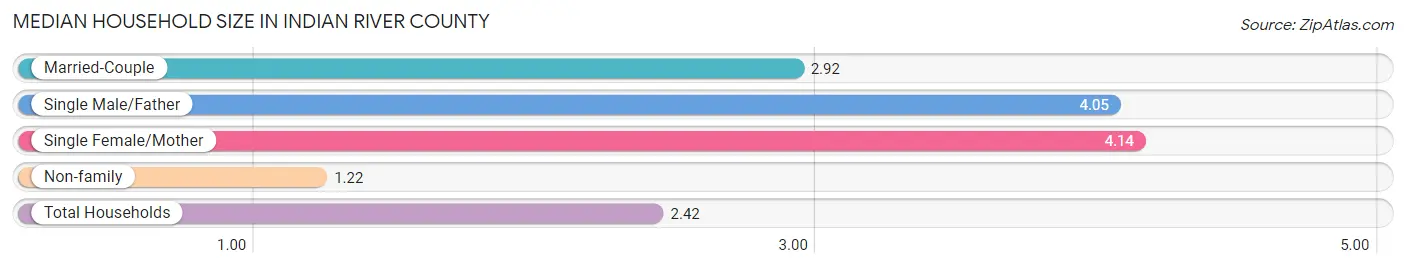
Median Household Size in Indian River County
The median household size in Indian River County is 2.42 persons per household, with single female/mother households (5,835 | 8.9%) accounting for the largest median household size of 4.14 persons per household. non-family households (24,708 | 37.6%) represent the smallest median household size with 1.22 persons per household.
| Household Type | # Households | Household Size |
| Married-Couple | 33,085 (50.3%) | 2.92 |
| Single Male/Father | 2,107 (3.2%) | 4.05 |
| Single Female/Mother | 5,835 (8.9%) | 4.14 |
| Non-family | 24,708 (37.6%) | 1.22 |
| Total Households | 65,735 (100.0%) | 2.42 |
Household Size by Marriage Status in Indian River County
Out of a total of 65,735 households in Indian River County, 41,027 (62.4%) are family households, while 24,708 (37.6%) are nonfamily households. The most numerous type of family households are 2-person households, comprising 26,104, and the most common type of nonfamily households are 1-person households, comprising 21,409.
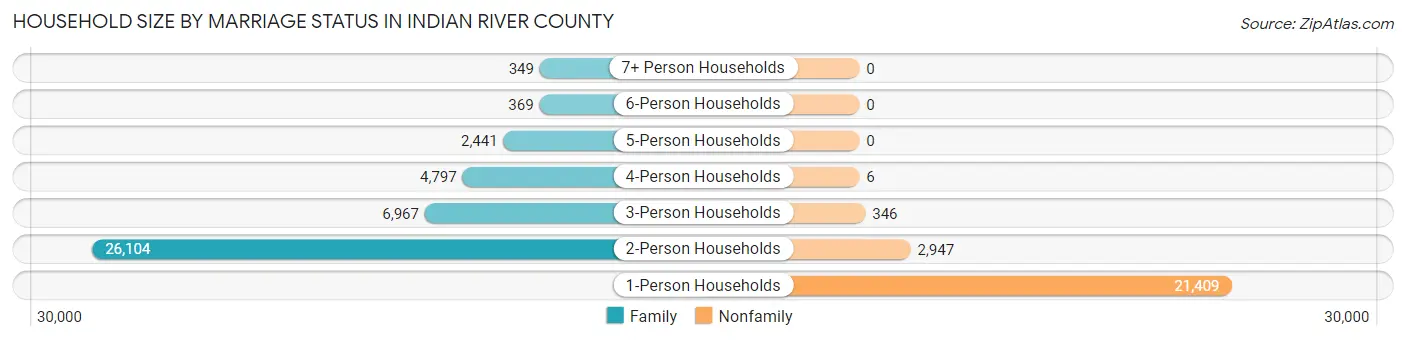
| Household Size | Family Households | Nonfamily Households |
| 1-Person Households | - | 21,409 (32.6%) |
| 2-Person Households | 26,104 (39.7%) | 2,947 (4.5%) |
| 3-Person Households | 6,967 (10.6%) | 346 (0.5%) |
| 4-Person Households | 4,797 (7.3%) | 6 (0.0%) |
| 5-Person Households | 2,441 (3.7%) | 0 (0.0%) |
| 6-Person Households | 369 (0.6%) | 0 (0.0%) |
| 7+ Person Households | 349 (0.5%) | 0 (0.0%) |
| Total | 41,027 (62.4%) | 24,708 (37.6%) |
Female Fertility in Indian River County
Fertility by Age in Indian River County
Average fertility rate in Indian River County is 37.0 births per 1,000 women. Women in the age bracket of 20 to 34 years have the highest fertility rate with 48.0 births per 1,000 women. Women in the age bracket of 20 to 34 years acount for 52.2% of all women with births.
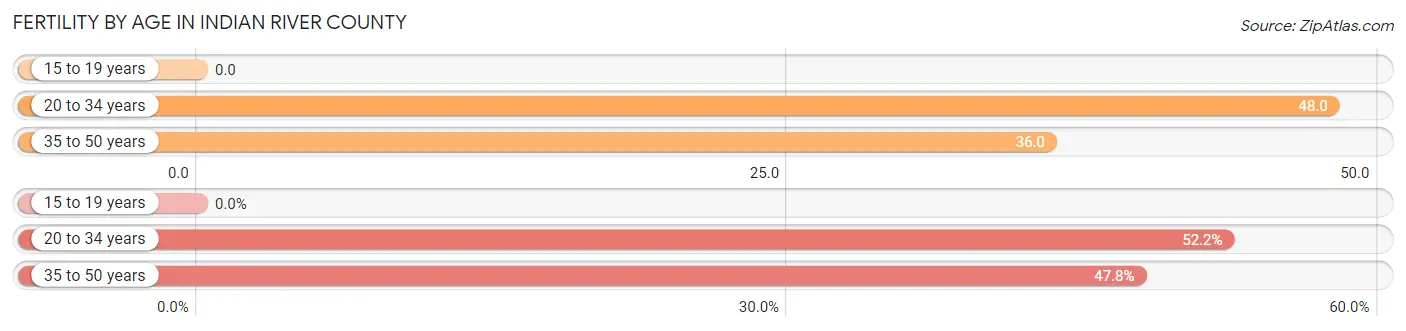
| Age Bracket | Women with Births | Births / 1,000 Women |
| 15 to 19 years | 0 (0.0%) | 0.0 |
| 20 to 34 years | 502 (52.2%) | 48.0 |
| 35 to 50 years | 459 (47.8%) | 36.0 |
| Total | 961 (100.0%) | 37.0 |
Fertility by Age by Marriage Status in Indian River County
60.7% of women with births (961) in Indian River County are married. The highest percentage of unmarried women with births falls into 35 to 50 years age bracket with 56.9% of them unmarried at the time of birth, while the lowest percentage of unmarried women with births belong to 20 to 34 years age bracket with 23.3% of them unmarried.
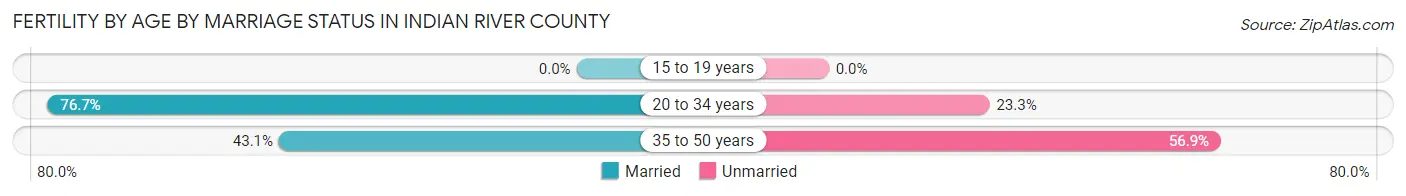
| Age Bracket | Married | Unmarried |
| 15 to 19 years | 0 (0.0%) | 0 (0.0%) |
| 20 to 34 years | 385 (76.7%) | 117 (23.3%) |
| 35 to 50 years | 198 (43.1%) | 261 (56.9%) |
| Total | 583 (60.7%) | 378 (39.3%) |
Fertility by Education in Indian River County
Average fertility rate in Indian River County is 37.0 births per 1,000 women. Women with the education attainment of college or associate's degree have the highest fertility rate of 54.0 births per 1,000 women, while women with the education attainment of less than high school have the lowest fertility at 8.0 births per 1,000 women. Women with the education attainment of college or associate's degree represent 54.2% of all women with births.
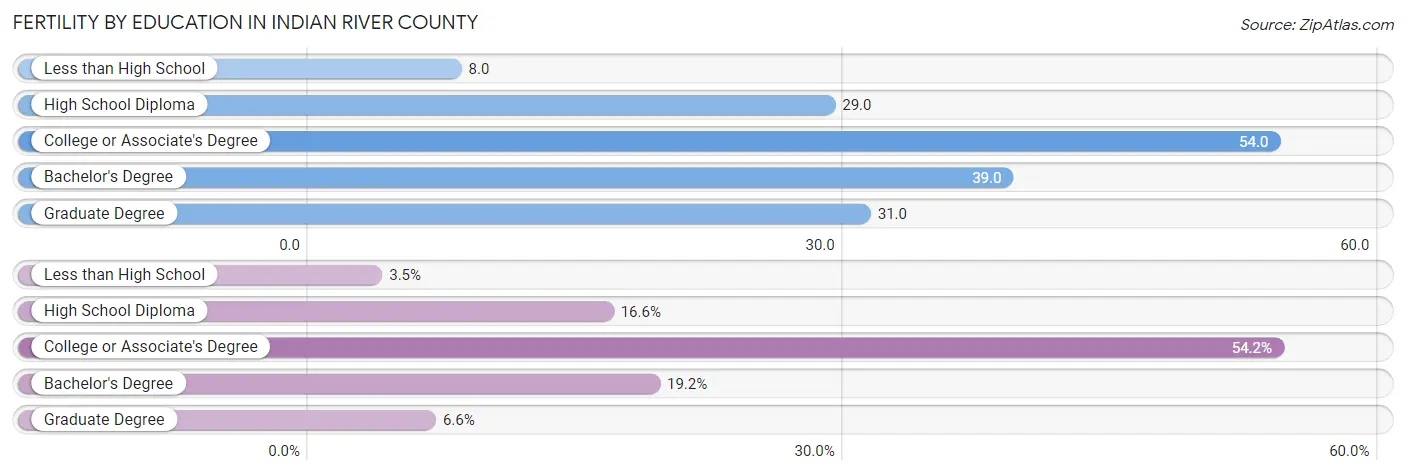
| Educational Attainment | Women with Births | Births / 1,000 Women |
| Less than High School | 34 (3.5%) | 8.0 |
| High School Diploma | 159 (16.6%) | 29.0 |
| College or Associate's Degree | 521 (54.2%) | 54.0 |
| Bachelor's Degree | 184 (19.2%) | 39.0 |
| Graduate Degree | 63 (6.6%) | 31.0 |
| Total | 961 (100.0%) | 37.0 |
Fertility by Education by Marriage Status in Indian River County
39.3% of women with births in Indian River County are unmarried. Women with the educational attainment of graduate degree are most likely to be married with 100.0% of them married at childbirth, while women with the educational attainment of less than high school are least likely to be married with 100.0% of them unmarried at childbirth.
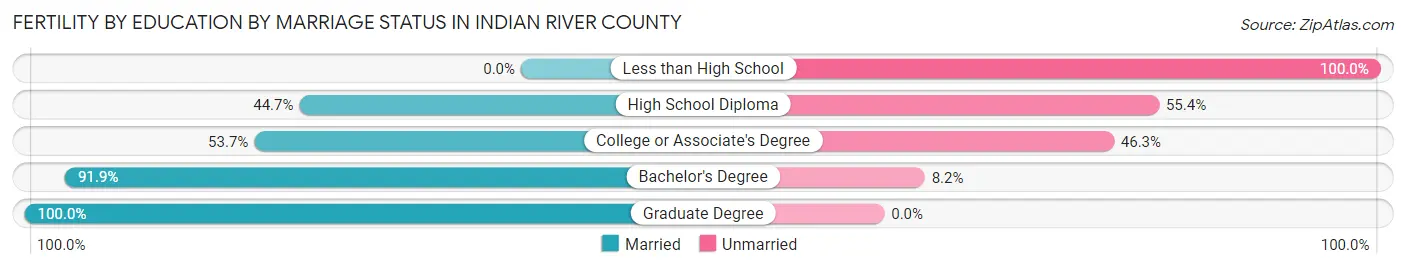
| Educational Attainment | Married | Unmarried |
| Less than High School | 0 (0.0%) | 34 (100.0%) |
| High School Diploma | 71 (44.7%) | 88 (55.3%) |
| College or Associate's Degree | 280 (53.7%) | 241 (46.3%) |
| Bachelor's Degree | 169 (91.8%) | 15 (8.2%) |
| Graduate Degree | 63 (100.0%) | 0 (0.0%) |
| Total | 583 (60.7%) | 378 (39.3%) |
Employment Characteristics in Indian River County
Employment by Class of Employer in Indian River County
Among the 62,037 employed individuals in Indian River County, private company employees (41,905 | 67.5%), not-for-profit organizations (4,690 | 7.6%), and self-employed (incorporated) (4,689 | 7.6%) make up the most common classes of employment.
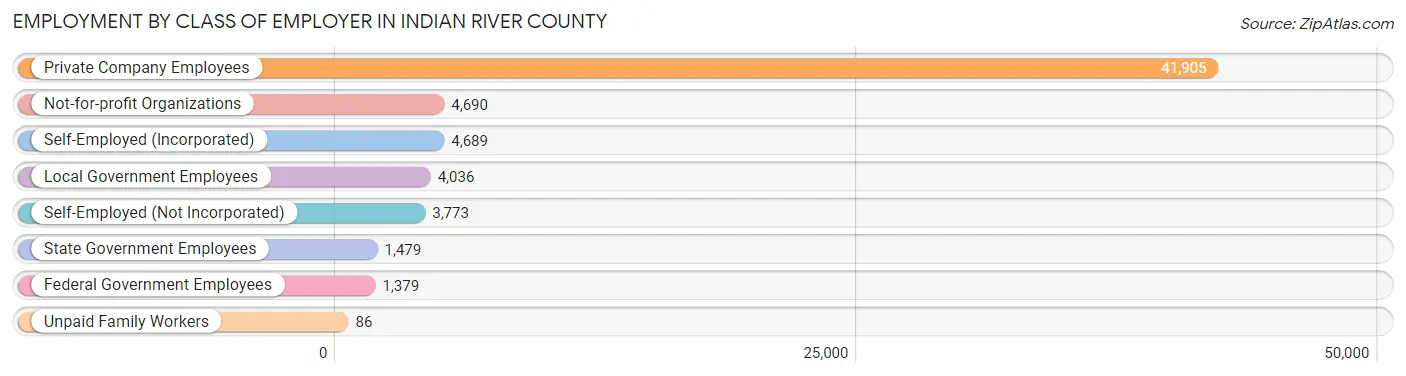
| Employer Class | # Employees | % Employees |
| Private Company Employees | 41,905 | 67.5% |
| Self-Employed (Incorporated) | 4,689 | 7.6% |
| Self-Employed (Not Incorporated) | 3,773 | 6.1% |
| Not-for-profit Organizations | 4,690 | 7.6% |
| Local Government Employees | 4,036 | 6.5% |
| State Government Employees | 1,479 | 2.4% |
| Federal Government Employees | 1,379 | 2.2% |
| Unpaid Family Workers | 86 | 0.1% |
| Total | 62,037 | 100.0% |
Employment Status by Age in Indian River County
According to the labor force statistics for Indian River County, out of the total population over 16 years of age (139,495), 48.5% or 67,655 individuals are in the labor force, with 5.9% or 3,992 of them unemployed. The age group with the highest labor force participation rate is 30 to 34 years, with 87.3% or 6,043 individuals in the labor force. Within the labor force, the 20 to 24 years age range has the highest percentage of unemployed individuals, with 12.8% or 804 of them being unemployed.
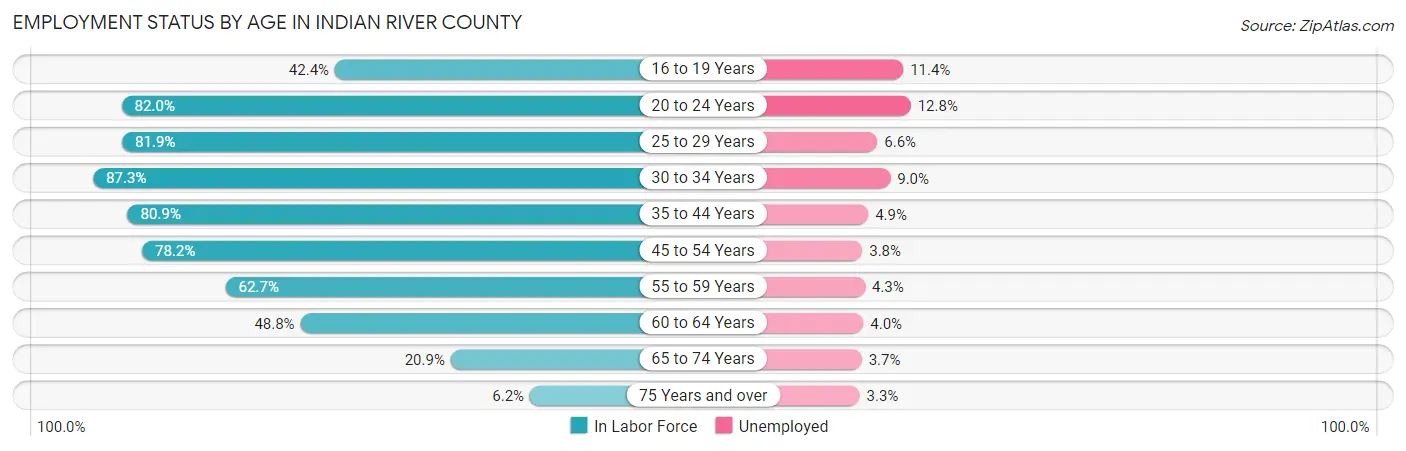
| Age Bracket | In Labor Force | Unemployed |
| 16 to 19 Years | 2,502 (42.4%) | 285 (11.4%) |
| 20 to 24 Years | 6,278 (82.0%) | 804 (12.8%) |
| 25 to 29 Years | 5,619 (81.9%) | 371 (6.6%) |
| 30 to 34 Years | 6,043 (87.3%) | 544 (9.0%) |
| 35 to 44 Years | 12,202 (80.9%) | 598 (4.9%) |
| 45 to 54 Years | 13,393 (78.2%) | 509 (3.8%) |
| 55 to 59 Years | 7,533 (62.7%) | 324 (4.3%) |
| 60 to 64 Years | 6,511 (48.8%) | 260 (4.0%) |
| 65 to 74 Years | 5,924 (20.9%) | 219 (3.7%) |
| 75 Years and over | 1,627 (6.2%) | 54 (3.3%) |
| Total | 67,655 (48.5%) | 3,992 (5.9%) |
Employment Status by Educational Attainment in Indian River County
According to labor force statistics for Indian River County, 71.9% of individuals (51,300) out of the total population between 25 and 64 years of age (71,349) are in the labor force, with 5.1% or 2,616 of them being unemployed. The group with the highest labor force participation rate are those with the educational attainment of bachelor's degree or higher, with 77.8% or 16,697 individuals in the labor force. Within the labor force, individuals with less than high school education have the highest percentage of unemployment, with 8.6% or 371 of them being unemployed.
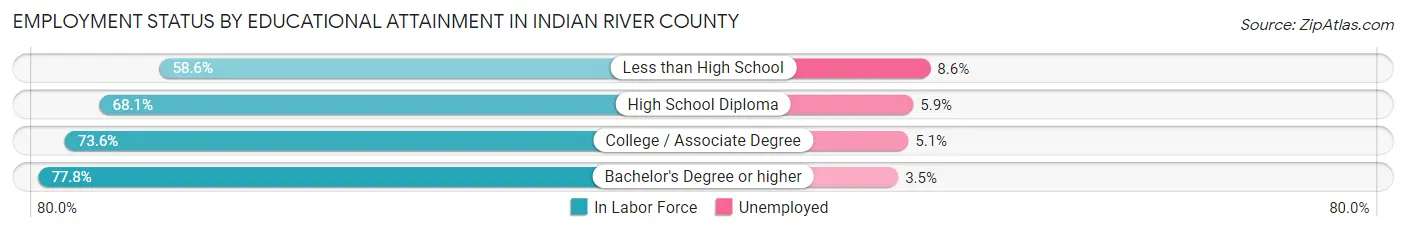
| Educational Attainment | In Labor Force | Unemployed |
| Less than High School | 4,310 (58.6%) | 633 (8.6%) |
| High School Diploma | 12,482 (68.1%) | 1,081 (5.9%) |
| College / Associate Degree | 17,814 (73.6%) | 1,234 (5.1%) |
| Bachelor's Degree or higher | 16,697 (77.8%) | 751 (3.5%) |
| Total | 51,300 (71.9%) | 3,639 (5.1%) |
Employment Occupations by Sex in Indian River County
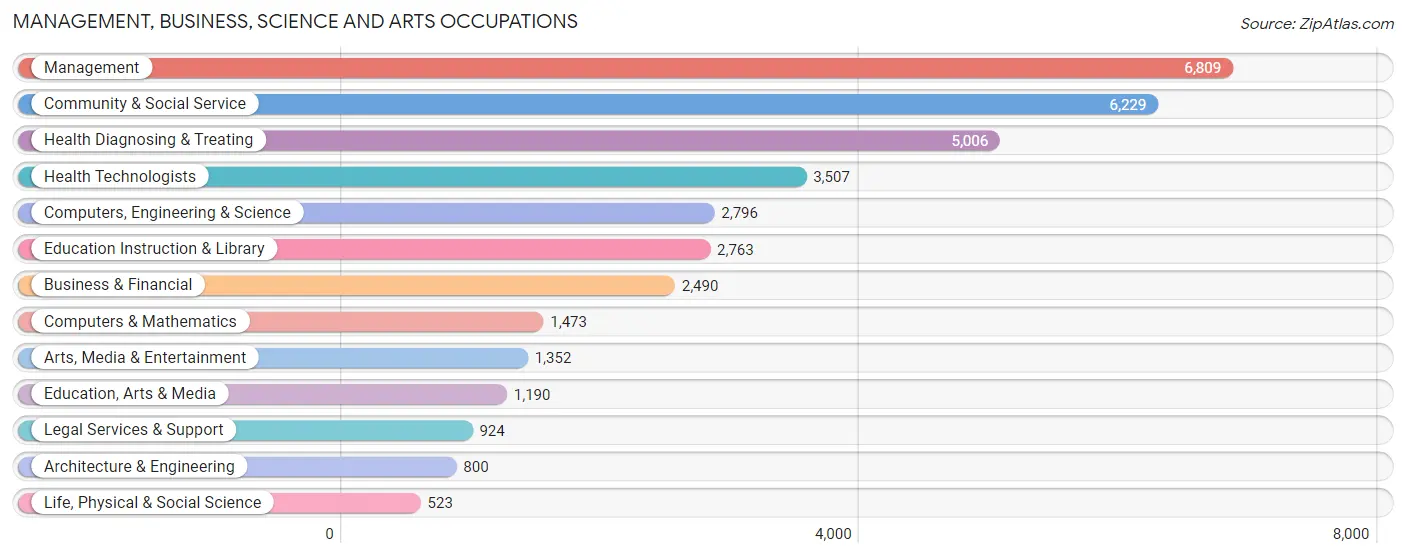
Management, Business, Science and Arts Occupations
The most common Management, Business, Science and Arts occupations in Indian River County are Management (6,809 | 10.8%), Community & Social Service (6,229 | 9.9%), Health Diagnosing & Treating (5,006 | 7.9%), Health Technologists (3,507 | 5.6%), and Computers, Engineering & Science (2,796 | 4.4%).
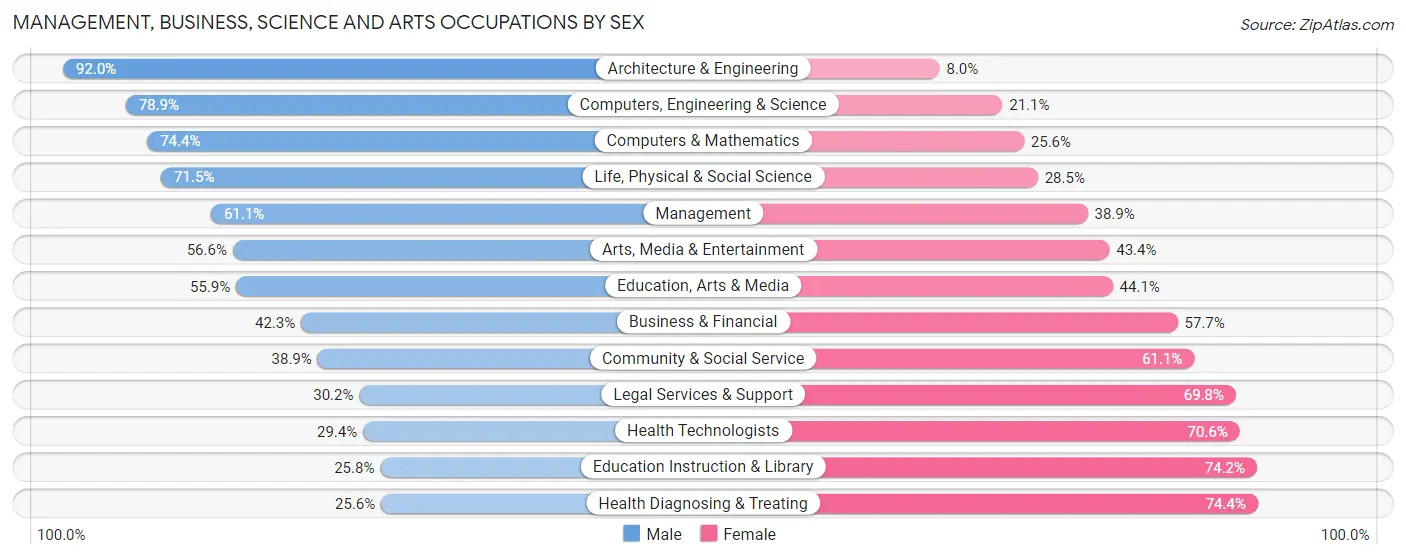
Management, Business, Science and Arts Occupations by Sex
Within the Management, Business, Science and Arts occupations in Indian River County, the most male-oriented occupations are Architecture & Engineering (92.0%), Computers, Engineering & Science (78.9%), and Computers & Mathematics (74.4%), while the most female-oriented occupations are Health Diagnosing & Treating (74.4%), Education Instruction & Library (74.2%), and Health Technologists (70.6%).
| Occupation | Male | Female |
| Management | 4,162 (61.1%) | 2,647 (38.9%) |
| Business & Financial | 1,054 (42.3%) | 1,436 (57.7%) |
| Computers, Engineering & Science | 2,206 (78.9%) | 590 (21.1%) |
| Computers & Mathematics | 1,096 (74.4%) | 377 (25.6%) |
| Architecture & Engineering | 736 (92.0%) | 64 (8.0%) |
| Life, Physical & Social Science | 374 (71.5%) | 149 (28.5%) |
| Community & Social Service | 2,422 (38.9%) | 3,807 (61.1%) |
| Education, Arts & Media | 665 (55.9%) | 525 (44.1%) |
| Legal Services & Support | 279 (30.2%) | 645 (69.8%) |
| Education Instruction & Library | 713 (25.8%) | 2,050 (74.2%) |
| Arts, Media & Entertainment | 765 (56.6%) | 587 (43.4%) |
| Health Diagnosing & Treating | 1,283 (25.6%) | 3,723 (74.4%) |
| Health Technologists | 1,031 (29.4%) | 2,476 (70.6%) |
| Total (Category) | 11,127 (47.7%) | 12,203 (52.3%) |
| Total (Overall) | 31,856 (50.5%) | 31,281 (49.5%) |
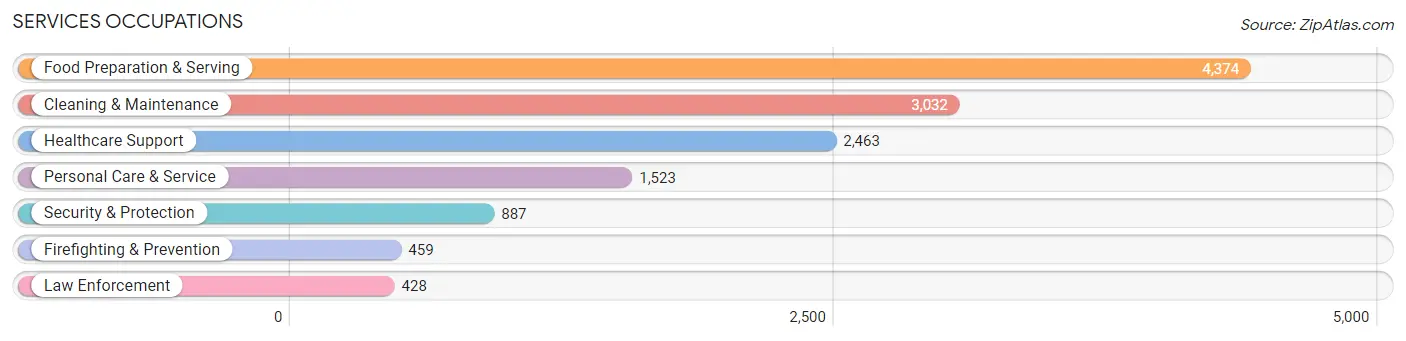
Services Occupations
The most common Services occupations in Indian River County are Food Preparation & Serving (4,374 | 6.9%), Cleaning & Maintenance (3,032 | 4.8%), Healthcare Support (2,463 | 3.9%), Personal Care & Service (1,523 | 2.4%), and Security & Protection (887 | 1.4%).
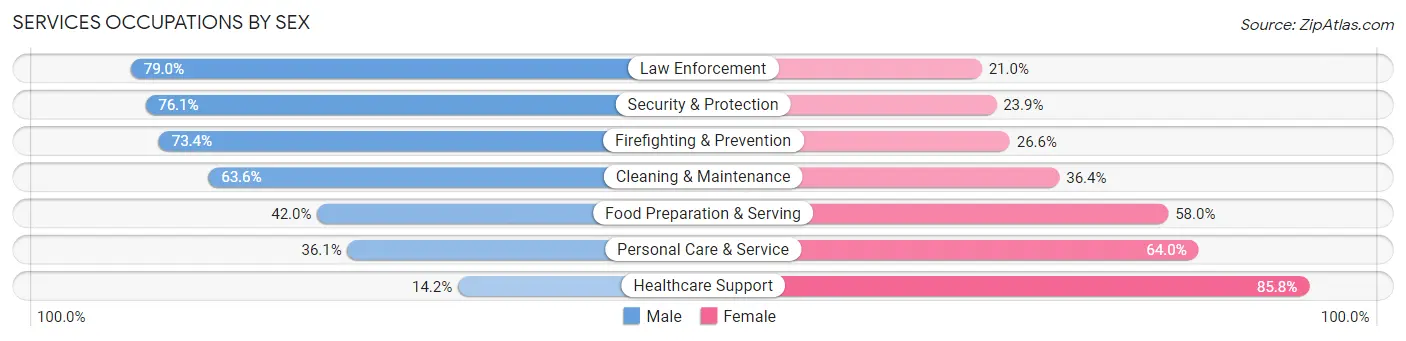
Services Occupations by Sex
Within the Services occupations in Indian River County, the most male-oriented occupations are Law Enforcement (79.0%), Security & Protection (76.1%), and Firefighting & Prevention (73.4%), while the most female-oriented occupations are Healthcare Support (85.8%), Personal Care & Service (63.9%), and Food Preparation & Serving (58.0%).
| Occupation | Male | Female |
| Healthcare Support | 349 (14.2%) | 2,114 (85.8%) |
| Security & Protection | 675 (76.1%) | 212 (23.9%) |
| Firefighting & Prevention | 337 (73.4%) | 122 (26.6%) |
| Law Enforcement | 338 (79.0%) | 90 (21.0%) |
| Food Preparation & Serving | 1,839 (42.0%) | 2,535 (58.0%) |
| Cleaning & Maintenance | 1,929 (63.6%) | 1,103 (36.4%) |
| Personal Care & Service | 549 (36.0%) | 974 (63.9%) |
| Total (Category) | 5,341 (43.5%) | 6,938 (56.5%) |
| Total (Overall) | 31,856 (50.5%) | 31,281 (49.5%) |
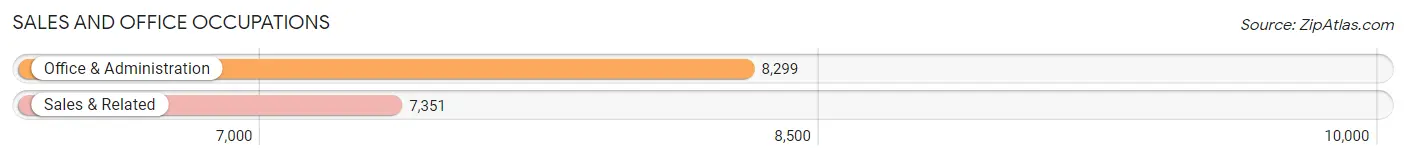
Sales and Office Occupations
The most common Sales and Office occupations in Indian River County are Office & Administration (8,299 | 13.1%), and Sales & Related (7,351 | 11.6%).
Sales and Office Occupations by Sex
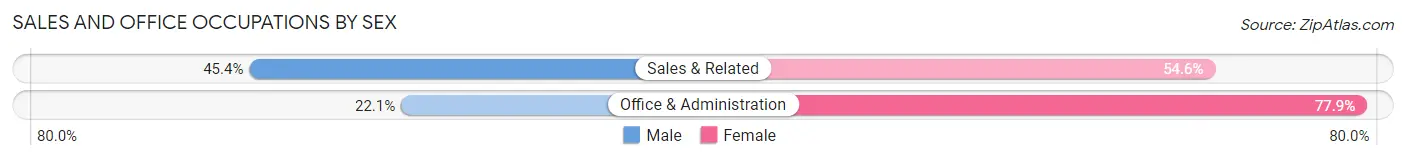
| Occupation | Male | Female |
| Sales & Related | 3,340 (45.4%) | 4,011 (54.6%) |
| Office & Administration | 1,833 (22.1%) | 6,466 (77.9%) |
| Total (Category) | 5,173 (33.1%) | 10,477 (66.9%) |
| Total (Overall) | 31,856 (50.5%) | 31,281 (49.5%) |
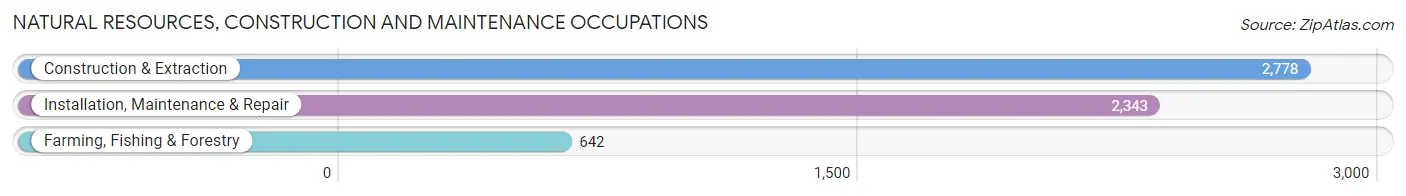
Natural Resources, Construction and Maintenance Occupations
The most common Natural Resources, Construction and Maintenance occupations in Indian River County are Construction & Extraction (2,778 | 4.4%), Installation, Maintenance & Repair (2,343 | 3.7%), and Farming, Fishing & Forestry (642 | 1.0%).
Natural Resources, Construction and Maintenance Occupations by Sex
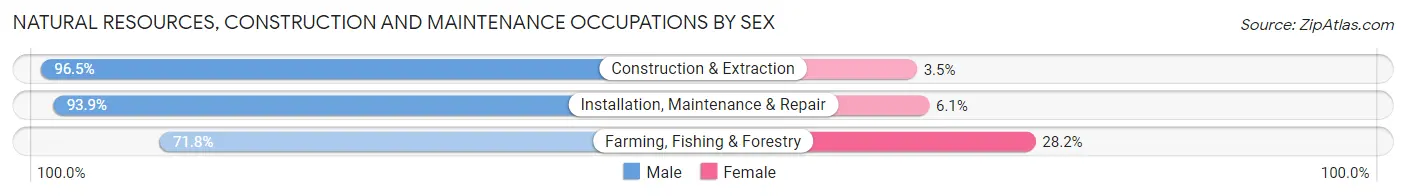
| Occupation | Male | Female |
| Farming, Fishing & Forestry | 461 (71.8%) | 181 (28.2%) |
| Construction & Extraction | 2,681 (96.5%) | 97 (3.5%) |
| Installation, Maintenance & Repair | 2,201 (93.9%) | 142 (6.1%) |
| Total (Category) | 5,343 (92.7%) | 420 (7.3%) |
| Total (Overall) | 31,856 (50.5%) | 31,281 (49.5%) |
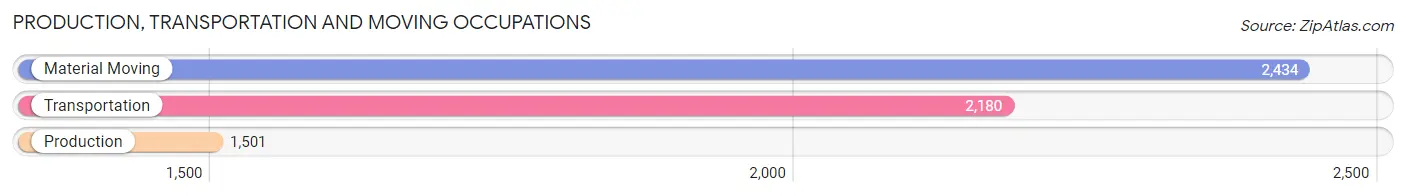
Production, Transportation and Moving Occupations
The most common Production, Transportation and Moving occupations in Indian River County are Material Moving (2,434 | 3.9%), Transportation (2,180 | 3.5%), and Production (1,501 | 2.4%).
Production, Transportation and Moving Occupations by Sex
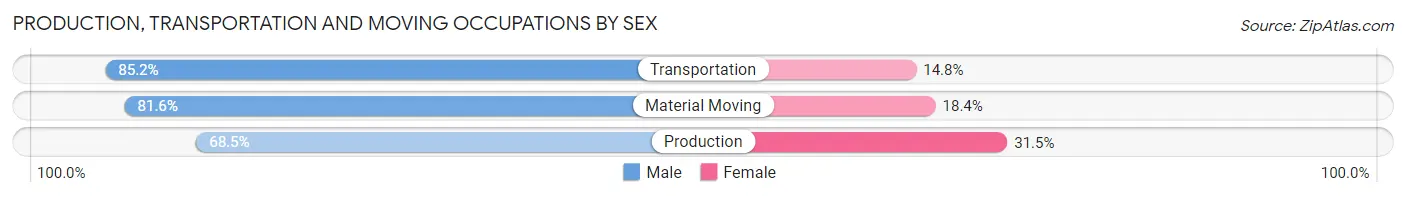
| Occupation | Male | Female |
| Production | 1,028 (68.5%) | 473 (31.5%) |
| Transportation | 1,857 (85.2%) | 323 (14.8%) |
| Material Moving | 1,987 (81.6%) | 447 (18.4%) |
| Total (Category) | 4,872 (79.7%) | 1,243 (20.3%) |
| Total (Overall) | 31,856 (50.5%) | 31,281 (49.5%) |
Employment Industries by Sex in Indian River County
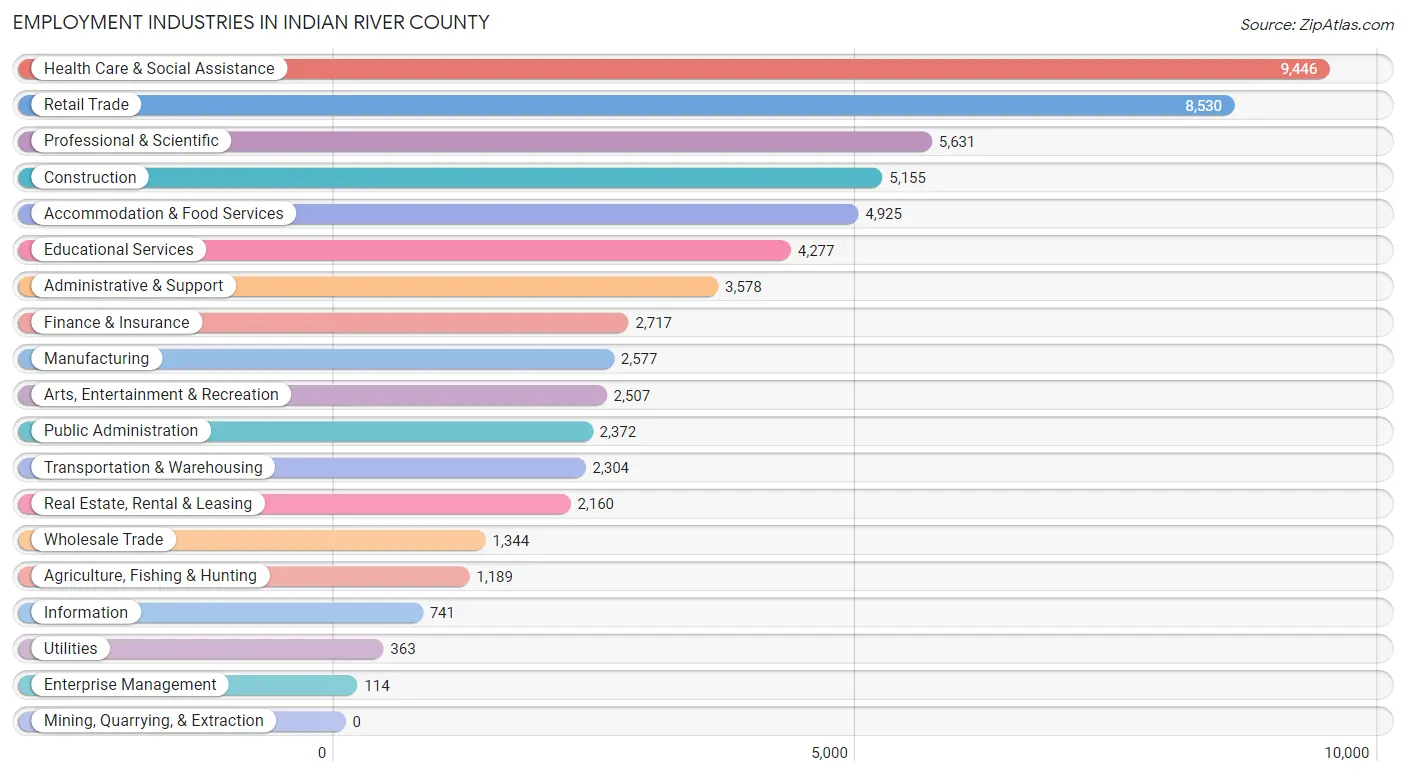
Employment Industries in Indian River County
The major employment industries in Indian River County include Health Care & Social Assistance (9,446 | 15.0%), Retail Trade (8,530 | 13.5%), Professional & Scientific (5,631 | 8.9%), Construction (5,155 | 8.2%), and Accommodation & Food Services (4,925 | 7.8%).
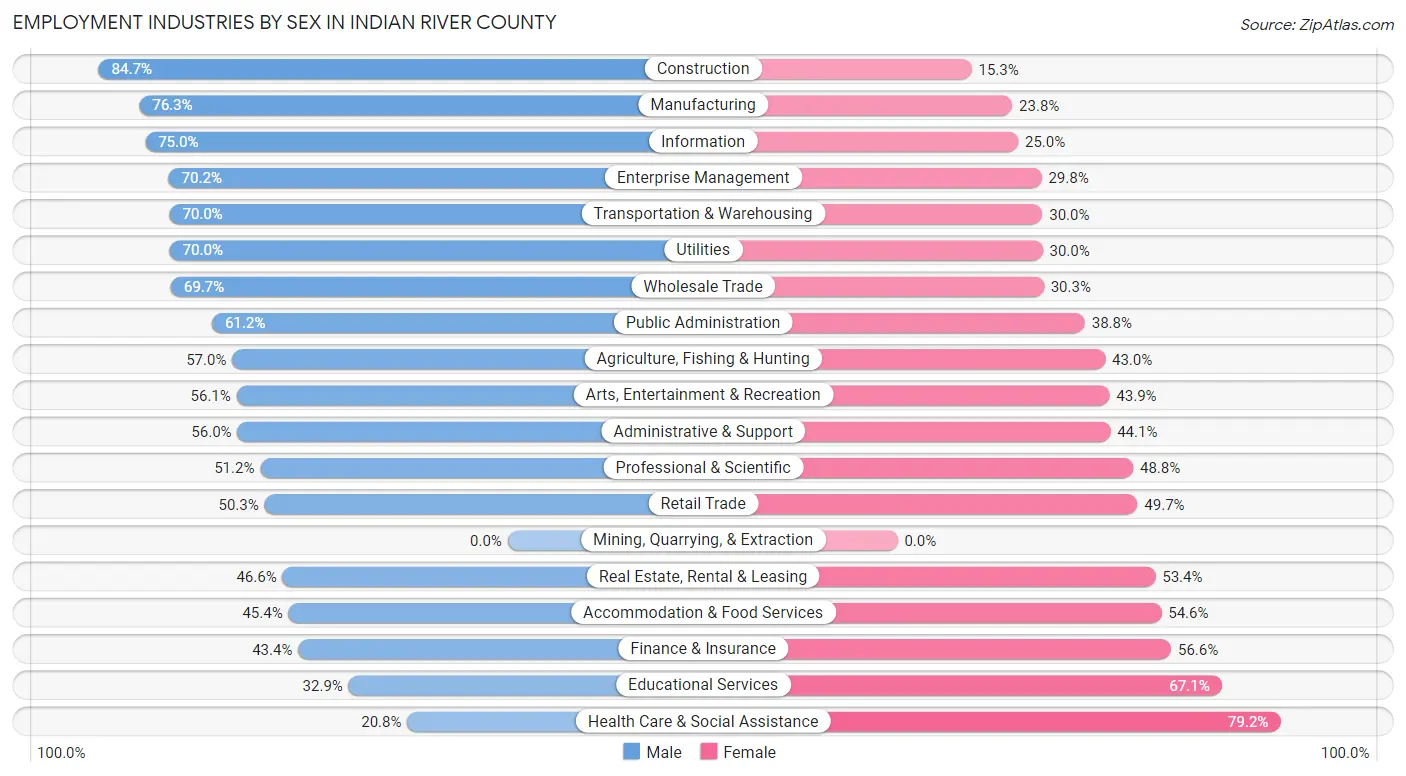
Employment Industries by Sex in Indian River County
The Indian River County industries that see more men than women are Construction (84.7%), Manufacturing (76.2%), and Information (75.0%), whereas the industries that tend to have a higher number of women are Health Care & Social Assistance (79.2%), Educational Services (67.1%), and Finance & Insurance (56.6%).
| Industry | Male | Female |
| Agriculture, Fishing & Hunting | 678 (57.0%) | 511 (43.0%) |
| Mining, Quarrying, & Extraction | 0 (0.0%) | 0 (0.0%) |
| Construction | 4,364 (84.7%) | 791 (15.3%) |
| Manufacturing | 1,965 (76.2%) | 612 (23.7%) |
| Wholesale Trade | 937 (69.7%) | 407 (30.3%) |
| Retail Trade | 4,293 (50.3%) | 4,237 (49.7%) |
| Transportation & Warehousing | 1,613 (70.0%) | 691 (30.0%) |
| Utilities | 254 (70.0%) | 109 (30.0%) |
| Information | 556 (75.0%) | 185 (25.0%) |
| Finance & Insurance | 1,178 (43.4%) | 1,539 (56.6%) |
| Real Estate, Rental & Leasing | 1,007 (46.6%) | 1,153 (53.4%) |
| Professional & Scientific | 2,885 (51.2%) | 2,746 (48.8%) |
| Enterprise Management | 80 (70.2%) | 34 (29.8%) |
| Administrative & Support | 2,002 (55.9%) | 1,576 (44.1%) |
| Educational Services | 1,408 (32.9%) | 2,869 (67.1%) |
| Health Care & Social Assistance | 1,964 (20.8%) | 7,482 (79.2%) |
| Arts, Entertainment & Recreation | 1,407 (56.1%) | 1,100 (43.9%) |
| Accommodation & Food Services | 2,235 (45.4%) | 2,690 (54.6%) |
| Public Administration | 1,452 (61.2%) | 920 (38.8%) |
| Total | 31,856 (50.5%) | 31,281 (49.5%) |
Education in Indian River County
School Enrollment in Indian River County
The most common levels of schooling among the 27,572 students in Indian River County are high school (5,923 | 21.5%), middle school (5,770 | 20.9%), and college / undergraduate (5,635 | 20.4%).
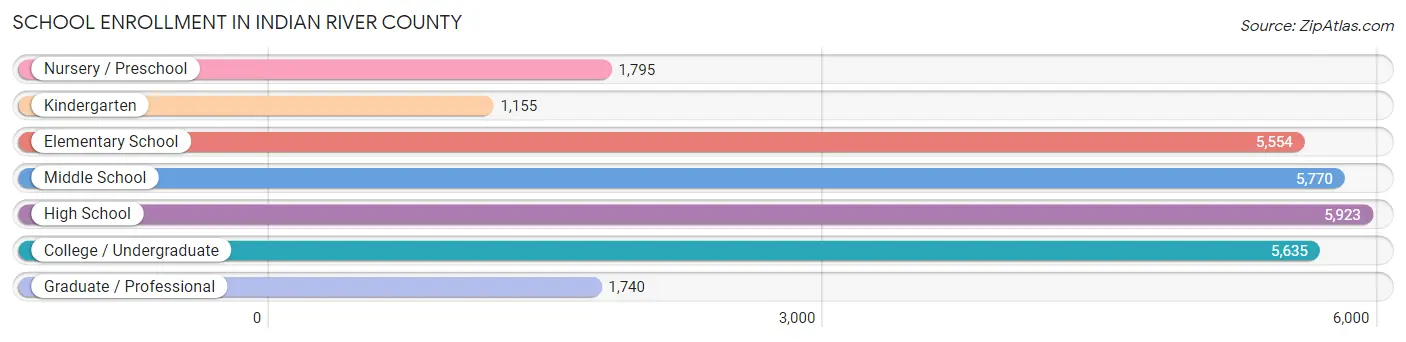
| School Level | # Students | % Students |
| Nursery / Preschool | 1,795 | 6.5% |
| Kindergarten | 1,155 | 4.2% |
| Elementary School | 5,554 | 20.1% |
| Middle School | 5,770 | 20.9% |
| High School | 5,923 | 21.5% |
| College / Undergraduate | 5,635 | 20.4% |
| Graduate / Professional | 1,740 | 6.3% |
| Total | 27,572 | 100.0% |
School Enrollment by Age by Funding Source in Indian River County
Out of a total of 27,572 students who are enrolled in schools in Indian River County, 5,956 (21.6%) attend a private institution, while the remaining 21,616 (78.4%) are enrolled in public schools. The age group of 3 to 4 year olds has the highest likelihood of being enrolled in private schools, with 837 (56.0% in the age bracket) enrolled. Conversely, the age group of 15 to 17 year olds has the lowest likelihood of being enrolled in a private school, with 4,064 (89.5% in the age bracket) attending a public institution.
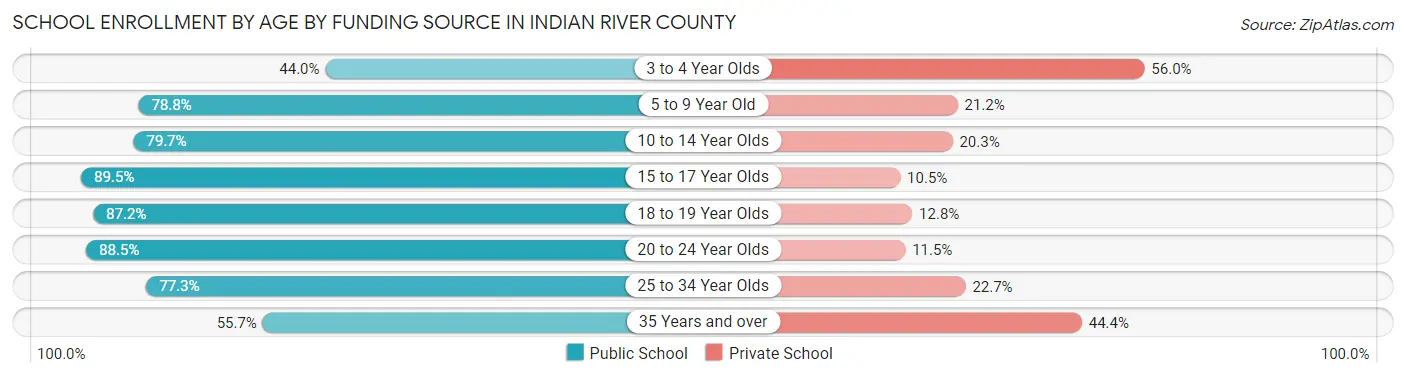
| Age Bracket | Public School | Private School |
| 3 to 4 Year Olds | 657 (44.0%) | 837 (56.0%) |
| 5 to 9 Year Old | 4,897 (78.8%) | 1,318 (21.2%) |
| 10 to 14 Year Olds | 5,547 (79.7%) | 1,410 (20.3%) |
| 15 to 17 Year Olds | 4,064 (89.5%) | 478 (10.5%) |
| 18 to 19 Year Olds | 1,654 (87.2%) | 242 (12.8%) |
| 20 to 24 Year Olds | 2,102 (88.5%) | 272 (11.5%) |
| 25 to 34 Year Olds | 1,476 (77.3%) | 433 (22.7%) |
| 35 Years and over | 1,216 (55.6%) | 969 (44.4%) |
| Total | 21,616 (78.4%) | 5,956 (21.6%) |
Educational Attainment by Field of Study in Indian River County
Business (9,729 | 22.1%), education (6,283 | 14.2%), social sciences (4,607 | 10.4%), science & technology (4,516 | 10.2%), and arts & humanities (2,890 | 6.6%) are the most common fields of study among 44,125 individuals in Indian River County who have obtained a bachelor's degree or higher.
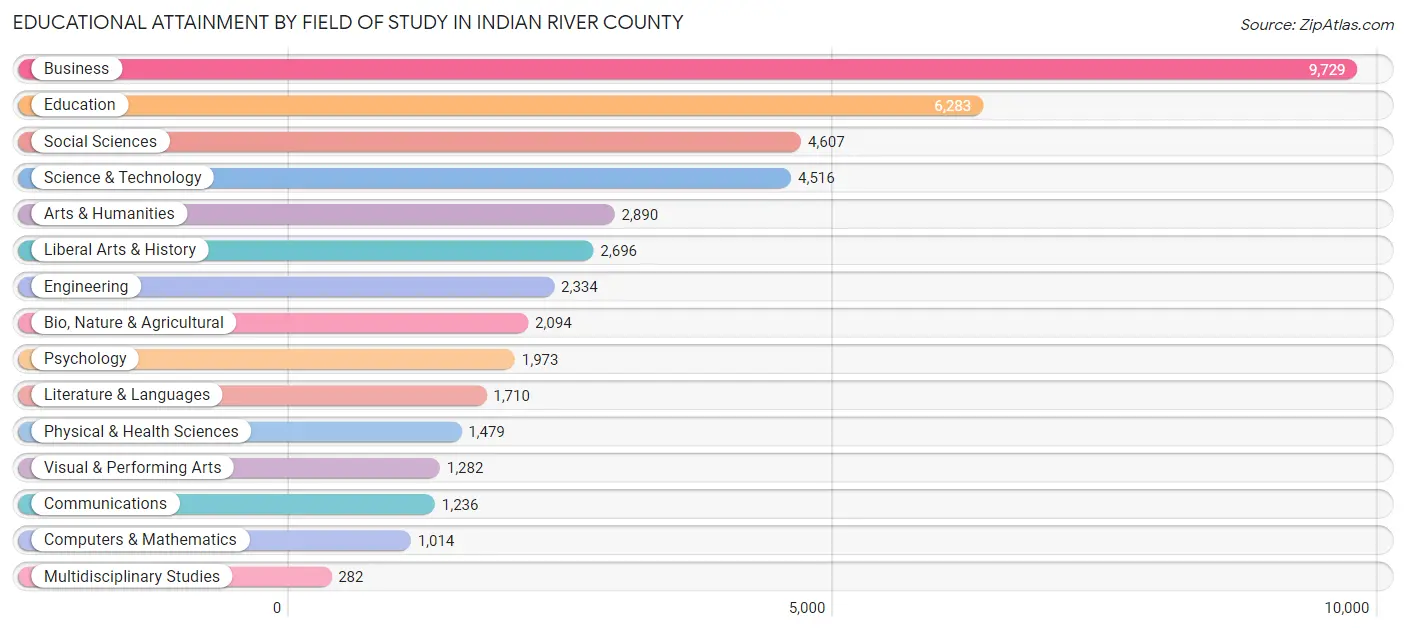
| Field of Study | # Graduates | % Graduates |
| Computers & Mathematics | 1,014 | 2.3% |
| Bio, Nature & Agricultural | 2,094 | 4.8% |
| Physical & Health Sciences | 1,479 | 3.4% |
| Psychology | 1,973 | 4.5% |
| Social Sciences | 4,607 | 10.4% |
| Engineering | 2,334 | 5.3% |
| Multidisciplinary Studies | 282 | 0.6% |
| Science & Technology | 4,516 | 10.2% |
| Business | 9,729 | 22.1% |
| Education | 6,283 | 14.2% |
| Literature & Languages | 1,710 | 3.9% |
| Liberal Arts & History | 2,696 | 6.1% |
| Visual & Performing Arts | 1,282 | 2.9% |
| Communications | 1,236 | 2.8% |
| Arts & Humanities | 2,890 | 6.6% |
| Total | 44,125 | 100.0% |
Transportation & Commute in Indian River County
Vehicle Availability by Sex in Indian River County
The most prevalent vehicle ownership categories in Indian River County are males with 2 vehicles (15,191, accounting for 48.4%) and females with 2 vehicles (13,812, making up 49.8%).
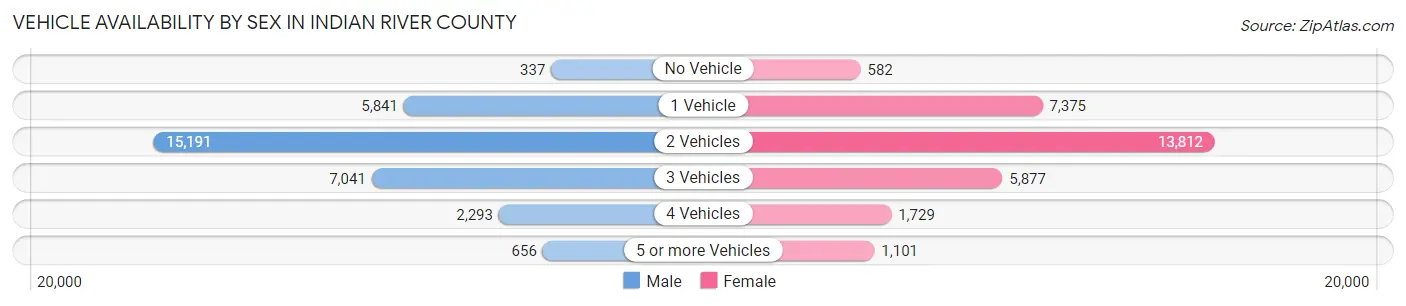
| Vehicles Available | Male | Female |
| No Vehicle | 337 (1.1%) | 582 (1.9%) |
| 1 Vehicle | 5,841 (18.6%) | 7,375 (24.2%) |
| 2 Vehicles | 15,191 (48.4%) | 13,812 (45.3%) |
| 3 Vehicles | 7,041 (22.5%) | 5,877 (19.3%) |
| 4 Vehicles | 2,293 (7.3%) | 1,729 (5.7%) |
| 5 or more Vehicles | 656 (2.1%) | 1,101 (3.6%) |
| Total | 31,359 (100.0%) | 30,476 (100.0%) |
Commute Time in Indian River County
The most frequently occuring commute durations in Indian River County are 10 to 14 minutes (10,999 commuters, 19.9%), 15 to 19 minutes (10,775 commuters, 19.5%), and 20 to 24 minutes (8,268 commuters, 15.0%).
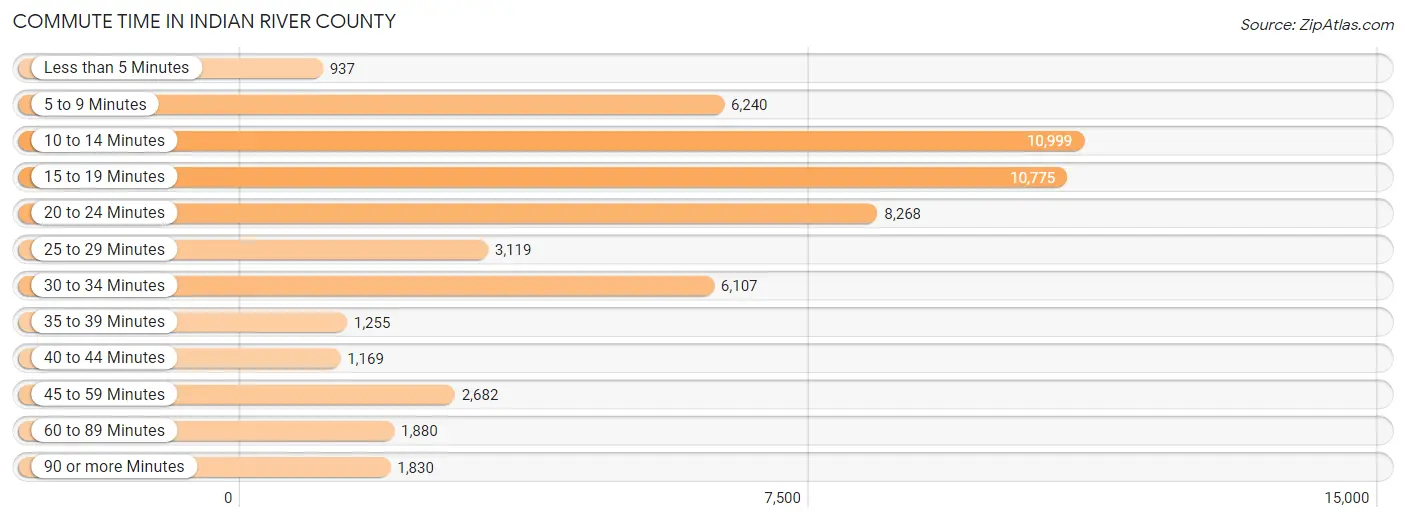
| Commute Time | # Commuters | % Commuters |
| Less than 5 Minutes | 937 | 1.7% |
| 5 to 9 Minutes | 6,240 | 11.3% |
| 10 to 14 Minutes | 10,999 | 19.9% |
| 15 to 19 Minutes | 10,775 | 19.5% |
| 20 to 24 Minutes | 8,268 | 15.0% |
| 25 to 29 Minutes | 3,119 | 5.6% |
| 30 to 34 Minutes | 6,107 | 11.1% |
| 35 to 39 Minutes | 1,255 | 2.3% |
| 40 to 44 Minutes | 1,169 | 2.1% |
| 45 to 59 Minutes | 2,682 | 4.9% |
| 60 to 89 Minutes | 1,880 | 3.4% |
| 90 or more Minutes | 1,830 | 3.3% |
Commute Time by Sex in Indian River County
The most common commute times in Indian River County are 10 to 14 minutes (5,835 commuters, 20.5%) for males and 15 to 19 minutes (5,913 commuters, 22.1%) for females.
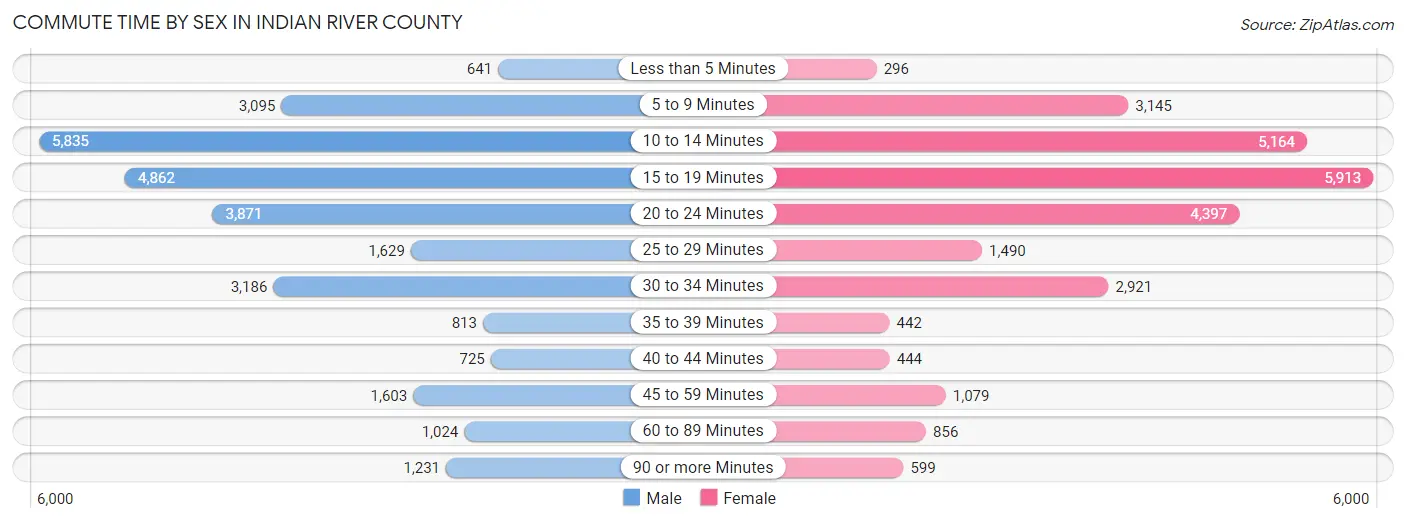
| Commute Time | Male | Female |
| Less than 5 Minutes | 641 (2.2%) | 296 (1.1%) |
| 5 to 9 Minutes | 3,095 (10.8%) | 3,145 (11.8%) |
| 10 to 14 Minutes | 5,835 (20.5%) | 5,164 (19.3%) |
| 15 to 19 Minutes | 4,862 (17.1%) | 5,913 (22.1%) |
| 20 to 24 Minutes | 3,871 (13.6%) | 4,397 (16.4%) |
| 25 to 29 Minutes | 1,629 (5.7%) | 1,490 (5.6%) |
| 30 to 34 Minutes | 3,186 (11.2%) | 2,921 (10.9%) |
| 35 to 39 Minutes | 813 (2.9%) | 442 (1.7%) |
| 40 to 44 Minutes | 725 (2.5%) | 444 (1.7%) |
| 45 to 59 Minutes | 1,603 (5.6%) | 1,079 (4.0%) |
| 60 to 89 Minutes | 1,024 (3.6%) | 856 (3.2%) |
| 90 or more Minutes | 1,231 (4.3%) | 599 (2.2%) |
Time of Departure to Work by Sex in Indian River County
The most frequent times of departure to work in Indian River County are 7:00 AM to 7:29 AM (4,738, 16.6%) for males and 7:30 AM to 7:59 AM (3,930, 14.7%) for females.
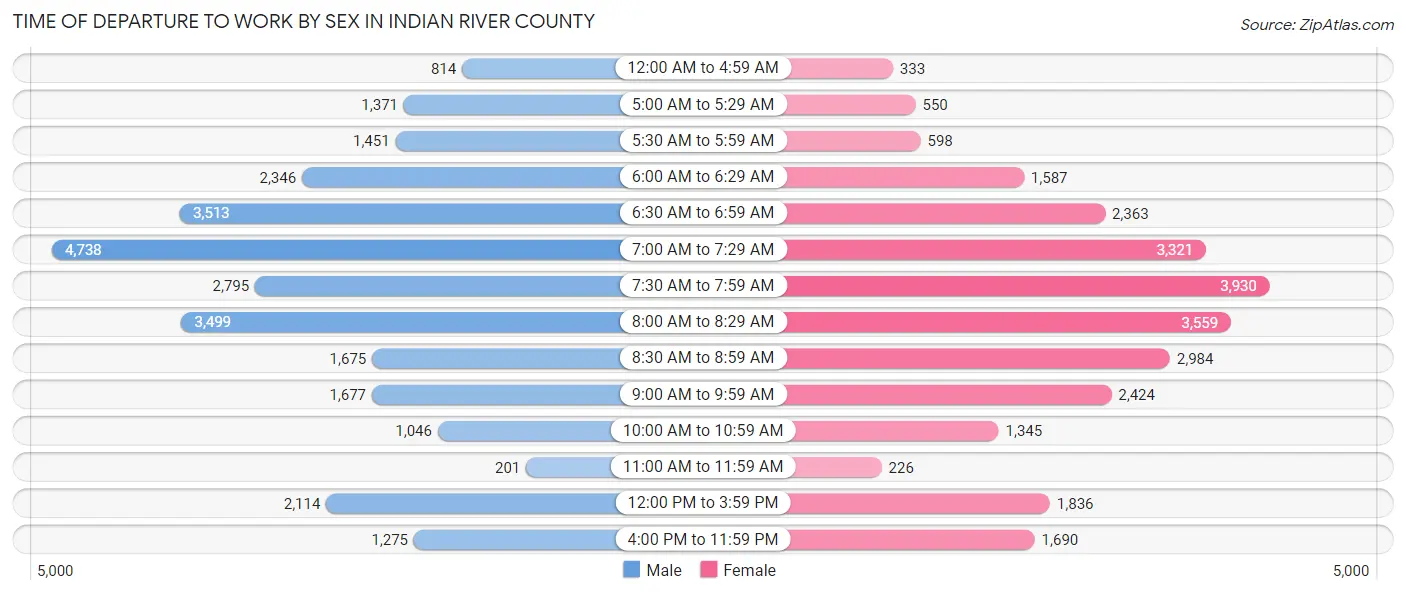
| Time of Departure | Male | Female |
| 12:00 AM to 4:59 AM | 814 (2.9%) | 333 (1.3%) |
| 5:00 AM to 5:29 AM | 1,371 (4.8%) | 550 (2.1%) |
| 5:30 AM to 5:59 AM | 1,451 (5.1%) | 598 (2.2%) |
| 6:00 AM to 6:29 AM | 2,346 (8.2%) | 1,587 (5.9%) |
| 6:30 AM to 6:59 AM | 3,513 (12.3%) | 2,363 (8.8%) |
| 7:00 AM to 7:29 AM | 4,738 (16.6%) | 3,321 (12.4%) |
| 7:30 AM to 7:59 AM | 2,795 (9.8%) | 3,930 (14.7%) |
| 8:00 AM to 8:29 AM | 3,499 (12.3%) | 3,559 (13.3%) |
| 8:30 AM to 8:59 AM | 1,675 (5.9%) | 2,984 (11.2%) |
| 9:00 AM to 9:59 AM | 1,677 (5.9%) | 2,424 (9.1%) |
| 10:00 AM to 10:59 AM | 1,046 (3.7%) | 1,345 (5.0%) |
| 11:00 AM to 11:59 AM | 201 (0.7%) | 226 (0.8%) |
| 12:00 PM to 3:59 PM | 2,114 (7.4%) | 1,836 (6.9%) |
| 4:00 PM to 11:59 PM | 1,275 (4.5%) | 1,690 (6.3%) |
| Total | 28,515 (100.0%) | 26,746 (100.0%) |
Housing Occupancy in Indian River County
Occupancy by Ownership in Indian River County
Of the total 65,735 dwellings in Indian River County, owner-occupied units account for 52,704 (80.2%), while renter-occupied units make up 13,031 (19.8%).
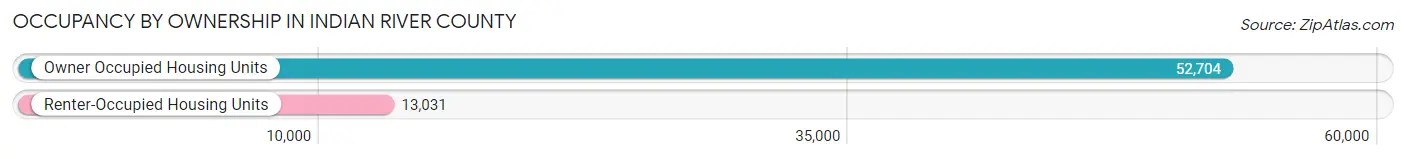
| Occupancy | # Housing Units | % Housing Units |
| Owner Occupied Housing Units | 52,704 | 80.2% |
| Renter-Occupied Housing Units | 13,031 | 19.8% |
| Total Occupied Housing Units | 65,735 | 100.0% |
Occupancy by Household Size in Indian River County
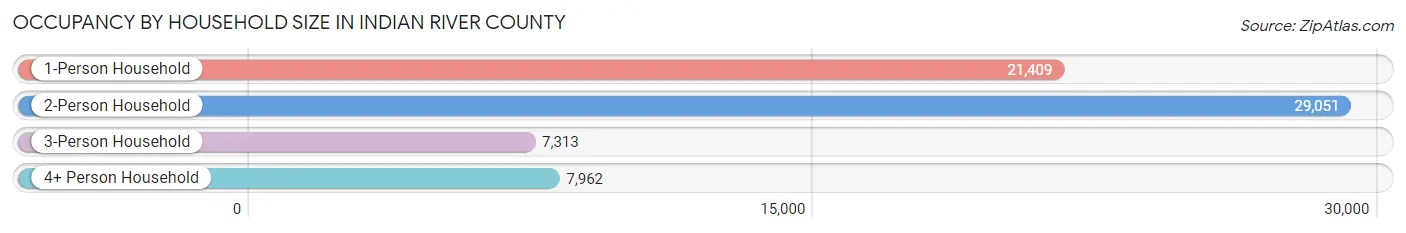
| Household Size | # Housing Units | % Housing Units |
| 1-Person Household | 21,409 | 32.6% |
| 2-Person Household | 29,051 | 44.2% |
| 3-Person Household | 7,313 | 11.1% |
| 4+ Person Household | 7,962 | 12.1% |
| Total Housing Units | 65,735 | 100.0% |
Occupancy by Ownership by Household Size in Indian River County
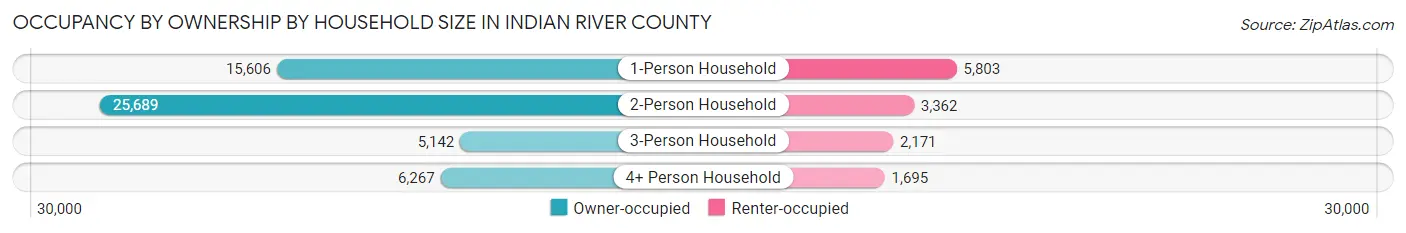
| Household Size | Owner-occupied | Renter-occupied |
| 1-Person Household | 15,606 (72.9%) | 5,803 (27.1%) |
| 2-Person Household | 25,689 (88.4%) | 3,362 (11.6%) |
| 3-Person Household | 5,142 (70.3%) | 2,171 (29.7%) |
| 4+ Person Household | 6,267 (78.7%) | 1,695 (21.3%) |
| Total Housing Units | 52,704 (80.2%) | 13,031 (19.8%) |
Occupancy by Educational Attainment in Indian River County
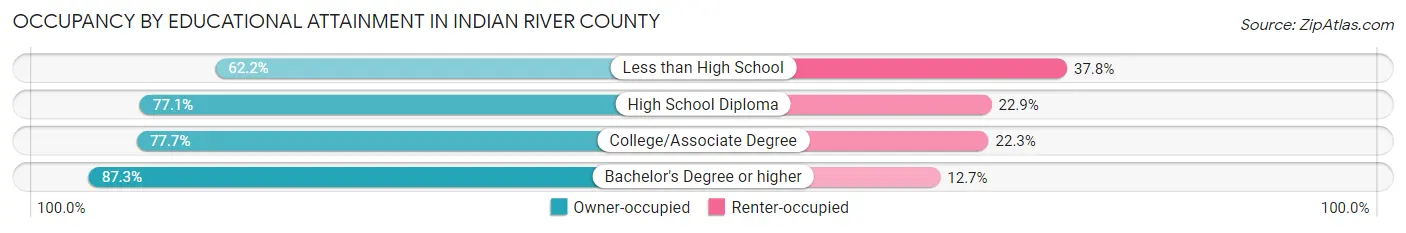
| Household Size | Owner-occupied | Renter-occupied |
| Less than High School | 2,481 (62.2%) | 1,510 (37.8%) |
| High School Diploma | 11,897 (77.1%) | 3,527 (22.9%) |
| College/Associate Degree | 17,041 (77.7%) | 4,888 (22.3%) |
| Bachelor's Degree or higher | 21,285 (87.3%) | 3,106 (12.7%) |
Occupancy by Age of Householder in Indian River County
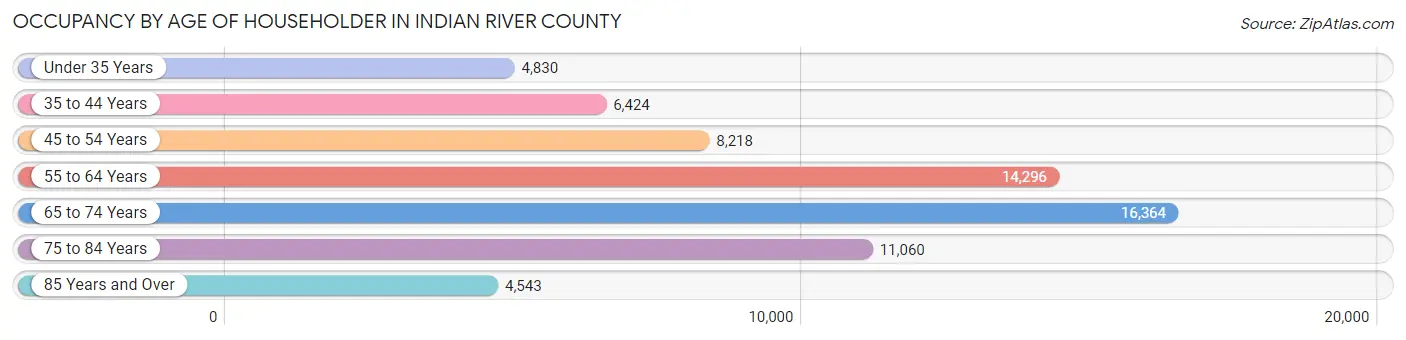
| Age Bracket | # Households | % Households |
| Under 35 Years | 4,830 | 7.3% |
| 35 to 44 Years | 6,424 | 9.8% |
| 45 to 54 Years | 8,218 | 12.5% |
| 55 to 64 Years | 14,296 | 21.7% |
| 65 to 74 Years | 16,364 | 24.9% |
| 75 to 84 Years | 11,060 | 16.8% |
| 85 Years and Over | 4,543 | 6.9% |
| Total | 65,735 | 100.0% |
Housing Finances in Indian River County
Median Income by Occupancy in Indian River County
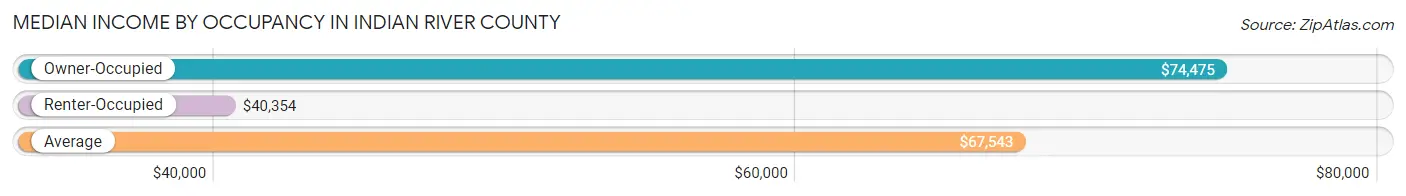
| Occupancy Type | # Households | Median Income |
| Owner-Occupied | 52,704 (80.2%) | $74,475 |
| Renter-Occupied | 13,031 (19.8%) | $40,354 |
| Average | 65,735 (100.0%) | $67,543 |
Occupancy by Householder Income Bracket in Indian River County
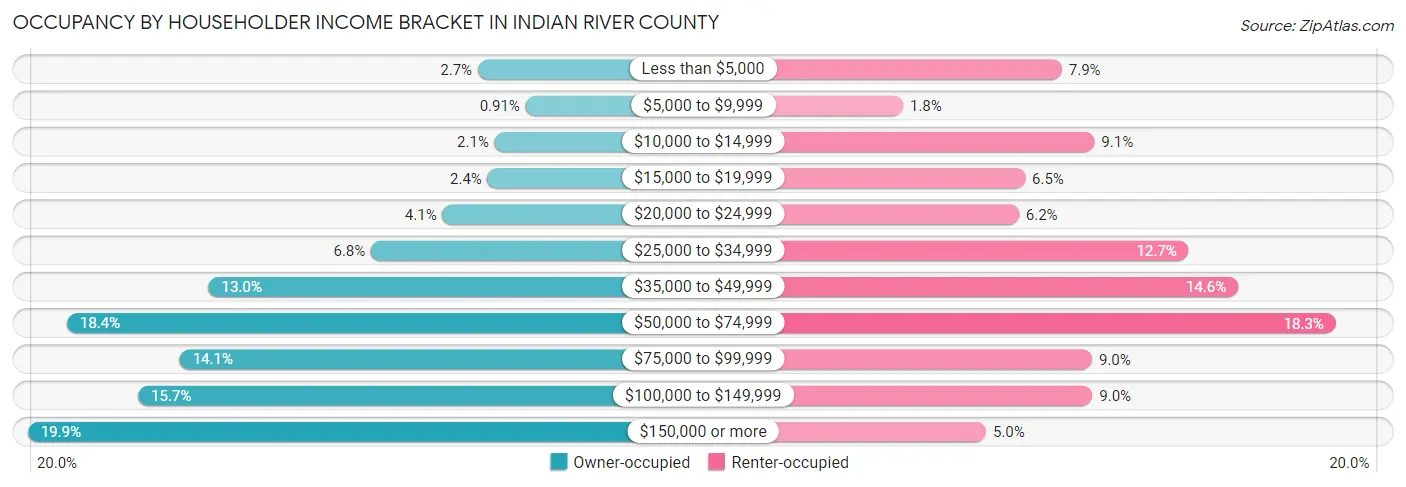
| Income Bracket | Owner-occupied | Renter-occupied |
| Less than $5,000 | 1,441 (2.7%) | 1,024 (7.9%) |
| $5,000 to $9,999 | 478 (0.9%) | 236 (1.8%) |
| $10,000 to $14,999 | 1,101 (2.1%) | 1,186 (9.1%) |
| $15,000 to $19,999 | 1,244 (2.4%) | 842 (6.5%) |
| $20,000 to $24,999 | 2,152 (4.1%) | 810 (6.2%) |
| $25,000 to $34,999 | 3,585 (6.8%) | 1,653 (12.7%) |
| $35,000 to $49,999 | 6,845 (13.0%) | 1,899 (14.6%) |
| $50,000 to $74,999 | 9,693 (18.4%) | 2,384 (18.3%) |
| $75,000 to $99,999 | 7,426 (14.1%) | 1,174 (9.0%) |
| $100,000 to $149,999 | 8,264 (15.7%) | 1,176 (9.0%) |
| $150,000 or more | 10,475 (19.9%) | 647 (5.0%) |
| Total | 52,704 (100.0%) | 13,031 (100.0%) |
Monthly Housing Cost Tiers in Indian River County

| Monthly Cost | Owner-occupied | Renter-occupied |
| Less than $300 | 3,966 (7.5%) | 190 (1.5%) |
| $300 to $499 | 6,368 (12.1%) | 474 (3.6%) |
| $500 to $799 | 10,171 (19.3%) | 1,142 (8.8%) |
| $800 to $999 | 5,623 (10.7%) | 1,727 (13.3%) |
| $1,000 to $1,499 | 10,821 (20.5%) | 4,861 (37.3%) |
| $1,500 to $1,999 | 7,861 (14.9%) | 2,009 (15.4%) |
| $2,000 to $2,499 | 3,718 (7.0%) | 970 (7.4%) |
| $2,500 to $2,999 | 1,481 (2.8%) | 162 (1.2%) |
| $3,000 or more | 2,695 (5.1%) | 324 (2.5%) |
| Total | 52,704 (100.0%) | 13,031 (100.0%) |
Physical Housing Characteristics in Indian River County
Housing Structures in Indian River County
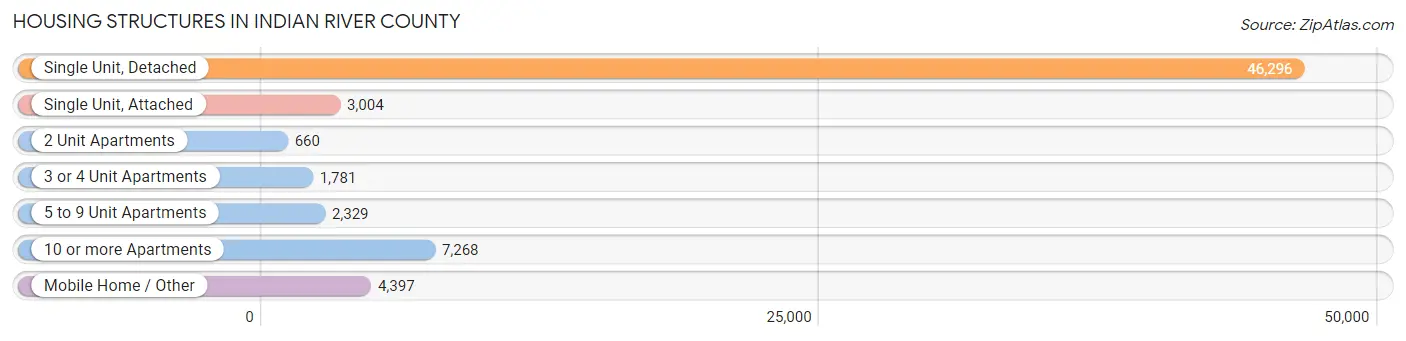
| Structure Type | # Housing Units | % Housing Units |
| Single Unit, Detached | 46,296 | 70.4% |
| Single Unit, Attached | 3,004 | 4.6% |
| 2 Unit Apartments | 660 | 1.0% |
| 3 or 4 Unit Apartments | 1,781 | 2.7% |
| 5 to 9 Unit Apartments | 2,329 | 3.5% |
| 10 or more Apartments | 7,268 | 11.1% |
| Mobile Home / Other | 4,397 | 6.7% |
| Total | 65,735 | 100.0% |
Housing Structures by Occupancy in Indian River County
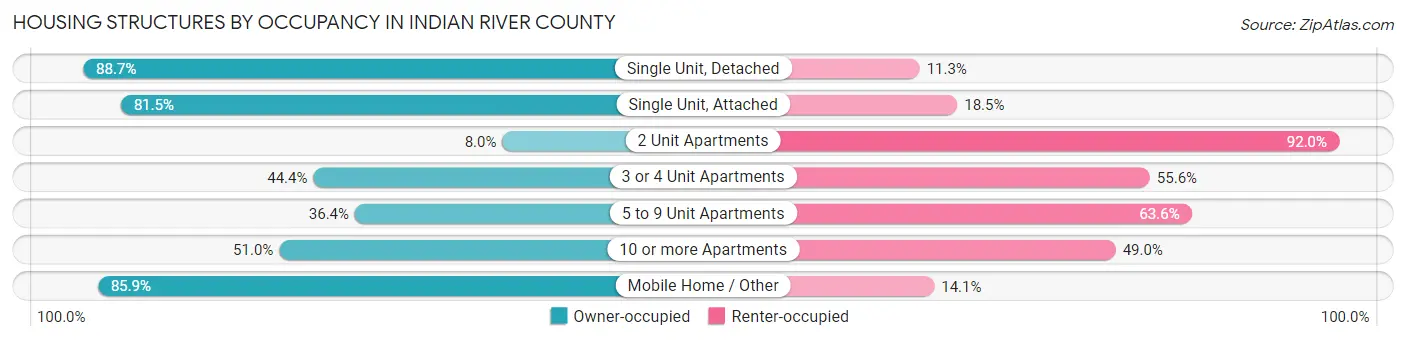
| Structure Type | Owner-occupied | Renter-occupied |
| Single Unit, Detached | 41,080 (88.7%) | 5,216 (11.3%) |
| Single Unit, Attached | 2,448 (81.5%) | 556 (18.5%) |
| 2 Unit Apartments | 53 (8.0%) | 607 (92.0%) |
| 3 or 4 Unit Apartments | 791 (44.4%) | 990 (55.6%) |
| 5 to 9 Unit Apartments | 848 (36.4%) | 1,481 (63.6%) |
| 10 or more Apartments | 3,706 (51.0%) | 3,562 (49.0%) |
| Mobile Home / Other | 3,778 (85.9%) | 619 (14.1%) |
| Total | 52,704 (80.2%) | 13,031 (19.8%) |
Housing Structures by Number of Rooms in Indian River County
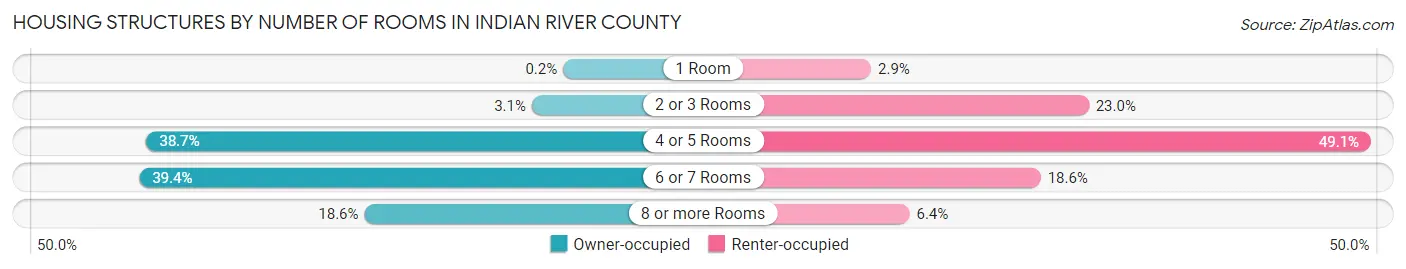
| Number of Rooms | Owner-occupied | Renter-occupied |
| 1 Room | 107 (0.2%) | 375 (2.9%) |
| 2 or 3 Rooms | 1,627 (3.1%) | 2,998 (23.0%) |
| 4 or 5 Rooms | 20,416 (38.7%) | 6,399 (49.1%) |
| 6 or 7 Rooms | 20,763 (39.4%) | 2,420 (18.6%) |
| 8 or more Rooms | 9,791 (18.6%) | 839 (6.4%) |
| Total | 52,704 (100.0%) | 13,031 (100.0%) |
Housing Structure by Heating Type in Indian River County
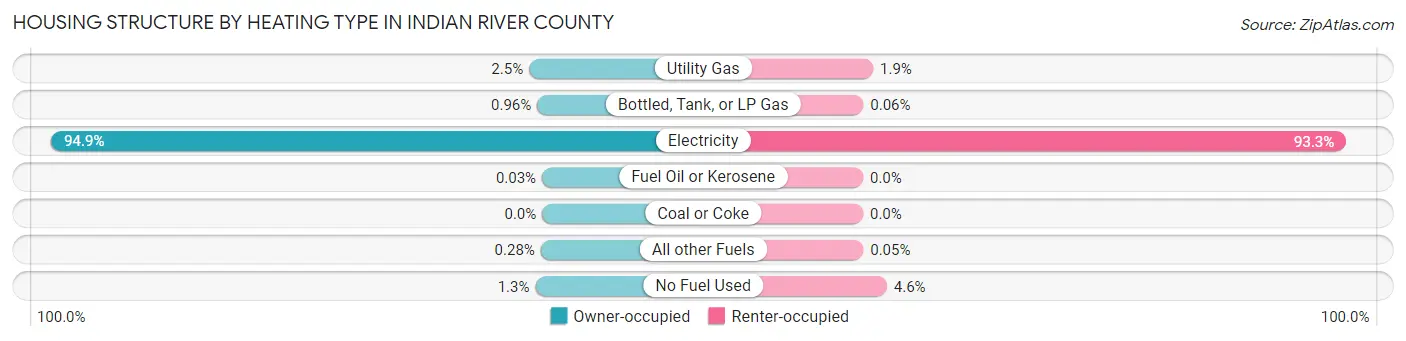
| Heating Type | Owner-occupied | Renter-occupied |
| Utility Gas | 1,331 (2.5%) | 253 (1.9%) |
| Bottled, Tank, or LP Gas | 505 (1.0%) | 8 (0.1%) |
| Electricity | 50,011 (94.9%) | 12,163 (93.3%) |
| Fuel Oil or Kerosene | 15 (0.0%) | 0 (0.0%) |
| Coal or Coke | 0 (0.0%) | 0 (0.0%) |
| All other Fuels | 146 (0.3%) | 7 (0.1%) |
| No Fuel Used | 696 (1.3%) | 600 (4.6%) |
| Total | 52,704 (100.0%) | 13,031 (100.0%) |
Household Vehicle Usage in Indian River County
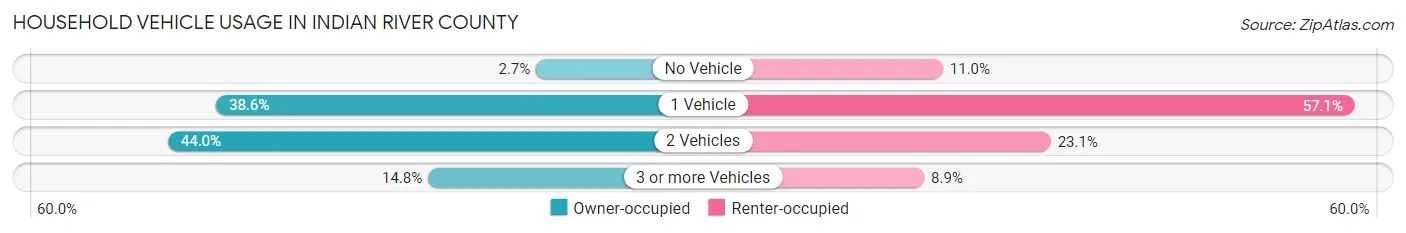
| Vehicles per Household | Owner-occupied | Renter-occupied |
| No Vehicle | 1,424 (2.7%) | 1,430 (11.0%) |
| 1 Vehicle | 20,315 (38.6%) | 7,442 (57.1%) |
| 2 Vehicles | 23,161 (44.0%) | 3,003 (23.1%) |
| 3 or more Vehicles | 7,804 (14.8%) | 1,156 (8.9%) |
| Total | 52,704 (100.0%) | 13,031 (100.0%) |
Real Estate & Mortgages in Indian River County
Real Estate and Mortgage Overview in Indian River County
| Characteristic | Without Mortgage | With Mortgage |
| Housing Units | 27,920 | 24,784 |
| Median Property Value | $282,300 | $286,600 |
| Median Household Income | $66,859 | $5,666 |
| Monthly Housing Costs | $618 | $1,975 |
| Real Estate Taxes | $2,167 | $460 |
Property Value by Mortgage Status in Indian River County
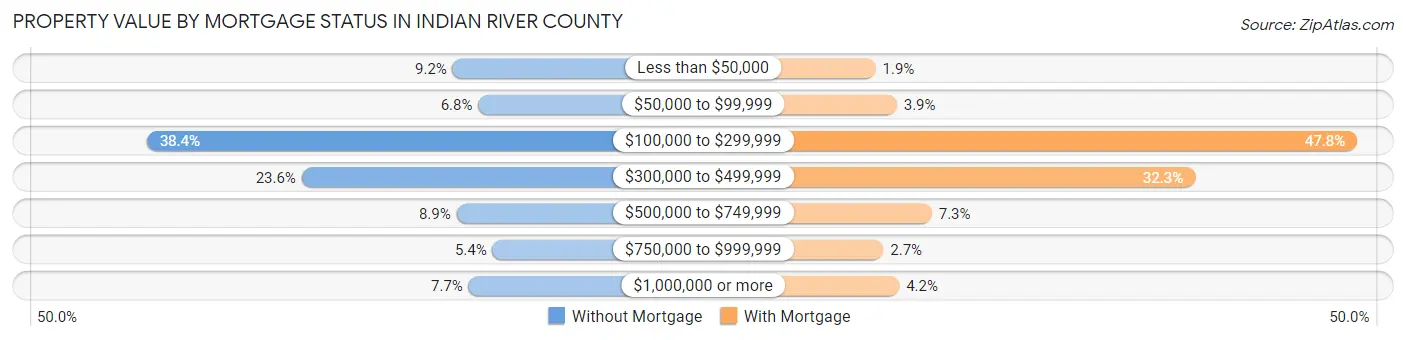
| Property Value | Without Mortgage | With Mortgage |
| Less than $50,000 | 2,578 (9.2%) | 473 (1.9%) |
| $50,000 to $99,999 | 1,895 (6.8%) | 973 (3.9%) |
| $100,000 to $299,999 | 10,712 (38.4%) | 11,837 (47.8%) |
| $300,000 to $499,999 | 6,593 (23.6%) | 8,013 (32.3%) |
| $500,000 to $749,999 | 2,473 (8.9%) | 1,800 (7.3%) |
| $750,000 to $999,999 | 1,517 (5.4%) | 658 (2.6%) |
| $1,000,000 or more | 2,152 (7.7%) | 1,030 (4.2%) |
| Total | 27,920 (100.0%) | 24,784 (100.0%) |
Household Income by Mortgage Status in Indian River County
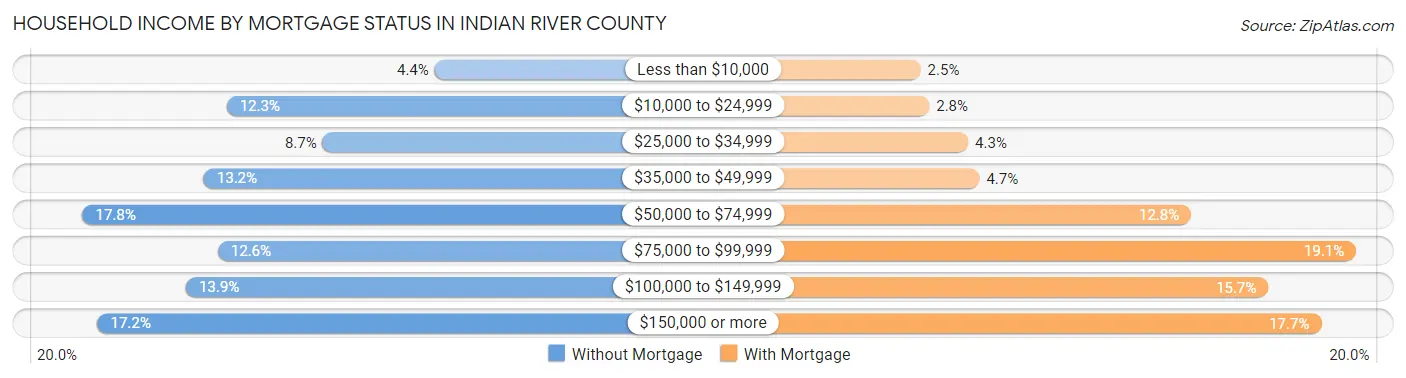
| Household Income | Without Mortgage | With Mortgage |
| Less than $10,000 | 1,222 (4.4%) | 614 (2.5%) |
| $10,000 to $24,999 | 3,434 (12.3%) | 697 (2.8%) |
| $25,000 to $34,999 | 2,414 (8.6%) | 1,063 (4.3%) |
| $35,000 to $49,999 | 3,678 (13.2%) | 1,171 (4.7%) |
| $50,000 to $74,999 | 4,966 (17.8%) | 3,167 (12.8%) |
| $75,000 to $99,999 | 3,530 (12.6%) | 4,727 (19.1%) |
| $100,000 to $149,999 | 3,867 (13.9%) | 3,896 (15.7%) |
| $150,000 or more | 4,809 (17.2%) | 4,397 (17.7%) |
| Total | 27,920 (100.0%) | 24,784 (100.0%) |
Property Value to Household Income Ratio in Indian River County
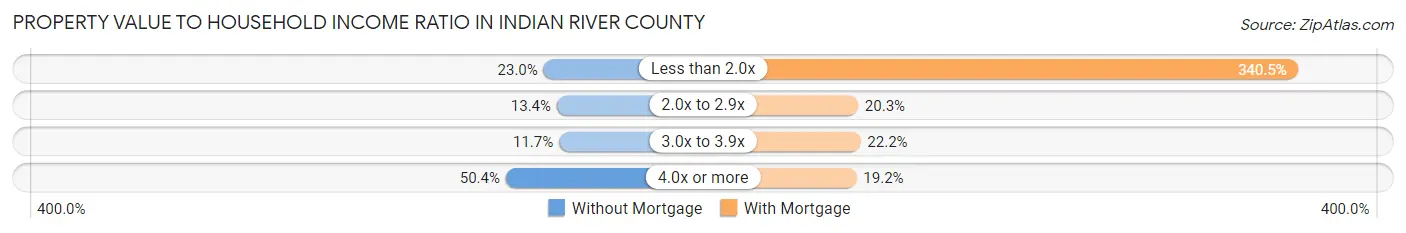
| Value-to-Income Ratio | Without Mortgage | With Mortgage |
| Less than 2.0x | 6,412 (23.0%) | 84,388 (340.5%) |
| 2.0x to 2.9x | 3,729 (13.4%) | 5,037 (20.3%) |
| 3.0x to 3.9x | 3,279 (11.7%) | 5,491 (22.2%) |
| 4.0x or more | 14,084 (50.4%) | 4,769 (19.2%) |
| Total | 27,920 (100.0%) | 24,784 (100.0%) |
Real Estate Taxes by Mortgage Status in Indian River County
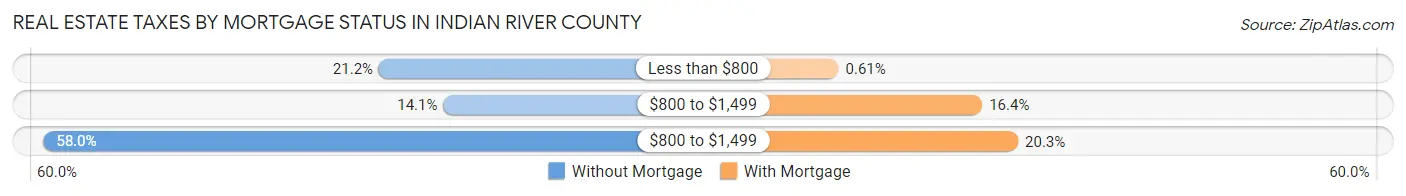
| Property Taxes | Without Mortgage | With Mortgage |
| Less than $800 | 5,910 (21.2%) | 150 (0.6%) |
| $800 to $1,499 | 3,943 (14.1%) | 4,052 (16.4%) |
| $800 to $1,499 | 16,181 (58.0%) | 5,027 (20.3%) |
| Total | 27,920 (100.0%) | 24,784 (100.0%) |
Health & Disability in Indian River County
Health Insurance Coverage by Age in Indian River County
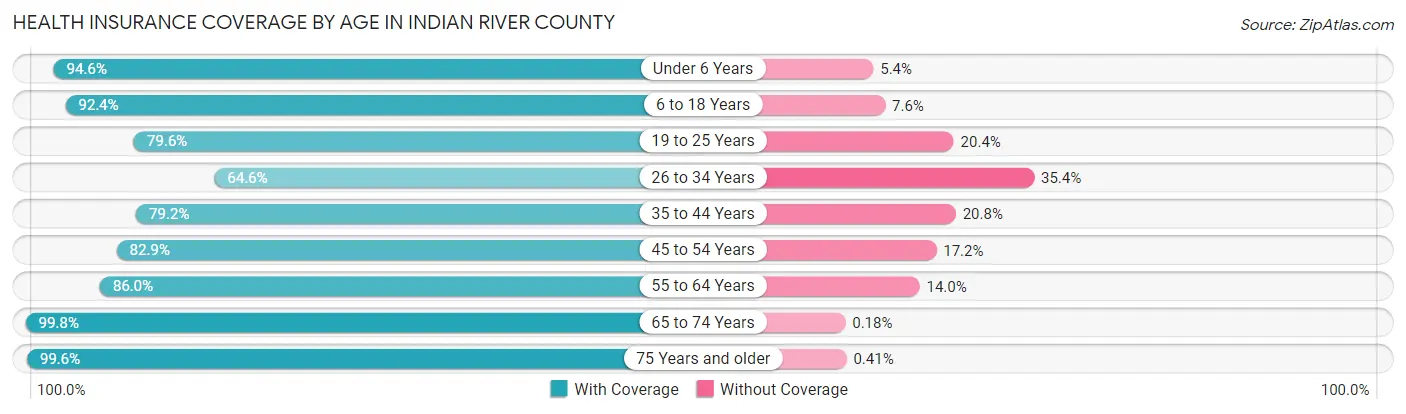
| Age Bracket | With Coverage | Without Coverage |
| Under 6 Years | 7,155 (94.6%) | 409 (5.4%) |
| 6 to 18 Years | 17,262 (92.4%) | 1,422 (7.6%) |
| 19 to 25 Years | 8,307 (79.6%) | 2,128 (20.4%) |
| 26 to 34 Years | 7,532 (64.6%) | 4,126 (35.4%) |
| 35 to 44 Years | 11,586 (79.2%) | 3,040 (20.8%) |
| 45 to 54 Years | 14,087 (82.9%) | 2,917 (17.2%) |
| 55 to 64 Years | 21,694 (86.0%) | 3,540 (14.0%) |
| 65 to 74 Years | 28,217 (99.8%) | 52 (0.2%) |
| 75 Years and older | 25,607 (99.6%) | 106 (0.4%) |
| Total | 141,447 (88.9%) | 17,740 (11.1%) |
Health Insurance Coverage by Citizenship Status in Indian River County
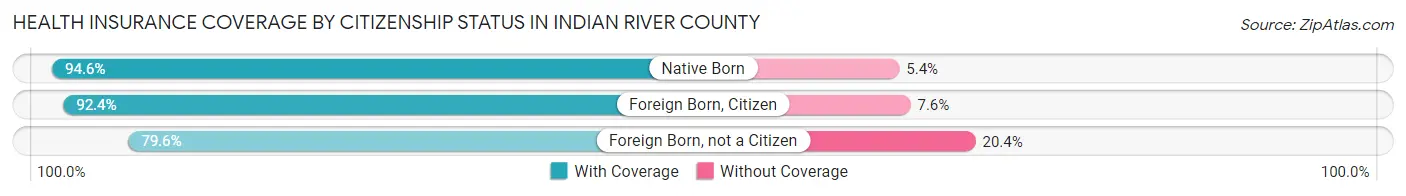
| Citizenship Status | With Coverage | Without Coverage |
| Native Born | 7,155 (94.6%) | 409 (5.4%) |
| Foreign Born, Citizen | 17,262 (92.4%) | 1,422 (7.6%) |
| Foreign Born, not a Citizen | 8,307 (79.6%) | 2,128 (20.4%) |
Health Insurance Coverage by Household Income in Indian River County
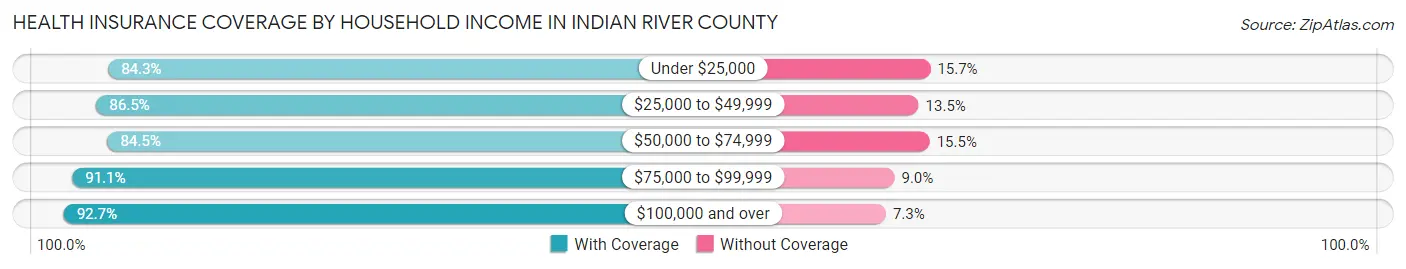
| Household Income | With Coverage | Without Coverage |
| Under $25,000 | 15,140 (84.3%) | 2,813 (15.7%) |
| $25,000 to $49,999 | 24,686 (86.5%) | 3,839 (13.5%) |
| $50,000 to $74,999 | 24,509 (84.5%) | 4,511 (15.5%) |
| $75,000 to $99,999 | 21,040 (91.0%) | 2,069 (8.9%) |
| $100,000 and over | 55,738 (92.7%) | 4,416 (7.3%) |
Public vs Private Health Insurance Coverage by Age in Indian River County
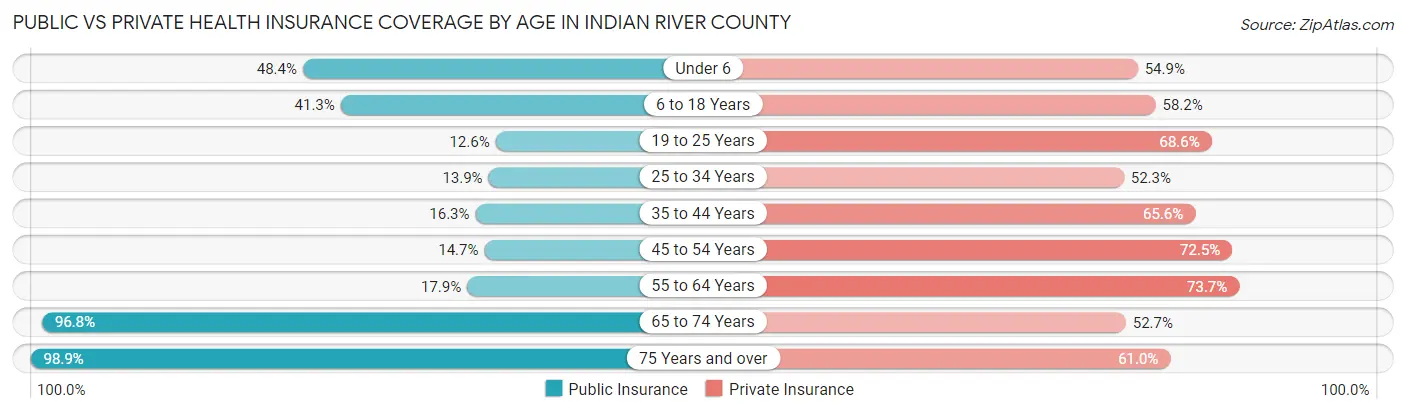
| Age Bracket | Public Insurance | Private Insurance |
| Under 6 | 3,658 (48.4%) | 4,155 (54.9%) |
| 6 to 18 Years | 7,724 (41.3%) | 10,881 (58.2%) |
| 19 to 25 Years | 1,315 (12.6%) | 7,161 (68.6%) |
| 25 to 34 Years | 1,621 (13.9%) | 6,102 (52.3%) |
| 35 to 44 Years | 2,388 (16.3%) | 9,590 (65.6%) |
| 45 to 54 Years | 2,495 (14.7%) | 12,319 (72.5%) |
| 55 to 64 Years | 4,510 (17.9%) | 18,607 (73.7%) |
| 65 to 74 Years | 27,363 (96.8%) | 14,904 (52.7%) |
| 75 Years and over | 25,433 (98.9%) | 15,671 (61.0%) |
| Total | 76,507 (48.1%) | 99,390 (62.4%) |
Disability Status by Sex by Age in Indian River County
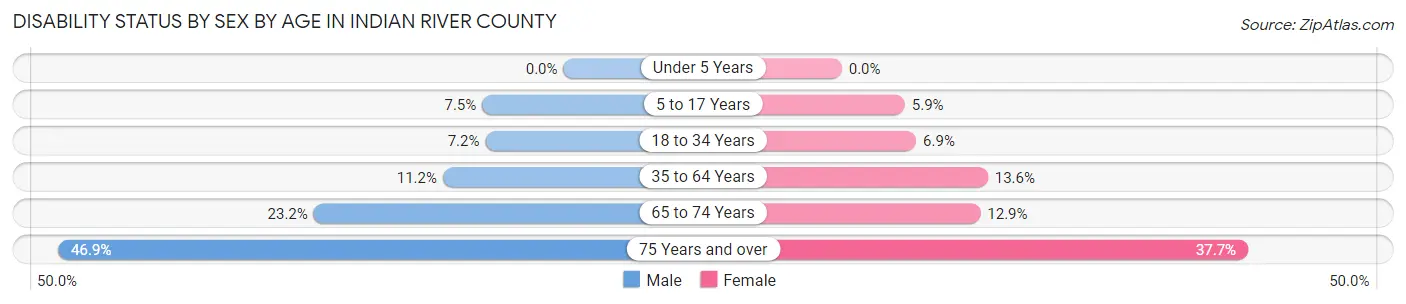
| Age Bracket | Male | Female |
| Under 5 Years | 0 (0.0%) | 0 (0.0%) |
| 5 to 17 Years | 736 (7.5%) | 504 (5.9%) |
| 18 to 34 Years | 885 (7.2%) | 795 (6.9%) |
| 35 to 64 Years | 2,996 (11.2%) | 4,077 (13.6%) |
| 65 to 74 Years | 3,057 (23.2%) | 1,939 (12.9%) |
| 75 Years and over | 5,548 (46.9%) | 5,232 (37.7%) |
Disability Class by Sex by Age in Indian River County
Disability Class: Hearing Difficulty
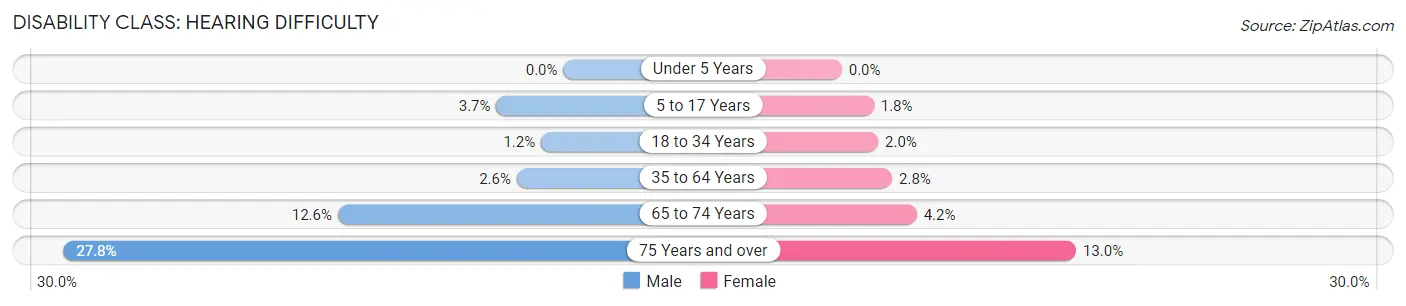
| Age Bracket | Male | Female |
| Under 5 Years | 0 (0.0%) | 0 (0.0%) |
| 5 to 17 Years | 364 (3.7%) | 153 (1.8%) |
| 18 to 34 Years | 151 (1.2%) | 233 (2.0%) |
| 35 to 64 Years | 692 (2.6%) | 843 (2.8%) |
| 65 to 74 Years | 1,657 (12.6%) | 629 (4.2%) |
| 75 Years and over | 3,294 (27.8%) | 1,811 (13.0%) |
Disability Class: Vision Difficulty
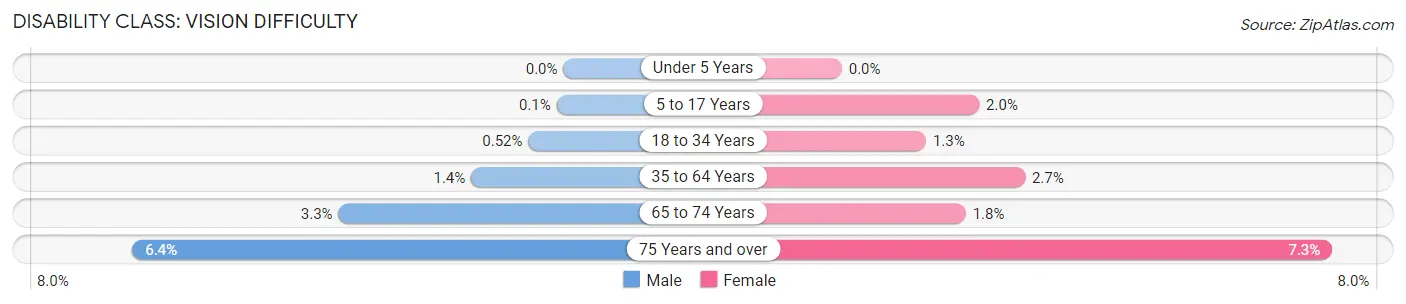
| Age Bracket | Male | Female |
| Under 5 Years | 0 (0.0%) | 0 (0.0%) |
| 5 to 17 Years | 10 (0.1%) | 176 (2.0%) |
| 18 to 34 Years | 64 (0.5%) | 144 (1.3%) |
| 35 to 64 Years | 367 (1.4%) | 820 (2.7%) |
| 65 to 74 Years | 441 (3.3%) | 278 (1.8%) |
| 75 Years and over | 757 (6.4%) | 1,010 (7.3%) |
Disability Class: Cognitive Difficulty
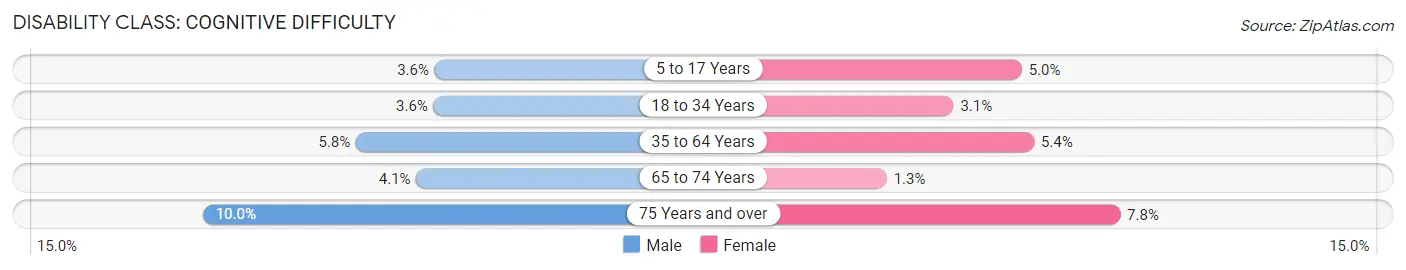
| Age Bracket | Male | Female |
| 5 to 17 Years | 350 (3.6%) | 432 (5.0%) |
| 18 to 34 Years | 441 (3.6%) | 359 (3.1%) |
| 35 to 64 Years | 1,544 (5.8%) | 1,610 (5.3%) |
| 65 to 74 Years | 539 (4.1%) | 188 (1.3%) |
| 75 Years and over | 1,188 (10.0%) | 1,076 (7.7%) |
Disability Class: Ambulatory Difficulty
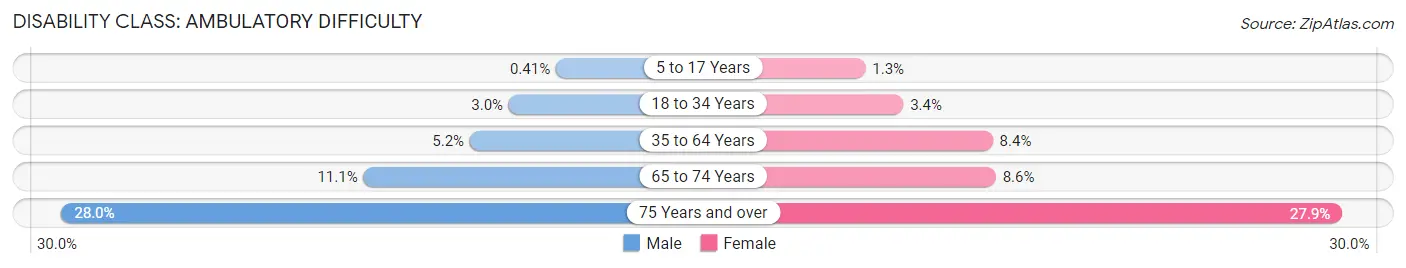
| Age Bracket | Male | Female |
| 5 to 17 Years | 40 (0.4%) | 113 (1.3%) |
| 18 to 34 Years | 370 (3.0%) | 394 (3.4%) |
| 35 to 64 Years | 1,391 (5.2%) | 2,528 (8.4%) |
| 65 to 74 Years | 1,468 (11.1%) | 1,292 (8.6%) |
| 75 Years and over | 3,306 (28.0%) | 3,868 (27.9%) |
Disability Class: Self-Care Difficulty
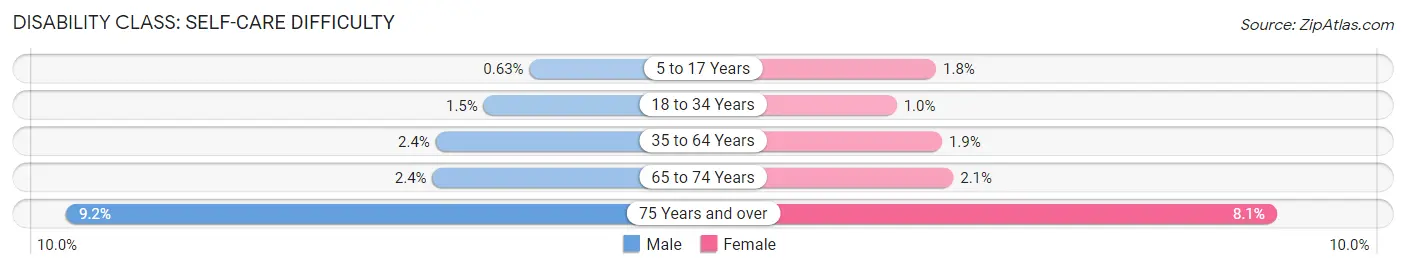
| Age Bracket | Male | Female |
| 5 to 17 Years | 62 (0.6%) | 151 (1.8%) |
| 18 to 34 Years | 181 (1.5%) | 118 (1.0%) |
| 35 to 64 Years | 635 (2.4%) | 561 (1.9%) |
| 65 to 74 Years | 321 (2.4%) | 312 (2.1%) |
| 75 Years and over | 1,092 (9.2%) | 1,121 (8.1%) |
Technology Access in Indian River County
Computing Device Access in Indian River County
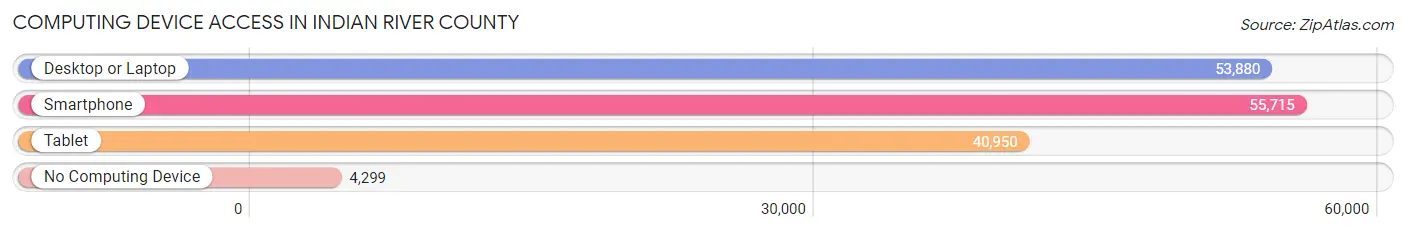
| Device Type | # Households | % Households |
| Desktop or Laptop | 53,880 | 82.0% |
| Smartphone | 55,715 | 84.8% |
| Tablet | 40,950 | 62.3% |
| No Computing Device | 4,299 | 6.5% |
| Total | 65,735 | 100.0% |
Internet Access in Indian River County
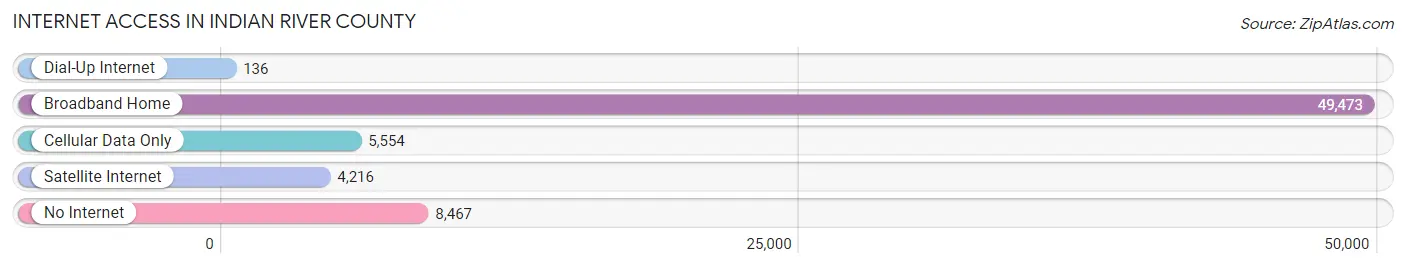
| Internet Type | # Households | % Households |
| Dial-Up Internet | 136 | 0.2% |
| Broadband Home | 49,473 | 75.3% |
| Cellular Data Only | 5,554 | 8.5% |
| Satellite Internet | 4,216 | 6.4% |
| No Internet | 8,467 | 12.9% |
| Total | 65,735 | 100.0% |
Indian River County Summary
Introduction
Located in the Treasure Coast region of Florida, Indian River County is a coastal county with a population of approximately 150,000 people. It is bordered by St. Lucie County to the north, Martin County to the south, and Brevard County to the east. The county seat is Vero Beach, and the county is home to several small towns and cities, including Sebastian, Fellsmere, and Orchid. Indian River County is known for its beautiful beaches, lush landscapes, and abundant wildlife.
History
The area that is now Indian River County was originally inhabited by the Ais Indians, a tribe of the Seminole Nation. The Ais were known for their fishing and hunting skills, and they lived in the area for centuries before the arrival of European settlers. The first Europeans to settle in the area were Spanish explorers, who arrived in the late 1500s. The area was later claimed by the British, and in 1821, it became part of the United States.
In 1855, the area was divided into four counties, including St. Lucie County, which included the area that is now Indian River County. In 1925, Indian River County was officially established, and the county seat was moved to Vero Beach.
Geography
Indian River County is located on the east coast of Florida, and it is bordered by St. Lucie County to the north, Martin County to the south, and Brevard County to the east. The county is approximately 645 square miles in size, and it is home to several small towns and cities, including Vero Beach, Sebastian, Fellsmere, and Orchid.
The county is known for its beautiful beaches, lush landscapes, and abundant wildlife. The Indian River Lagoon, which runs along the eastern coast of the county, is home to a variety of fish, birds, and other wildlife. The county is also home to several state parks, including Sebastian Inlet State Park and the St. Sebastian River State Park.
Economy
Indian River County has a diverse economy, with a variety of industries providing employment opportunities. The county is home to several large employers, including the Indian River Medical Center, the Indian River County School District, and the Indian River County Sheriff’s Office. The county is also home to several manufacturing companies, including the Vero Beach-based Piper Aircraft Corporation.
The county’s economy is also supported by tourism, with visitors coming to the area to enjoy the beaches, fishing, and other outdoor activities. The county is also home to several golf courses, and it is a popular destination for golfers.
Demographics
As of the 2010 census, the population of Indian River County was 138,028. The population is predominantly white (83.3%), with African Americans making up 8.3% of the population, Hispanics making up 6.2%, and Asians making up 1.7%. The median household income in the county is $50,867, and the median home value is $179,000.
Conclusion
Indian River County is a coastal county located in the Treasure Coast region of Florida. It is home to several small towns and cities, including Vero Beach, Sebastian, Fellsmere, and Orchid. The county is known for its beautiful beaches, lush landscapes, and abundant wildlife. The county has a diverse economy, with a variety of industries providing employment opportunities. The population of the county is predominantly white, with African Americans, Hispanics, and Asians making up smaller portions of the population.
Common Questions
What is Per Capita Income in Indian River County?
Per Capita income in Indian River County is $44,102.
What is the Median Family Income in Indian River County?
Median Family Income in Indian River County is $81,181.
What is the Median Household income in Indian River County?
Median Household Income in Indian River County is $67,543.
What is Income or Wage Gap in Indian River County?
Income or Wage Gap in Indian River County is 24.6%.
Women in Indian River County earn 75.4 cents for every dollar earned by a man.
What is Family Income Deficit in Indian River County?
Family Income Deficit in Indian River County is $11,747.
Families that are below poverty line in Indian River County earn $11,747 less on average than the poverty threshold level.
What is Inequality or Gini Index in Indian River County?
Inequality or Gini Index in Indian River County is 0.51.
What is the Total Population of Indian River County?
Total Population of Indian River County is 160,986.
What is the Total Male Population of Indian River County?
Total Male Population of Indian River County is 78,378.
What is the Total Female Population of Indian River County?
Total Female Population of Indian River County is 82,608.
What is the Ratio of Males per 100 Females in Indian River County?
There are 94.88 Males per 100 Females in Indian River County.
What is the Ratio of Females per 100 Males in Indian River County?
There are 105.40 Females per 100 Males in Indian River County.
What is the Median Population Age in Indian River County?
Median Population Age in Indian River County is 54.8 Years.
What is the Average Family Size in Indian River County
Average Family Size in Indian River County is 3.0 People.
What is the Average Household Size in Indian River County
Average Household Size in Indian River County is 2.4 People.
How Large is the Labor Force in Indian River County?
There are 67,655 People in the Labor Forcein in Indian River County.
What is the Percentage of People in the Labor Force in Indian River County?
48.5% of People are in the Labor Force in Indian River County.
What is the Unemployment Rate in Indian River County?
Unemployment Rate in Indian River County is 5.9%.