Brooksville, FL Map & Demographics
Brooksville Map
Brooksville Overview
$32,758
PER CAPITA INCOME
$52,024
AVG FAMILY INCOME
$42,047
AVG HOUSEHOLD INCOME
23.7%
WAGE / INCOME GAP [ % ]
76.3¢/ $1
WAGE / INCOME GAP [ $ ]
$7,997
FAMILY INCOME DEFICIT
0.51
INEQUALITY / GINI INDEX
8,981
TOTAL POPULATION
3,977
MALE POPULATION
5,004
FEMALE POPULATION
79.48
MALES / 100 FEMALES
125.82
FEMALES / 100 MALES
52.3
MEDIAN AGE
2.6
AVG FAMILY SIZE
2.0
AVG HOUSEHOLD SIZE
3,421
LABOR FORCE [ PEOPLE ]
44.3%
PERCENT IN LABOR FORCE
4.4%
UNEMPLOYMENT RATE
Income in Brooksville
Income Overview in Brooksville
Per Capita Income in Brooksville is $32,758, while median incomes of families and households are $52,024 and $42,047 respectively.
| Characteristic | Number | Measure |
| Per Capita Income | 8,981 | $32,758 |
| Median Family Income | 2,296 | $52,024 |
| Mean Family Income | 2,296 | $65,800 |
| Median Household Income | 4,249 | $42,047 |
| Mean Household Income | 4,249 | $65,658 |
| Income Deficit | 2,296 | $7,997 |
| Wage / Income Gap (%) | 8,981 | 23.70% |
| Wage / Income Gap ($) | 8,981 | 76.30¢ per $1 |
| Gini / Inequality Index | 8,981 | 0.51 |
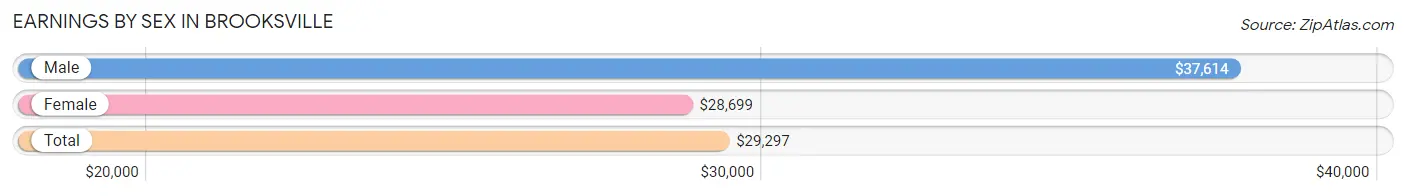
Earnings by Sex in Brooksville
Average Earnings in Brooksville are $29,297, $37,614 for men and $28,699 for women, a difference of 23.7%.
| Sex | Number | Average Earnings |
| Male | 1,578 (42.3%) | $37,614 |
| Female | 2,149 (57.7%) | $28,699 |
| Total | 3,727 (100.0%) | $29,297 |
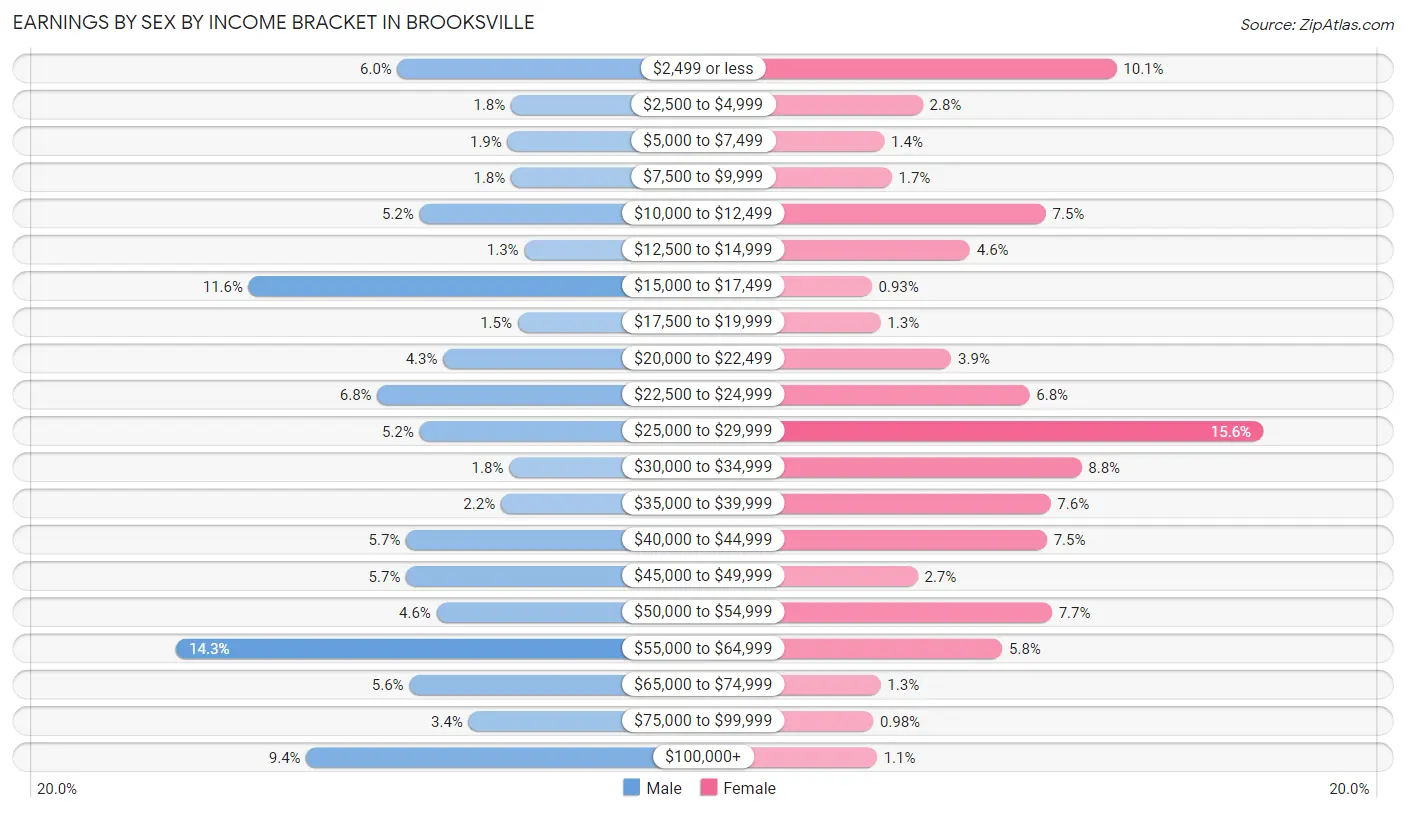
Earnings by Sex by Income Bracket in Brooksville
The most common earnings brackets in Brooksville are $55,000 to $64,999 for men (226 | 14.3%) and $25,000 to $29,999 for women (335 | 15.6%).
| Income | Male | Female |
| $2,499 or less | 95 (6.0%) | 217 (10.1%) |
| $2,500 to $4,999 | 28 (1.8%) | 61 (2.8%) |
| $5,000 to $7,499 | 30 (1.9%) | 30 (1.4%) |
| $7,500 to $9,999 | 28 (1.8%) | 36 (1.7%) |
| $10,000 to $12,499 | 82 (5.2%) | 160 (7.4%) |
| $12,500 to $14,999 | 20 (1.3%) | 99 (4.6%) |
| $15,000 to $17,499 | 183 (11.6%) | 20 (0.9%) |
| $17,500 to $19,999 | 24 (1.5%) | 27 (1.3%) |
| $20,000 to $22,499 | 68 (4.3%) | 84 (3.9%) |
| $22,500 to $24,999 | 107 (6.8%) | 147 (6.8%) |
| $25,000 to $29,999 | 82 (5.2%) | 335 (15.6%) |
| $30,000 to $34,999 | 29 (1.8%) | 189 (8.8%) |
| $35,000 to $39,999 | 34 (2.1%) | 164 (7.6%) |
| $40,000 to $44,999 | 90 (5.7%) | 161 (7.5%) |
| $45,000 to $49,999 | 90 (5.7%) | 57 (2.6%) |
| $50,000 to $54,999 | 72 (4.6%) | 165 (7.7%) |
| $55,000 to $64,999 | 226 (14.3%) | 125 (5.8%) |
| $65,000 to $74,999 | 88 (5.6%) | 27 (1.3%) |
| $75,000 to $99,999 | 53 (3.4%) | 21 (1.0%) |
| $100,000+ | 149 (9.4%) | 24 (1.1%) |
| Total | 1,578 (100.0%) | 2,149 (100.0%) |
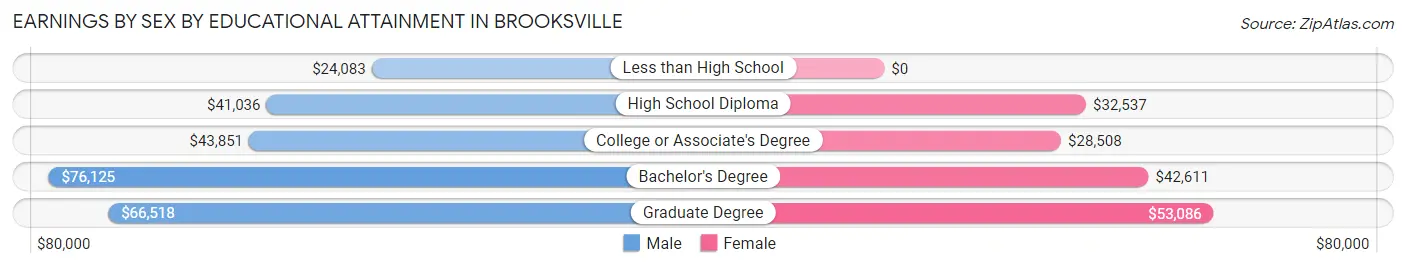
Earnings by Sex by Educational Attainment in Brooksville
Average earnings in Brooksville are $46,528 for men and $31,701 for women, a difference of 31.9%. Men with an educational attainment of bachelor's degree enjoy the highest average annual earnings of $76,125, while those with less than high school education earn the least with $24,083. Women with an educational attainment of graduate degree earn the most with the average annual earnings of $53,086, while those with college or associate's degree education have the smallest earnings of $28,508.
| Educational Attainment | Male Income | Female Income |
| Less than High School | $24,083 | $0 |
| High School Diploma | $41,036 | $32,537 |
| College or Associate's Degree | $43,851 | $28,508 |
| Bachelor's Degree | $76,125 | $42,611 |
| Graduate Degree | $66,518 | $53,086 |
| Total | $46,528 | $31,701 |
Family Income in Brooksville
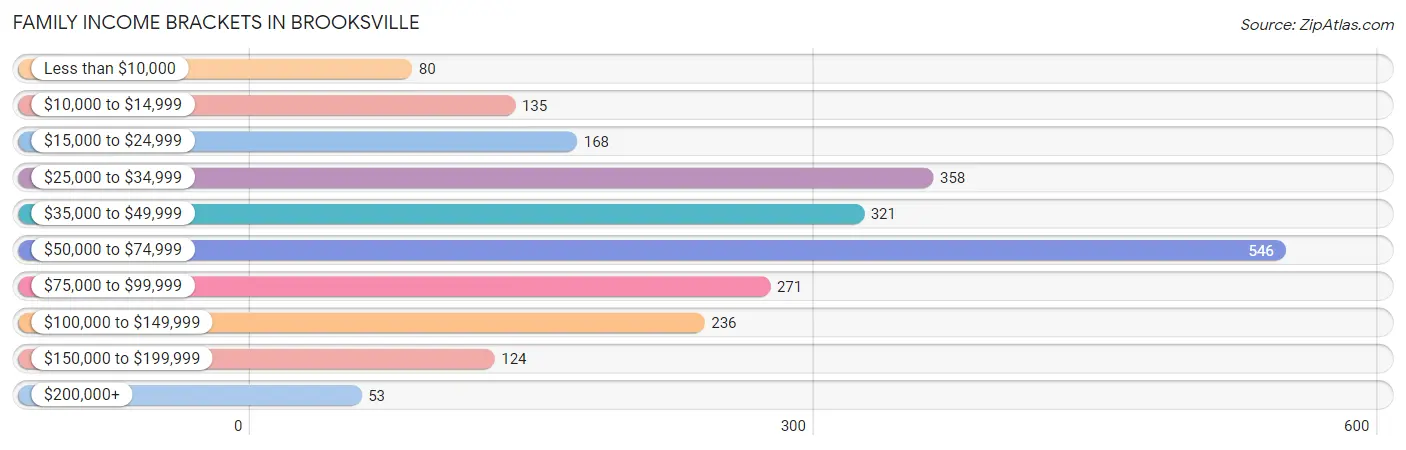
Family Income Brackets in Brooksville
According to the Brooksville family income data, there are 546 families falling into the $50,000 to $74,999 income range, which is the most common income bracket and makes up 23.8% of all families. Conversely, the $200,000+ income bracket is the least frequent group with only 53 families (2.3%) belonging to this category.
| Income Bracket | # Families | % Families |
| Less than $10,000 | 80 | 3.5% |
| $10,000 to $14,999 | 135 | 5.9% |
| $15,000 to $24,999 | 168 | 7.3% |
| $25,000 to $34,999 | 358 | 15.6% |
| $35,000 to $49,999 | 321 | 14.0% |
| $50,000 to $74,999 | 546 | 23.8% |
| $75,000 to $99,999 | 271 | 11.8% |
| $100,000 to $149,999 | 236 | 10.3% |
| $150,000 to $199,999 | 124 | 5.4% |
| $200,000+ | 53 | 2.3% |
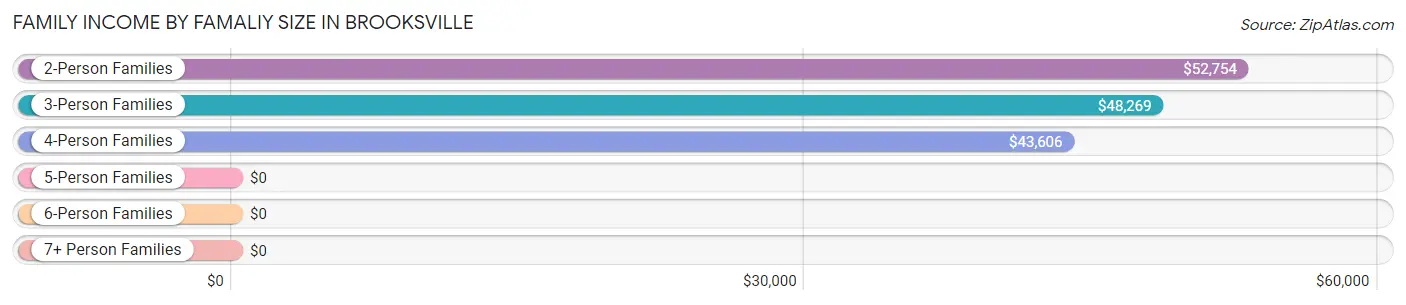
Family Income by Famaliy Size in Brooksville
2-person families (1,523 | 66.3%) account for the highest median family income in Brooksville with $52,754 per family, while 2-person families (1,523 | 66.3%) have the highest median income of $26,377 per family member.
| Income Bracket | # Families | Median Income |
| 2-Person Families | 1,523 (66.3%) | $52,754 |
| 3-Person Families | 440 (19.2%) | $48,269 |
| 4-Person Families | 279 (12.1%) | $43,606 |
| 5-Person Families | 45 (2.0%) | $0 |
| 6-Person Families | 9 (0.4%) | $0 |
| 7+ Person Families | 0 (0.0%) | $0 |
| Total | 2,296 (100.0%) | $52,024 |
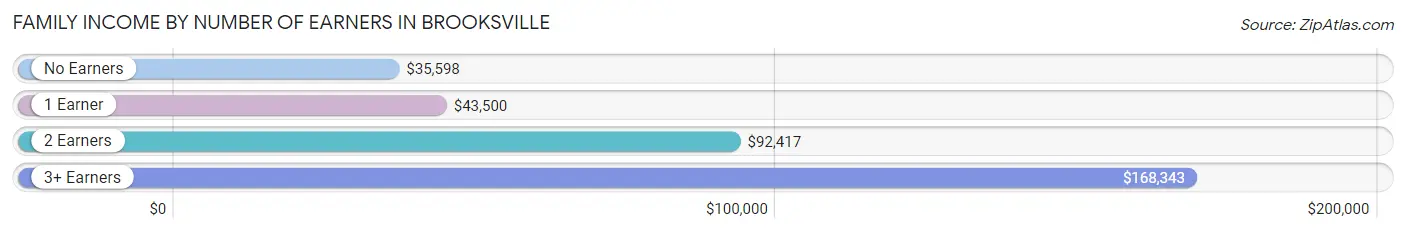
Family Income by Number of Earners in Brooksville
The median family income in Brooksville is $52,024, with families comprising 3+ earners (57) having the highest median family income of $168,343, while families with no earners (585) have the lowest median family income of $35,598, accounting for 2.5% and 25.5% of families, respectively.
| Number of Earners | # Families | Median Income |
| No Earners | 585 (25.5%) | $35,598 |
| 1 Earner | 1,158 (50.4%) | $43,500 |
| 2 Earners | 496 (21.6%) | $92,417 |
| 3+ Earners | 57 (2.5%) | $168,343 |
| Total | 2,296 (100.0%) | $52,024 |
Household Income in Brooksville
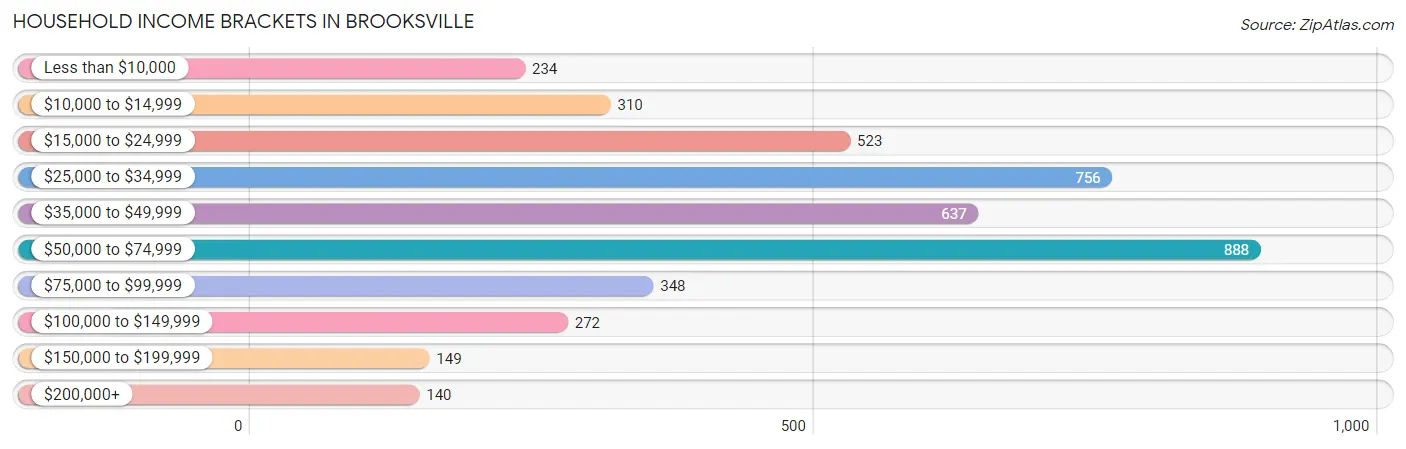
Household Income Brackets in Brooksville
With 888 households falling in the category, the $50,000 to $74,999 income range is the most frequent in Brooksville, accounting for 20.9% of all households. In contrast, only 140 households (3.3%) fall into the $200,000+ income bracket, making it the least populous group.
| Income Bracket | # Households | % Households |
| Less than $10,000 | 234 | 5.5% |
| $10,000 to $14,999 | 310 | 7.3% |
| $15,000 to $24,999 | 523 | 12.3% |
| $25,000 to $34,999 | 756 | 17.8% |
| $35,000 to $49,999 | 637 | 15.0% |
| $50,000 to $74,999 | 888 | 20.9% |
| $75,000 to $99,999 | 348 | 8.2% |
| $100,000 to $149,999 | 272 | 6.4% |
| $150,000 to $199,999 | 149 | 3.5% |
| $200,000+ | 140 | 3.3% |
Household Income by Householder Age in Brooksville
The median household income in Brooksville is $42,047, with the highest median household income of $53,387 found in the 25 to 44 years age bracket for the primary householder. A total of 1,039 households (24.4%) fall into this category. Meanwhile, the 45 to 64 years age bracket for the primary householder has the lowest median household income of $31,696, with 1,217 households (28.6%) in this group.
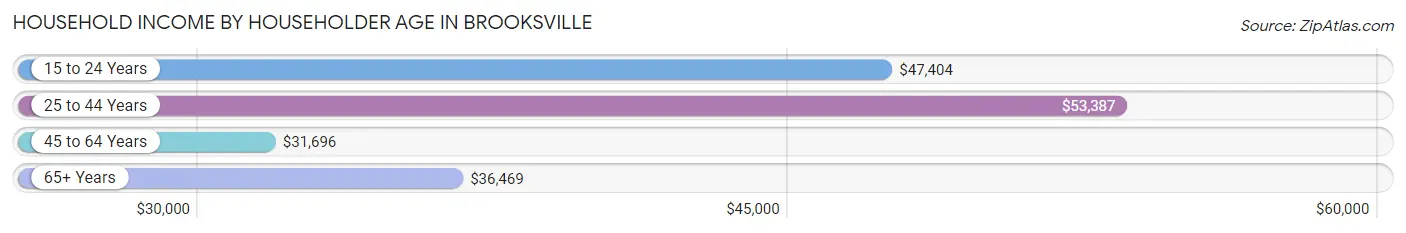
| Income Bracket | # Households | Median Income |
| 15 to 24 Years | 165 (3.9%) | $47,404 |
| 25 to 44 Years | 1,039 (24.4%) | $53,387 |
| 45 to 64 Years | 1,217 (28.6%) | $31,696 |
| 65+ Years | 1,828 (43.0%) | $36,469 |
| Total | 4,249 (100.0%) | $42,047 |
Poverty in Brooksville
Income Below Poverty by Sex and Age in Brooksville
With 13.7% poverty level for males and 25.0% for females among the residents of Brooksville, 16 and 17 year old males and under 5 year old females are the most vulnerable to poverty, with 46 males (80.7%) and 69 females (31.1%) in their respective age groups living below the poverty level.
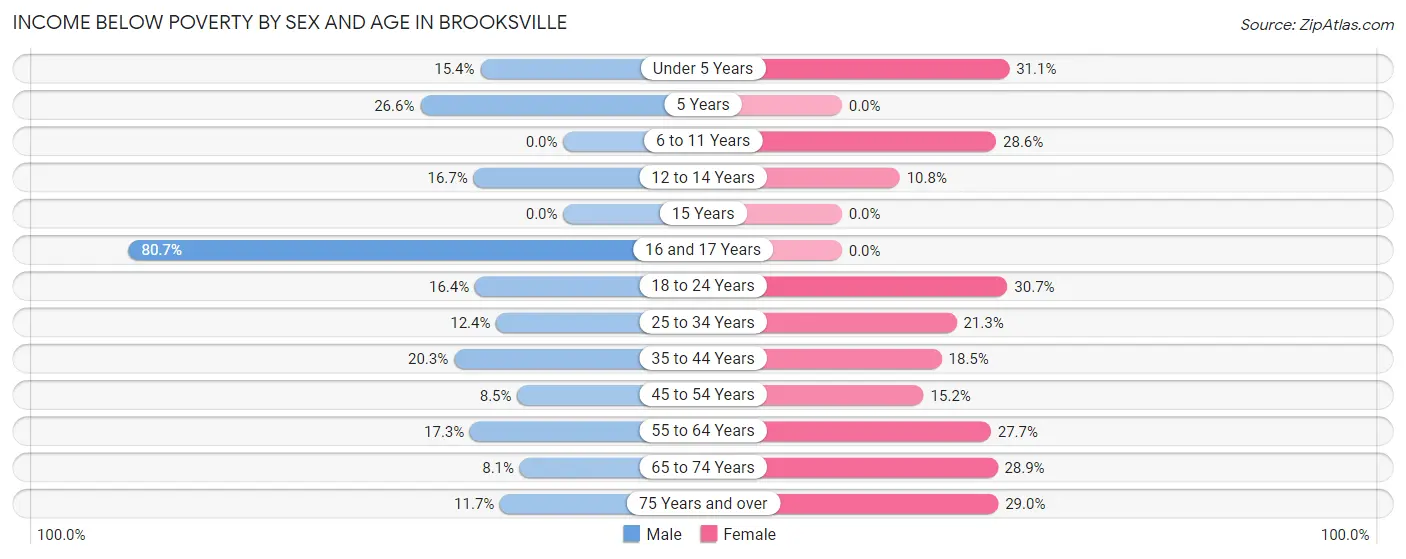
| Age Bracket | Male | Female |
| Under 5 Years | 35 (15.4%) | 69 (31.1%) |
| 5 Years | 17 (26.6%) | 0 (0.0%) |
| 6 to 11 Years | 0 (0.0%) | 59 (28.6%) |
| 12 to 14 Years | 28 (16.7%) | 10 (10.7%) |
| 15 Years | 0 (0.0%) | 0 (0.0%) |
| 16 and 17 Years | 46 (80.7%) | 0 (0.0%) |
| 18 to 24 Years | 59 (16.4%) | 162 (30.7%) |
| 25 to 34 Years | 52 (12.4%) | 139 (21.3%) |
| 35 to 44 Years | 56 (20.3%) | 78 (18.5%) |
| 45 to 54 Years | 27 (8.5%) | 65 (15.2%) |
| 55 to 64 Years | 99 (17.3%) | 226 (27.7%) |
| 65 to 74 Years | 53 (8.1%) | 210 (28.9%) |
| 75 Years and over | 55 (11.7%) | 196 (29.0%) |
| Total | 527 (13.7%) | 1,214 (25.0%) |
Income Above Poverty by Sex and Age in Brooksville
According to the poverty statistics in Brooksville, males aged 6 to 11 years and females aged 15 years are the age groups that are most secure financially, with 100.0% of males and 100.0% of females in these age groups living above the poverty line.
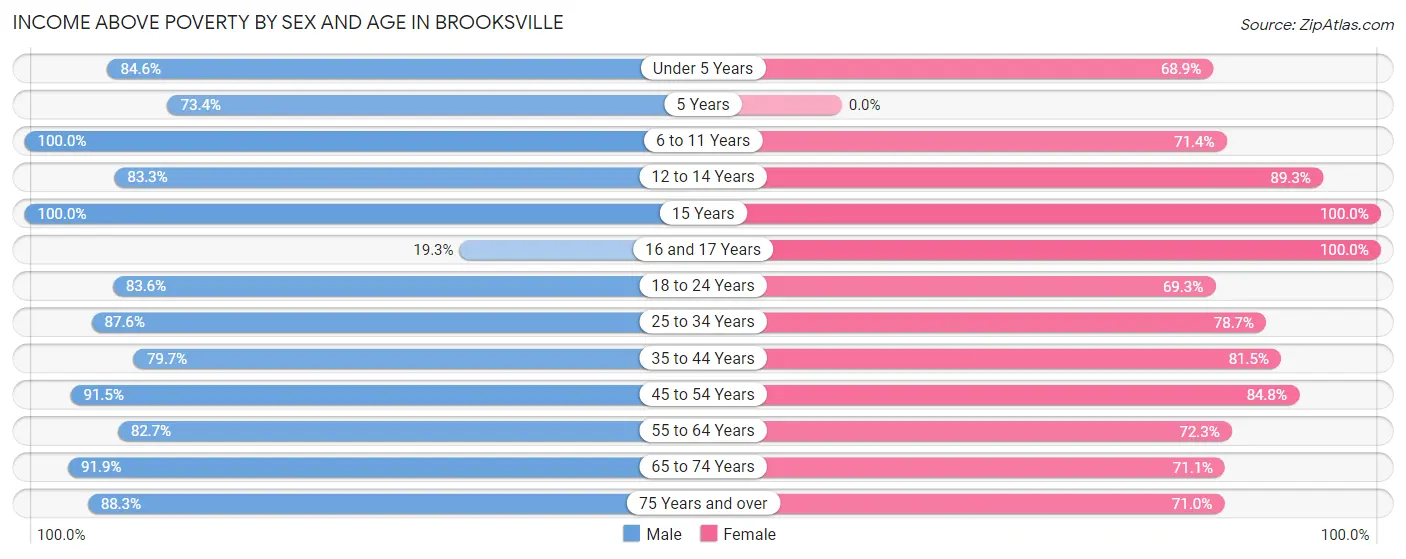
| Age Bracket | Male | Female |
| Under 5 Years | 192 (84.6%) | 153 (68.9%) |
| 5 Years | 47 (73.4%) | 0 (0.0%) |
| 6 to 11 Years | 199 (100.0%) | 147 (71.4%) |
| 12 to 14 Years | 140 (83.3%) | 83 (89.2%) |
| 15 Years | 60 (100.0%) | 10 (100.0%) |
| 16 and 17 Years | 11 (19.3%) | 83 (100.0%) |
| 18 to 24 Years | 301 (83.6%) | 365 (69.3%) |
| 25 to 34 Years | 366 (87.6%) | 514 (78.7%) |
| 35 to 44 Years | 220 (79.7%) | 343 (81.5%) |
| 45 to 54 Years | 289 (91.5%) | 363 (84.8%) |
| 55 to 64 Years | 473 (82.7%) | 591 (72.3%) |
| 65 to 74 Years | 604 (91.9%) | 517 (71.1%) |
| 75 Years and over | 414 (88.3%) | 479 (71.0%) |
| Total | 3,316 (86.3%) | 3,648 (75.0%) |
Income Below Poverty Among Married-Couple Families in Brooksville
The poverty statistics for married-couple families in Brooksville show that 10.6% or 154 of the total 1,447 families live below the poverty line. Families with no children have the highest poverty rate of 12.8%, comprising of 154 families. On the other hand, families with 1 or 2 children have the lowest poverty rate of 0.0%, which includes 0 families.
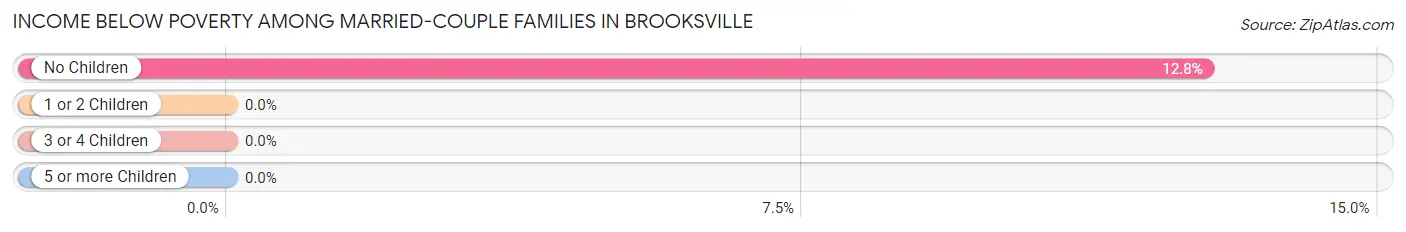
| Children | Above Poverty | Below Poverty |
| No Children | 1,054 (87.3%) | 154 (12.8%) |
| 1 or 2 Children | 194 (100.0%) | 0 (0.0%) |
| 3 or 4 Children | 45 (100.0%) | 0 (0.0%) |
| 5 or more Children | 0 (0.0%) | 0 (0.0%) |
| Total | 1,293 (89.4%) | 154 (10.6%) |
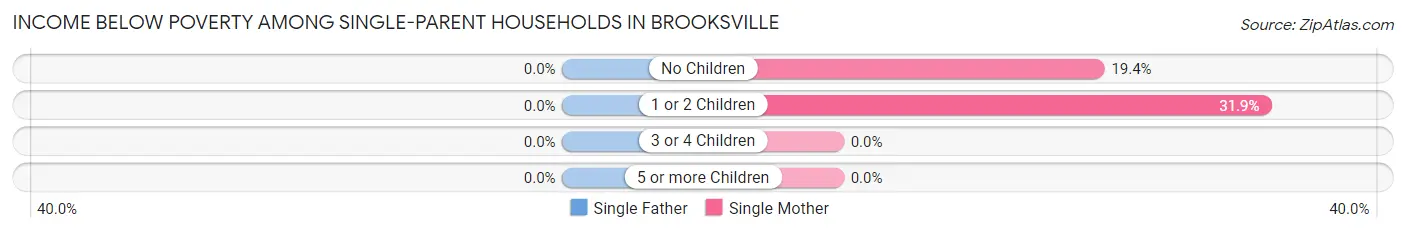
Income Below Poverty Among Single-Parent Households in Brooksville
| Children | Single Father | Single Mother |
| No Children | 0 (0.0%) | 34 (19.4%) |
| 1 or 2 Children | 0 (0.0%) | 130 (31.9%) |
| 3 or 4 Children | 0 (0.0%) | 0 (0.0%) |
| 5 or more Children | 0 (0.0%) | 0 (0.0%) |
| Total | 0 (0.0%) | 164 (25.4%) |
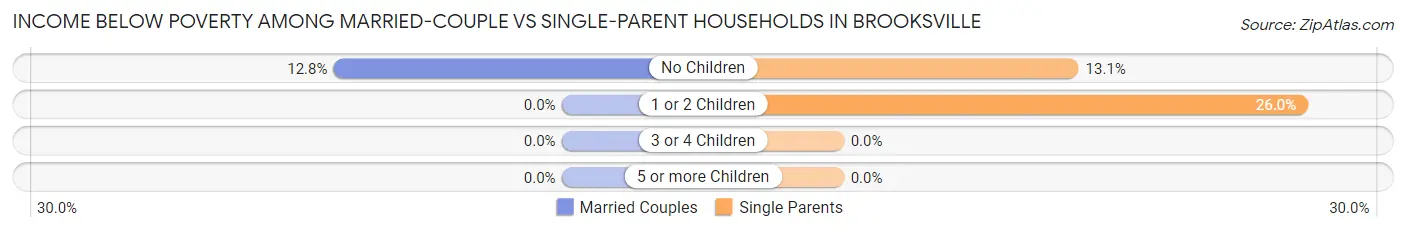
Income Below Poverty Among Married-Couple vs Single-Parent Households in Brooksville
The poverty data for Brooksville shows that 154 of the married-couple family households (10.6%) and 164 of the single-parent households (19.3%) are living below the poverty level. Within the married-couple family households, those with no children have the highest poverty rate, with 154 households (12.8%) falling below the poverty line. Among the single-parent households, those with 1 or 2 children have the highest poverty rate, with 130 household (26.0%) living below poverty.
| Children | Married-Couple Families | Single-Parent Households |
| No Children | 154 (12.8%) | 34 (13.1%) |
| 1 or 2 Children | 0 (0.0%) | 130 (26.0%) |
| 3 or 4 Children | 0 (0.0%) | 0 (0.0%) |
| 5 or more Children | 0 (0.0%) | 0 (0.0%) |
| Total | 154 (10.6%) | 164 (19.3%) |
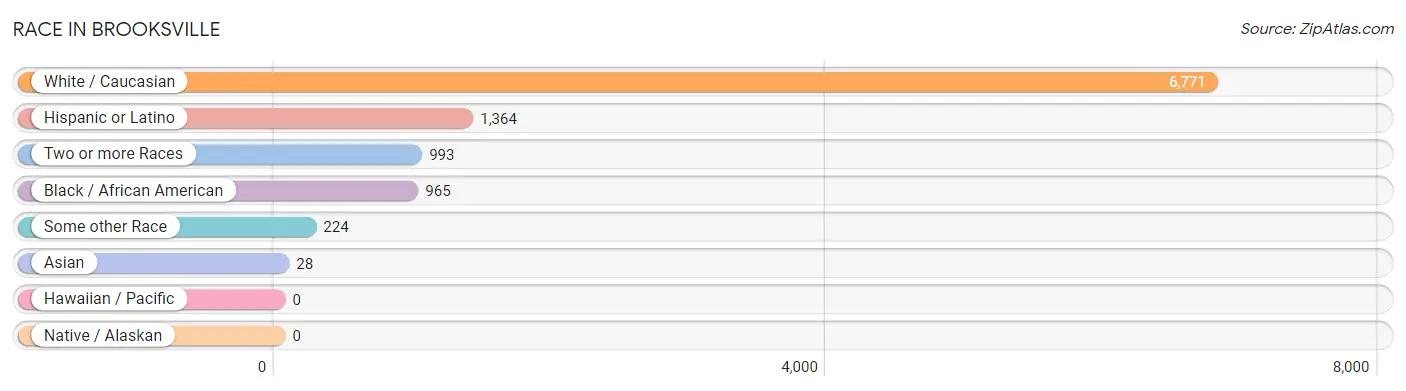
Race in Brooksville
The most populous races in Brooksville are White / Caucasian (6,771 | 75.4%), Hispanic or Latino (1,364 | 15.2%), and Two or more Races (993 | 11.1%).
| Race | # Population | % Population |
| Asian | 28 | 0.3% |
| Black / African American | 965 | 10.7% |
| Hawaiian / Pacific | 0 | 0.0% |
| Hispanic or Latino | 1,364 | 15.2% |
| Native / Alaskan | 0 | 0.0% |
| White / Caucasian | 6,771 | 75.4% |
| Two or more Races | 993 | 11.1% |
| Some other Race | 224 | 2.5% |
| Total | 8,981 | 100.0% |
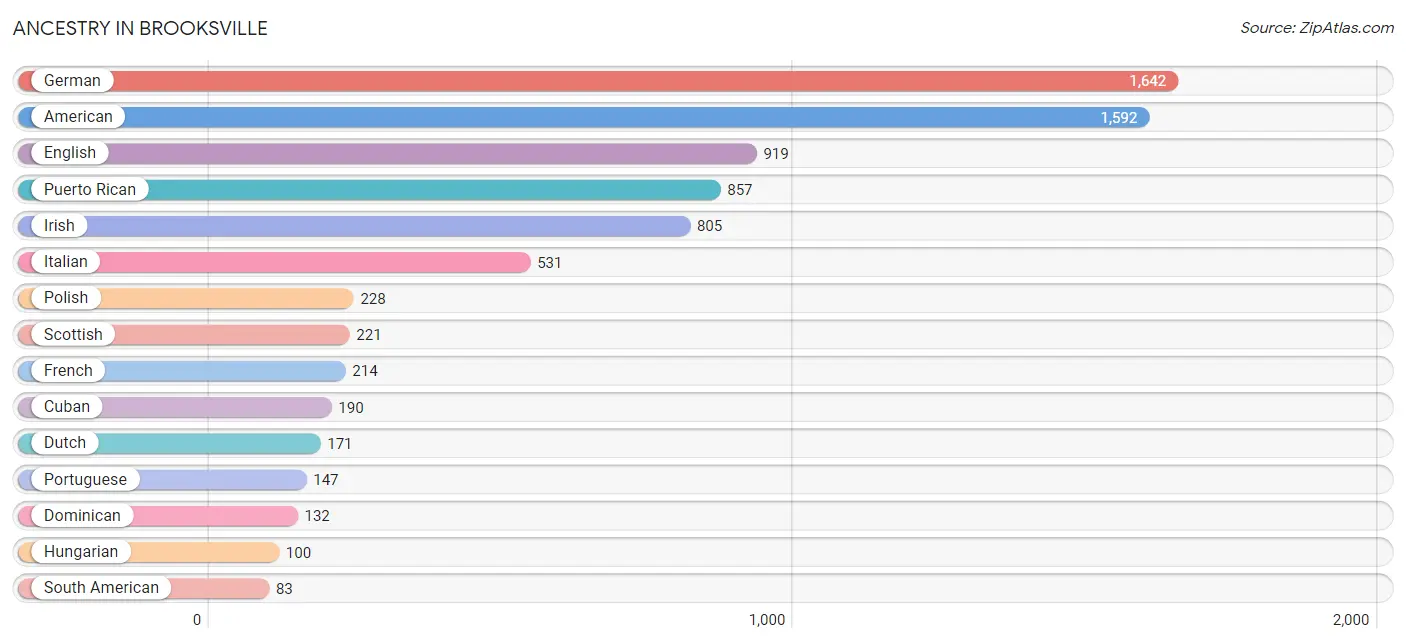
Ancestry in Brooksville
The most populous ancestries reported in Brooksville are German (1,642 | 18.3%), American (1,592 | 17.7%), English (919 | 10.2%), Puerto Rican (857 | 9.5%), and Irish (805 | 9.0%), together accounting for 64.7% of all Brooksville residents.
| Ancestry | # Population | % Population |
| American | 1,592 | 17.7% |
| Arab | 6 | 0.1% |
| Argentinean | 9 | 0.1% |
| Austrian | 18 | 0.2% |
| Bhutanese | 6 | 0.1% |
| British | 58 | 0.6% |
| Canadian | 27 | 0.3% |
| Cape Verdean | 23 | 0.3% |
| Cherokee | 6 | 0.1% |
| Colombian | 46 | 0.5% |
| Cuban | 190 | 2.1% |
| Czech | 8 | 0.1% |
| Czechoslovakian | 7 | 0.1% |
| Danish | 24 | 0.3% |
| Dominican | 132 | 1.5% |
| Dutch | 171 | 1.9% |
| Eastern European | 10 | 0.1% |
| English | 919 | 10.2% |
| Ethiopian | 22 | 0.2% |
| European | 51 | 0.6% |
| French | 214 | 2.4% |
| French Canadian | 68 | 0.8% |
| German | 1,642 | 18.3% |
| Hungarian | 100 | 1.1% |
| Irish | 805 | 9.0% |
| Italian | 531 | 5.9% |
| Jamaican | 72 | 0.8% |
| Lithuanian | 4 | 0.0% |
| Mexican | 53 | 0.6% |
| Native Hawaiian | 12 | 0.1% |
| Northern European | 23 | 0.3% |
| Ottawa | 62 | 0.7% |
| Pakistani | 21 | 0.2% |
| Polish | 228 | 2.5% |
| Portuguese | 147 | 1.6% |
| Puerto Rican | 857 | 9.5% |
| Russian | 71 | 0.8% |
| Scandinavian | 16 | 0.2% |
| Scotch-Irish | 52 | 0.6% |
| Scottish | 221 | 2.5% |
| South American | 83 | 0.9% |
| Spaniard | 36 | 0.4% |
| Spanish | 13 | 0.1% |
| Subsaharan African | 45 | 0.5% |
| Swedish | 44 | 0.5% |
| Thai | 28 | 0.3% |
| Ukrainian | 15 | 0.2% |
| Venezuelan | 28 | 0.3% |
| Welsh | 51 | 0.6% | View All 49 Rows |
Immigrants in Brooksville
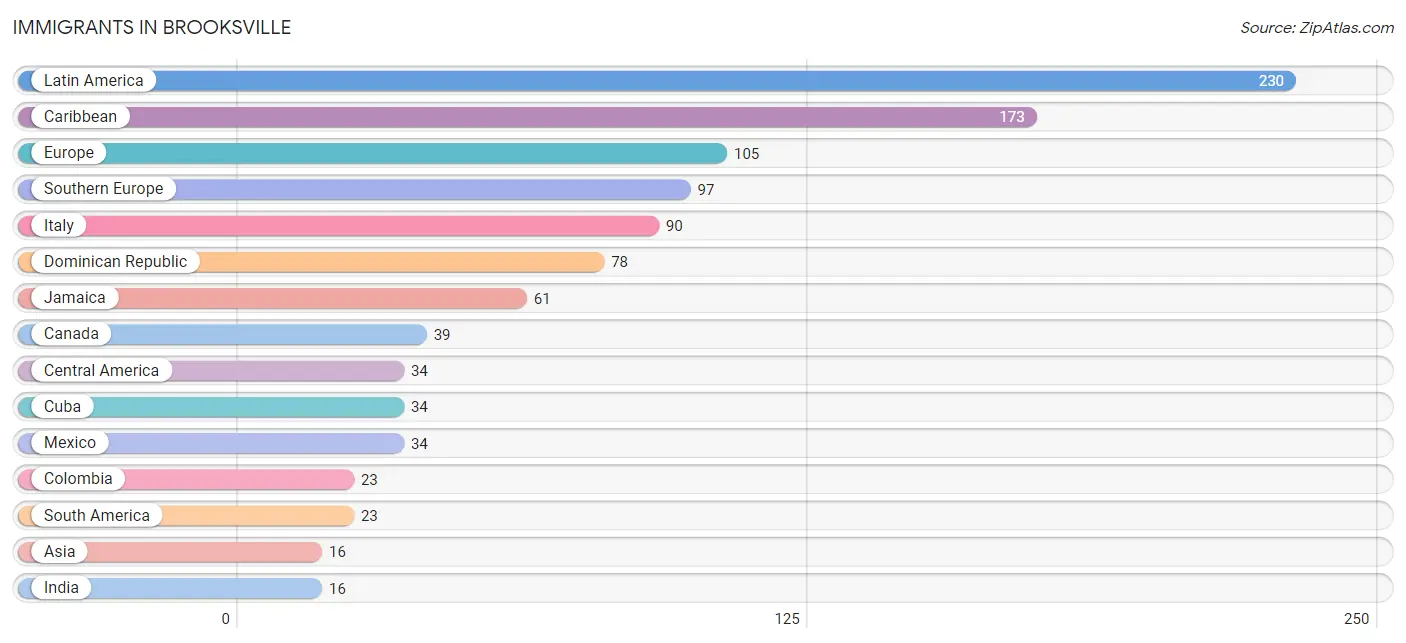
The most numerous immigrant groups reported in Brooksville came from Latin America (230 | 2.6%), Caribbean (173 | 1.9%), Europe (105 | 1.2%), Southern Europe (97 | 1.1%), and Italy (90 | 1.0%), together accounting for 7.7% of all Brooksville residents.
| Immigration Origin | # Population | % Population |
| Asia | 16 | 0.2% |
| Canada | 39 | 0.4% |
| Caribbean | 173 | 1.9% |
| Central America | 34 | 0.4% |
| Colombia | 23 | 0.3% |
| Cuba | 34 | 0.4% |
| Dominican Republic | 78 | 0.9% |
| Europe | 105 | 1.2% |
| France | 8 | 0.1% |
| India | 16 | 0.2% |
| Italy | 90 | 1.0% |
| Jamaica | 61 | 0.7% |
| Latin America | 230 | 2.6% |
| Mexico | 34 | 0.4% |
| Portugal | 7 | 0.1% |
| South America | 23 | 0.3% |
| South Central Asia | 16 | 0.2% |
| Southern Europe | 97 | 1.1% |
| Western Europe | 8 | 0.1% | View All 19 Rows |
Sex and Age in Brooksville
Sex and Age in Brooksville
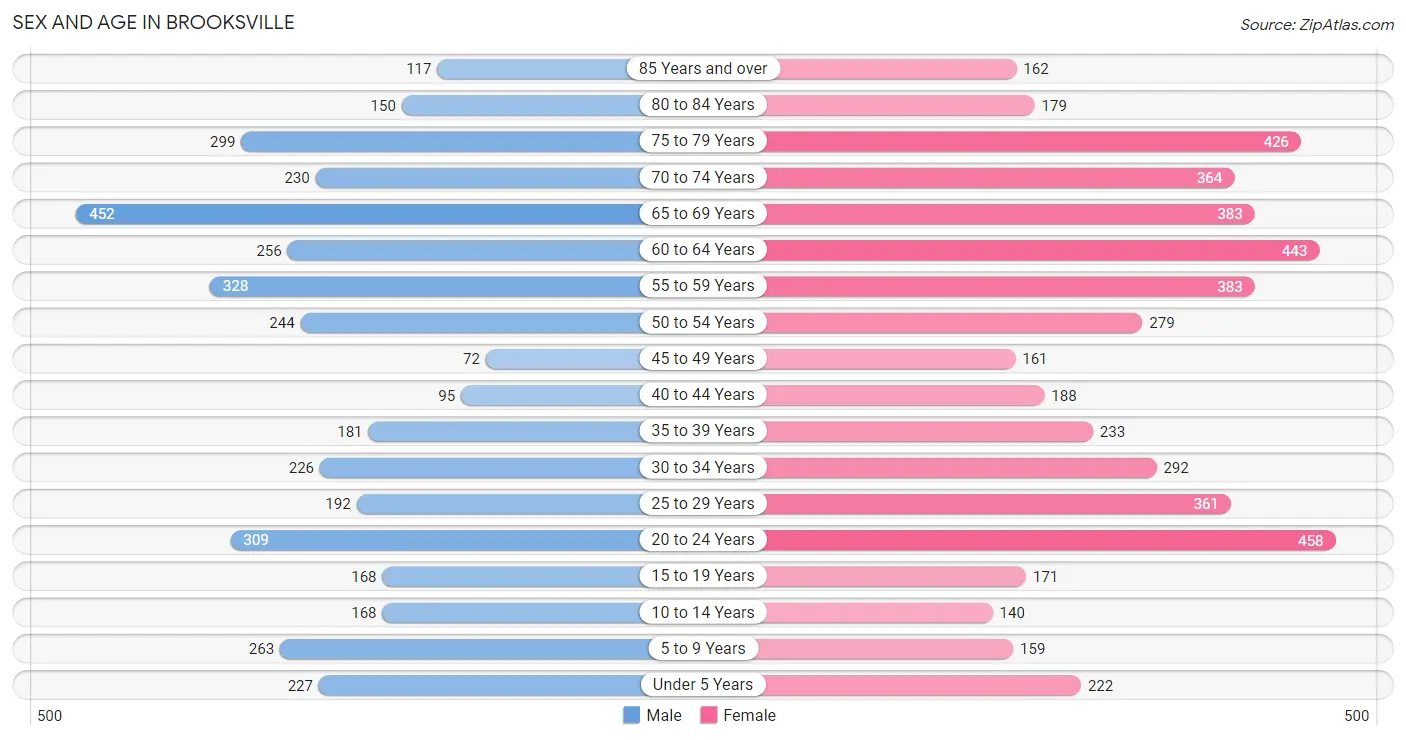
The most populous age groups in Brooksville are 65 to 69 Years (452 | 11.4%) for men and 20 to 24 Years (458 | 9.1%) for women.
| Age Bracket | Male | Female |
| Under 5 Years | 227 (5.7%) | 222 (4.4%) |
| 5 to 9 Years | 263 (6.6%) | 159 (3.2%) |
| 10 to 14 Years | 168 (4.2%) | 140 (2.8%) |
| 15 to 19 Years | 168 (4.2%) | 171 (3.4%) |
| 20 to 24 Years | 309 (7.8%) | 458 (9.1%) |
| 25 to 29 Years | 192 (4.8%) | 361 (7.2%) |
| 30 to 34 Years | 226 (5.7%) | 292 (5.8%) |
| 35 to 39 Years | 181 (4.5%) | 233 (4.7%) |
| 40 to 44 Years | 95 (2.4%) | 188 (3.8%) |
| 45 to 49 Years | 72 (1.8%) | 161 (3.2%) |
| 50 to 54 Years | 244 (6.1%) | 279 (5.6%) |
| 55 to 59 Years | 328 (8.3%) | 383 (7.6%) |
| 60 to 64 Years | 256 (6.4%) | 443 (8.8%) |
| 65 to 69 Years | 452 (11.4%) | 383 (7.6%) |
| 70 to 74 Years | 230 (5.8%) | 364 (7.3%) |
| 75 to 79 Years | 299 (7.5%) | 426 (8.5%) |
| 80 to 84 Years | 150 (3.8%) | 179 (3.6%) |
| 85 Years and over | 117 (2.9%) | 162 (3.2%) |
| Total | 3,977 (100.0%) | 5,004 (100.0%) |
Families and Households in Brooksville
Median Family Size in Brooksville
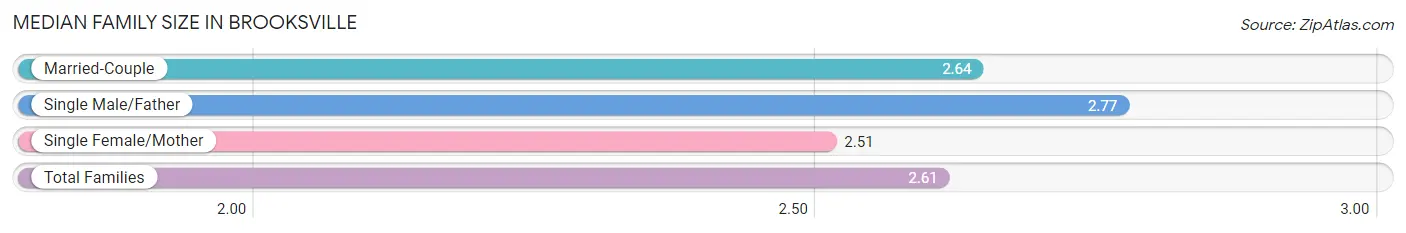
The median family size in Brooksville is 2.61 persons per family, with single male/father families (203 | 8.8%) accounting for the largest median family size of 2.77 persons per family. On the other hand, single female/mother families (646 | 28.1%) represent the smallest median family size with 2.51 persons per family.
| Family Type | # Families | Family Size |
| Married-Couple | 1,447 (63.0%) | 2.64 |
| Single Male/Father | 203 (8.8%) | 2.77 |
| Single Female/Mother | 646 (28.1%) | 2.51 |
| Total Families | 2,296 (100.0%) | 2.61 |
Median Household Size in Brooksville
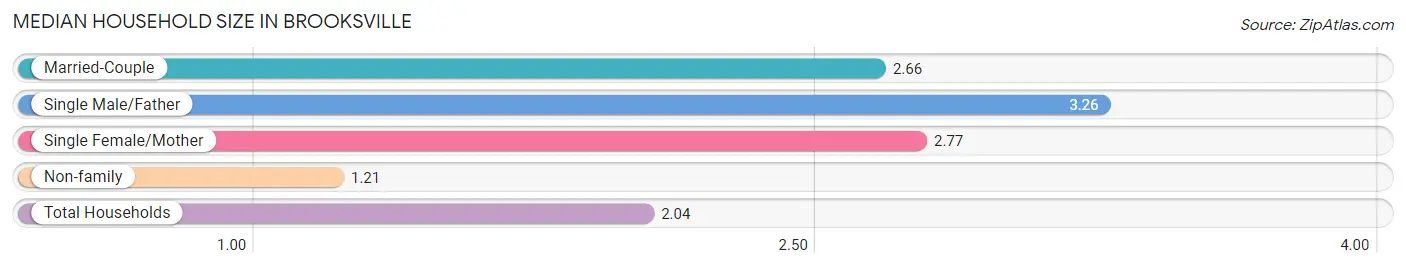
The median household size in Brooksville is 2.04 persons per household, with single male/father households (203 | 4.8%) accounting for the largest median household size of 3.26 persons per household. non-family households (1,953 | 46.0%) represent the smallest median household size with 1.21 persons per household.
| Household Type | # Households | Household Size |
| Married-Couple | 1,447 (34.1%) | 2.66 |
| Single Male/Father | 203 (4.8%) | 3.26 |
| Single Female/Mother | 646 (15.2%) | 2.77 |
| Non-family | 1,953 (46.0%) | 1.21 |
| Total Households | 4,249 (100.0%) | 2.04 |
Household Size by Marriage Status in Brooksville
Out of a total of 4,249 households in Brooksville, 2,296 (54.0%) are family households, while 1,953 (46.0%) are nonfamily households. The most numerous type of family households are 2-person households, comprising 1,460, and the most common type of nonfamily households are 1-person households, comprising 1,591.
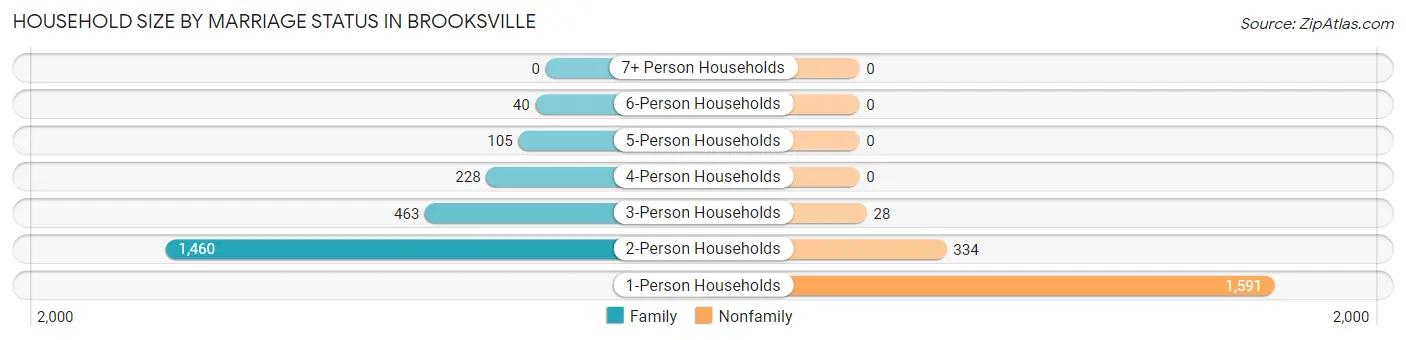
| Household Size | Family Households | Nonfamily Households |
| 1-Person Households | - | 1,591 (37.4%) |
| 2-Person Households | 1,460 (34.4%) | 334 (7.9%) |
| 3-Person Households | 463 (10.9%) | 28 (0.7%) |
| 4-Person Households | 228 (5.4%) | 0 (0.0%) |
| 5-Person Households | 105 (2.5%) | 0 (0.0%) |
| 6-Person Households | 40 (0.9%) | 0 (0.0%) |
| 7+ Person Households | 0 (0.0%) | 0 (0.0%) |
| Total | 2,296 (54.0%) | 1,953 (46.0%) |
Female Fertility in Brooksville
Fertility by Age in Brooksville
Average fertility rate in Brooksville is 64.0 births per 1,000 women. Women in the age bracket of 20 to 34 years have the highest fertility rate with 84.0 births per 1,000 women. Women in the age bracket of 20 to 34 years acount for 75.0% of all women with births.
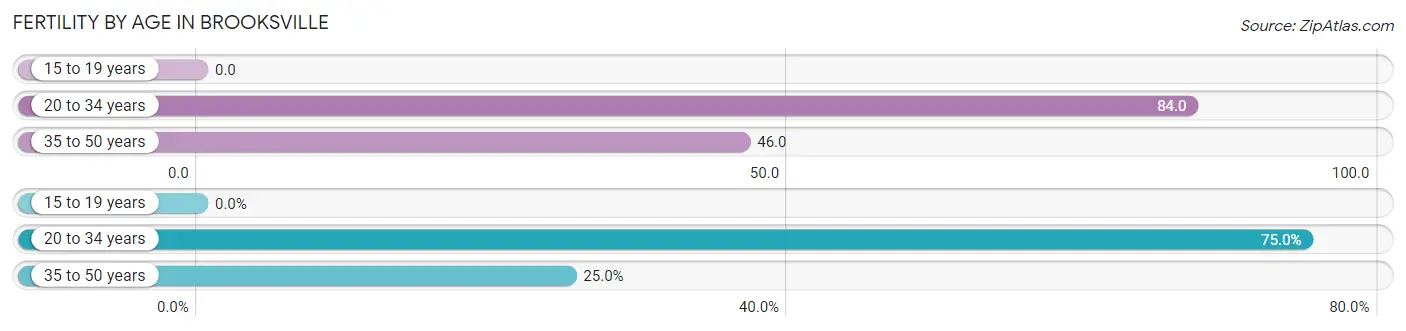
| Age Bracket | Women with Births | Births / 1,000 Women |
| 15 to 19 years | 0 (0.0%) | 0.0 |
| 20 to 34 years | 93 (75.0%) | 84.0 |
| 35 to 50 years | 31 (25.0%) | 46.0 |
| Total | 124 (100.0%) | 64.0 |
Fertility by Age by Marriage Status in Brooksville
34.7% of women with births (124) in Brooksville are married. The highest percentage of unmarried women with births falls into 20 to 34 years age bracket with 87.1% of them unmarried at the time of birth, while the lowest percentage of unmarried women with births belong to 35 to 50 years age bracket with 0.0% of them unmarried.
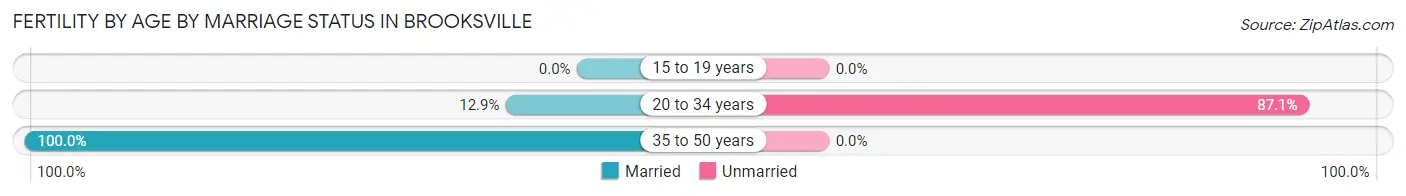
| Age Bracket | Married | Unmarried |
| 15 to 19 years | 0 (0.0%) | 0 (0.0%) |
| 20 to 34 years | 12 (12.9%) | 81 (87.1%) |
| 35 to 50 years | 31 (100.0%) | 0 (0.0%) |
| Total | 43 (34.7%) | 81 (65.3%) |
Fertility by Education in Brooksville
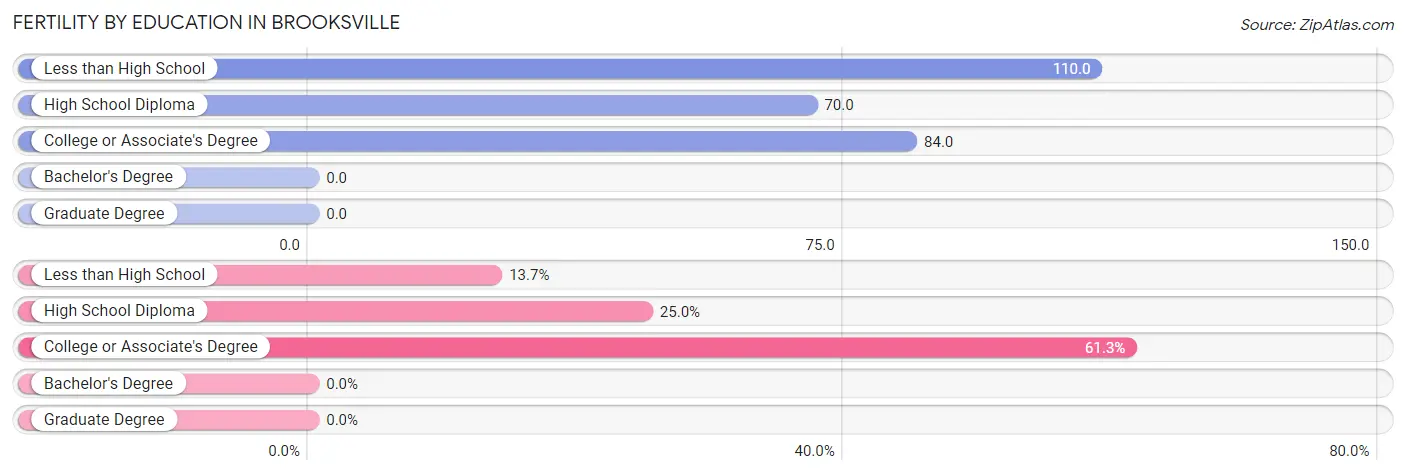
| Educational Attainment | Women with Births | Births / 1,000 Women |
| Less than High School | 17 (13.7%) | 110.0 |
| High School Diploma | 31 (25.0%) | 70.0 |
| College or Associate's Degree | 76 (61.3%) | 84.0 |
| Bachelor's Degree | 0 (0.0%) | 0.0 |
| Graduate Degree | 0 (0.0%) | 0.0 |
| Total | 124 (100.0%) | 64.0 |
Fertility by Education by Marriage Status in Brooksville
65.3% of women with births in Brooksville are unmarried. Women with the educational attainment of high school diploma are most likely to be married with 100.0% of them married at childbirth, while women with the educational attainment of college or associate's degree are least likely to be married with 100.0% of them unmarried at childbirth.
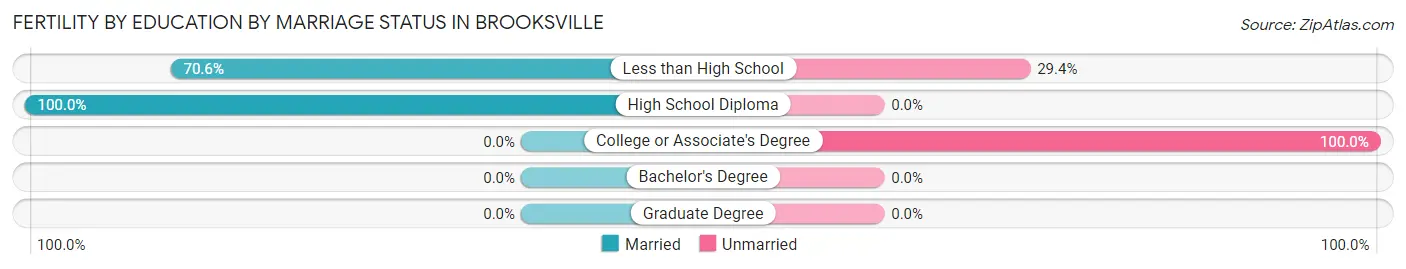
| Educational Attainment | Married | Unmarried |
| Less than High School | 12 (70.6%) | 5 (29.4%) |
| High School Diploma | 31 (100.0%) | 0 (0.0%) |
| College or Associate's Degree | 0 (0.0%) | 76 (100.0%) |
| Bachelor's Degree | 0 (0.0%) | 0 (0.0%) |
| Graduate Degree | 0 (0.0%) | 0 (0.0%) |
| Total | 43 (34.7%) | 81 (65.3%) |
Employment Characteristics in Brooksville
Employment by Class of Employer in Brooksville
Among the 3,214 employed individuals in Brooksville, private company employees (2,357 | 73.3%), not-for-profit organizations (274 | 8.5%), and local government employees (256 | 8.0%) make up the most common classes of employment.
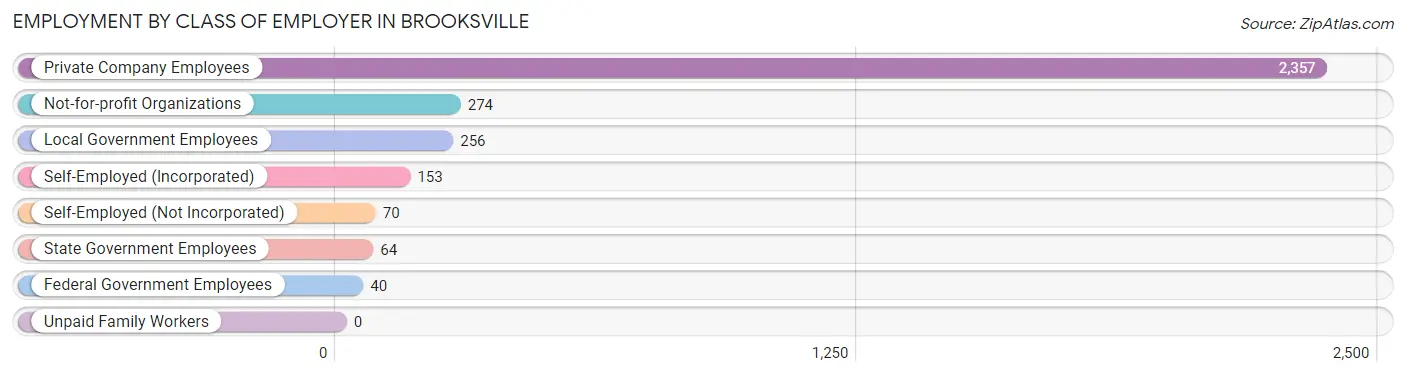
| Employer Class | # Employees | % Employees |
| Private Company Employees | 2,357 | 73.3% |
| Self-Employed (Incorporated) | 153 | 4.8% |
| Self-Employed (Not Incorporated) | 70 | 2.2% |
| Not-for-profit Organizations | 274 | 8.5% |
| Local Government Employees | 256 | 8.0% |
| State Government Employees | 64 | 2.0% |
| Federal Government Employees | 40 | 1.2% |
| Unpaid Family Workers | 0 | 0.0% |
| Total | 3,214 | 100.0% |
Employment Status by Age in Brooksville
According to the labor force statistics for Brooksville, out of the total population over 16 years of age (7,723), 44.3% or 3,421 individuals are in the labor force, with 4.4% or 151 of them unemployed. The age group with the highest labor force participation rate is 25 to 29 years, with 88.4% or 489 individuals in the labor force. Within the labor force, the 16 to 19 years age range has the highest percentage of unemployed individuals, with 9.1% or 11 of them being unemployed.
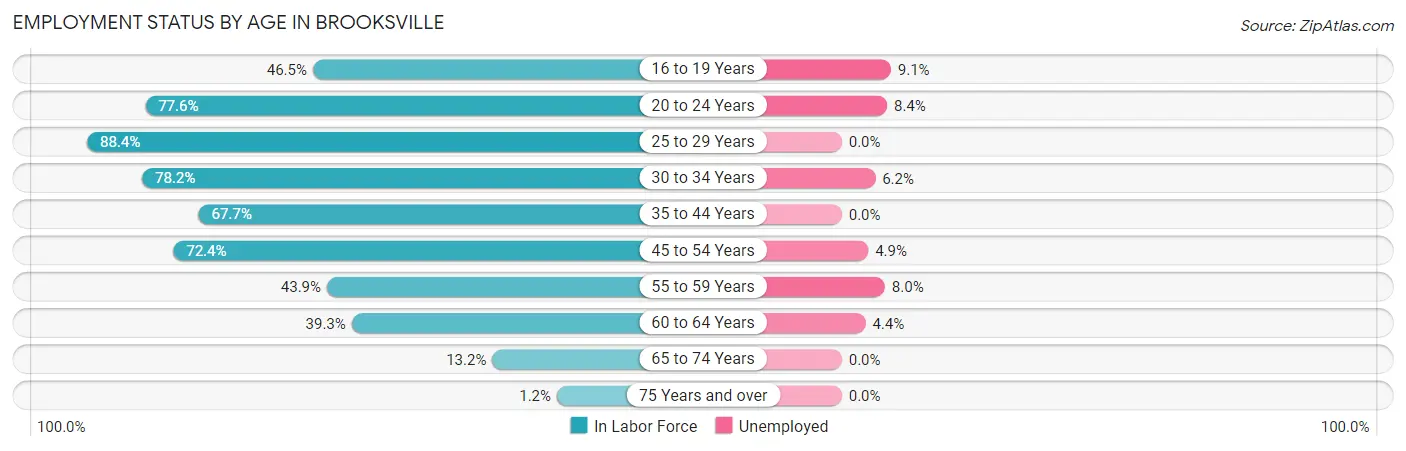
| Age Bracket | In Labor Force | Unemployed |
| 16 to 19 Years | 121 (46.5%) | 11 (9.1%) |
| 20 to 24 Years | 595 (77.6%) | 50 (8.4%) |
| 25 to 29 Years | 489 (88.4%) | 0 (0.0%) |
| 30 to 34 Years | 405 (78.2%) | 25 (6.2%) |
| 35 to 44 Years | 472 (67.7%) | 0 (0.0%) |
| 45 to 54 Years | 547 (72.4%) | 27 (4.9%) |
| 55 to 59 Years | 312 (43.9%) | 25 (8.0%) |
| 60 to 64 Years | 275 (39.3%) | 12 (4.4%) |
| 65 to 74 Years | 189 (13.2%) | 0 (0.0%) |
| 75 Years and over | 16 (1.2%) | 0 (0.0%) |
| Total | 3,421 (44.3%) | 151 (4.4%) |
Employment Status by Educational Attainment in Brooksville
According to labor force statistics for Brooksville, 63.5% of individuals (2,498) out of the total population between 25 and 64 years of age (3,934) are in the labor force, with 3.6% or 90 of them being unemployed. The group with the highest labor force participation rate are those with the educational attainment of bachelor's degree or higher, with 82.1% or 694 individuals in the labor force. Within the labor force, individuals with less than high school education have the highest percentage of unemployment, with 10.3% or 15 of them being unemployed.
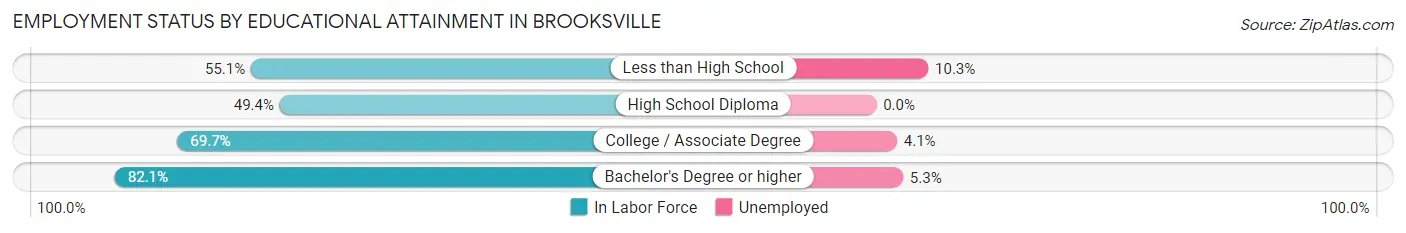
| Educational Attainment | In Labor Force | Unemployed |
| Less than High School | 146 (55.1%) | 27 (10.3%) |
| High School Diploma | 749 (49.4%) | 0 (0.0%) |
| College / Associate Degree | 911 (69.7%) | 54 (4.1%) |
| Bachelor's Degree or higher | 694 (82.1%) | 45 (5.3%) |
| Total | 2,498 (63.5%) | 142 (3.6%) |
Employment Occupations by Sex in Brooksville
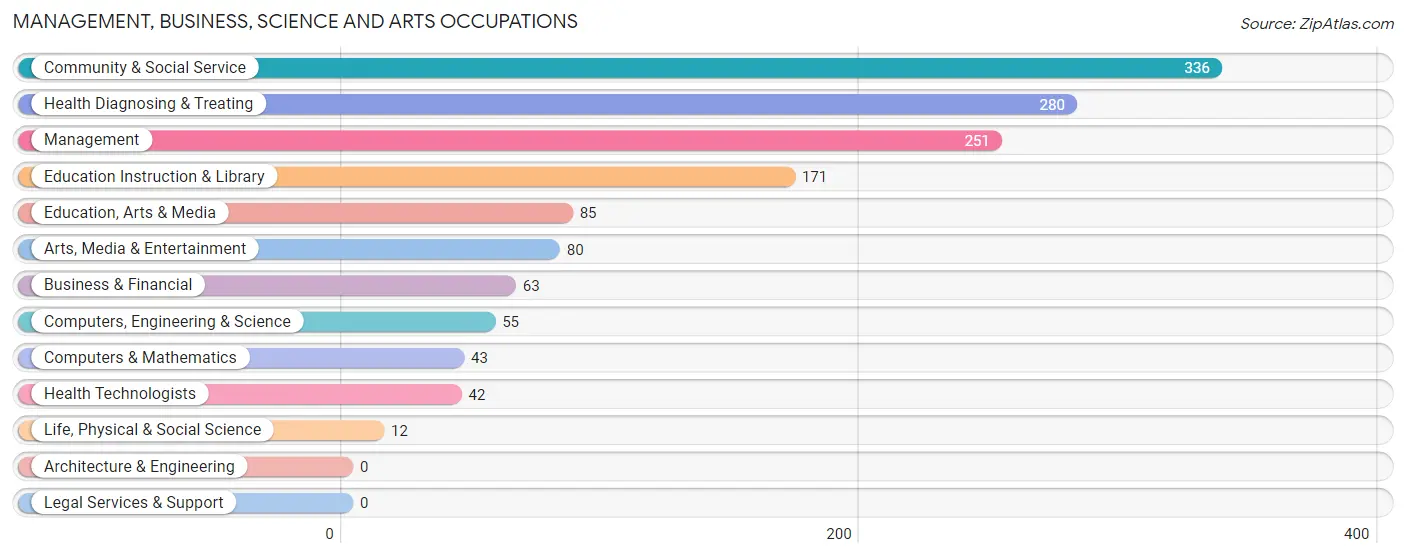
Management, Business, Science and Arts Occupations
The most common Management, Business, Science and Arts occupations in Brooksville are Community & Social Service (336 | 10.3%), Health Diagnosing & Treating (280 | 8.6%), Management (251 | 7.7%), Education Instruction & Library (171 | 5.2%), and Education, Arts & Media (85 | 2.6%).
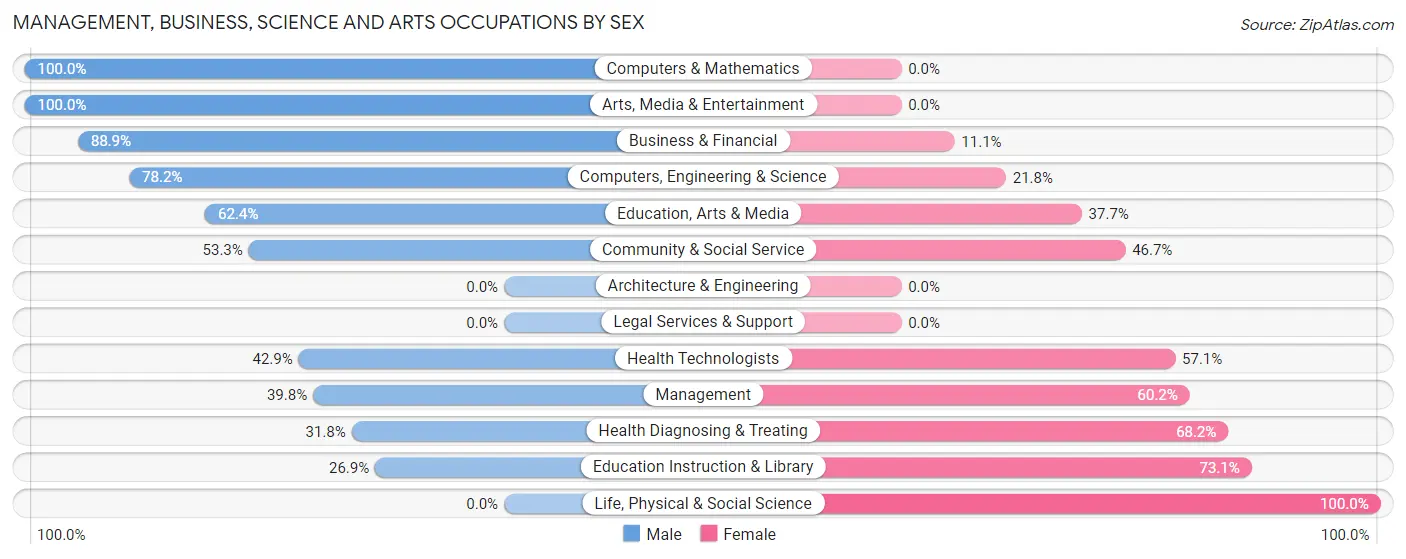
Management, Business, Science and Arts Occupations by Sex
Within the Management, Business, Science and Arts occupations in Brooksville, the most male-oriented occupations are Computers & Mathematics (100.0%), Arts, Media & Entertainment (100.0%), and Business & Financial (88.9%), while the most female-oriented occupations are Life, Physical & Social Science (100.0%), Education Instruction & Library (73.1%), and Health Diagnosing & Treating (68.2%).
| Occupation | Male | Female |
| Management | 100 (39.8%) | 151 (60.2%) |
| Business & Financial | 56 (88.9%) | 7 (11.1%) |
| Computers, Engineering & Science | 43 (78.2%) | 12 (21.8%) |
| Computers & Mathematics | 43 (100.0%) | 0 (0.0%) |
| Architecture & Engineering | 0 (0.0%) | 0 (0.0%) |
| Life, Physical & Social Science | 0 (0.0%) | 12 (100.0%) |
| Community & Social Service | 179 (53.3%) | 157 (46.7%) |
| Education, Arts & Media | 53 (62.4%) | 32 (37.7%) |
| Legal Services & Support | 0 (0.0%) | 0 (0.0%) |
| Education Instruction & Library | 46 (26.9%) | 125 (73.1%) |
| Arts, Media & Entertainment | 80 (100.0%) | 0 (0.0%) |
| Health Diagnosing & Treating | 89 (31.8%) | 191 (68.2%) |
| Health Technologists | 18 (42.9%) | 24 (57.1%) |
| Total (Category) | 467 (47.4%) | 518 (52.6%) |
| Total (Overall) | 1,354 (41.4%) | 1,917 (58.6%) |
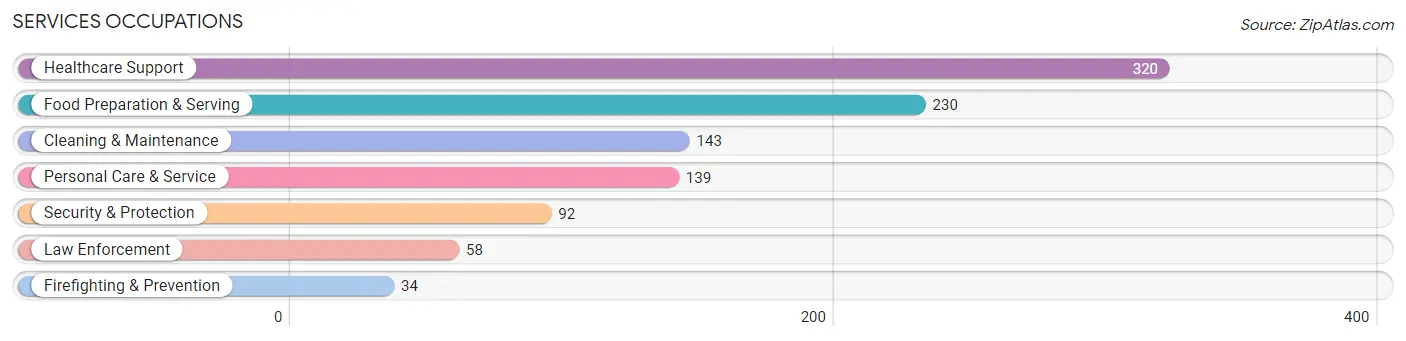
Services Occupations
The most common Services occupations in Brooksville are Healthcare Support (320 | 9.8%), Food Preparation & Serving (230 | 7.0%), Cleaning & Maintenance (143 | 4.4%), Personal Care & Service (139 | 4.3%), and Security & Protection (92 | 2.8%).
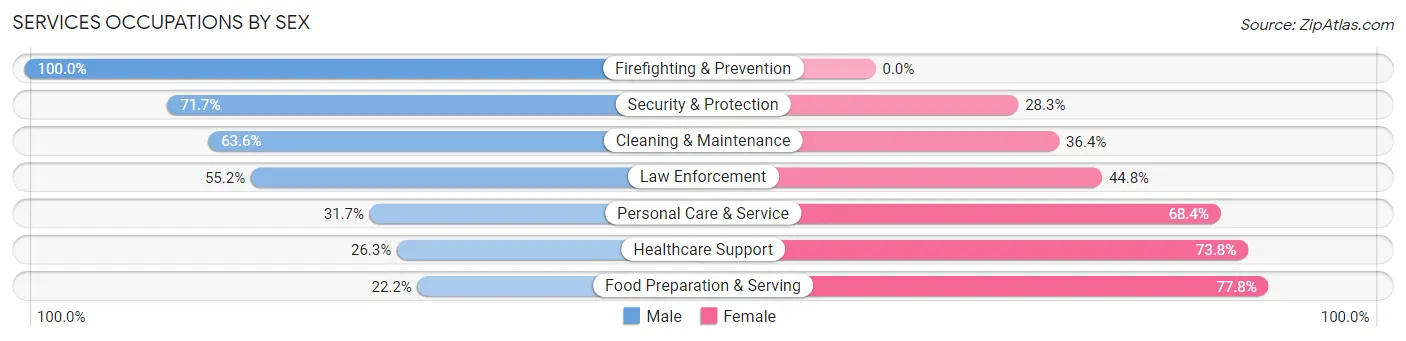
Services Occupations by Sex
Within the Services occupations in Brooksville, the most male-oriented occupations are Firefighting & Prevention (100.0%), Security & Protection (71.7%), and Cleaning & Maintenance (63.6%), while the most female-oriented occupations are Food Preparation & Serving (77.8%), Healthcare Support (73.8%), and Personal Care & Service (68.3%).
| Occupation | Male | Female |
| Healthcare Support | 84 (26.3%) | 236 (73.8%) |
| Security & Protection | 66 (71.7%) | 26 (28.3%) |
| Firefighting & Prevention | 34 (100.0%) | 0 (0.0%) |
| Law Enforcement | 32 (55.2%) | 26 (44.8%) |
| Food Preparation & Serving | 51 (22.2%) | 179 (77.8%) |
| Cleaning & Maintenance | 91 (63.6%) | 52 (36.4%) |
| Personal Care & Service | 44 (31.7%) | 95 (68.3%) |
| Total (Category) | 336 (36.4%) | 588 (63.6%) |
| Total (Overall) | 1,354 (41.4%) | 1,917 (58.6%) |
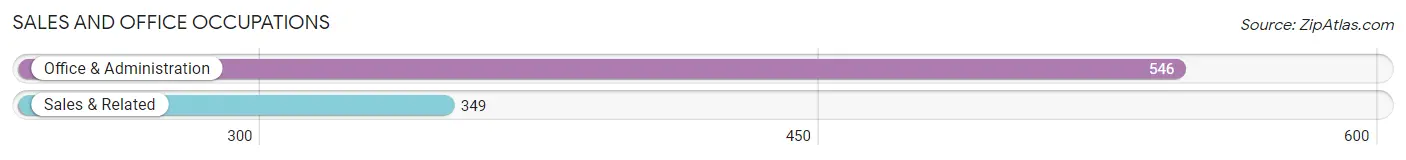
Sales and Office Occupations
The most common Sales and Office occupations in Brooksville are Office & Administration (546 | 16.7%), and Sales & Related (349 | 10.7%).
Sales and Office Occupations by Sex
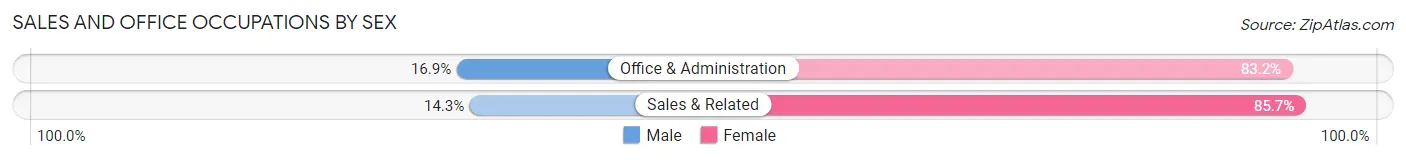
| Occupation | Male | Female |
| Sales & Related | 50 (14.3%) | 299 (85.7%) |
| Office & Administration | 92 (16.9%) | 454 (83.2%) |
| Total (Category) | 142 (15.9%) | 753 (84.1%) |
| Total (Overall) | 1,354 (41.4%) | 1,917 (58.6%) |
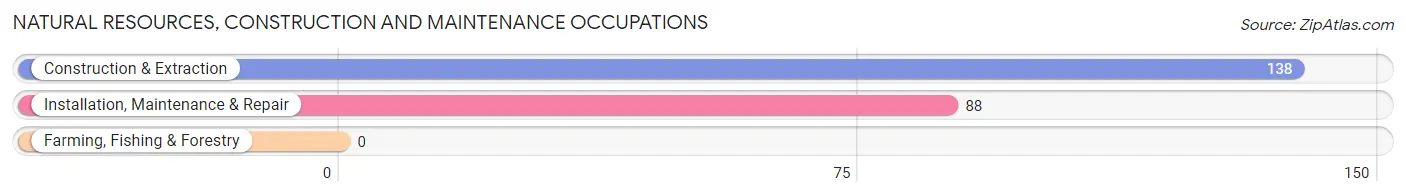
Natural Resources, Construction and Maintenance Occupations
The most common Natural Resources, Construction and Maintenance occupations in Brooksville are Construction & Extraction (138 | 4.2%), and Installation, Maintenance & Repair (88 | 2.7%).
Natural Resources, Construction and Maintenance Occupations by Sex
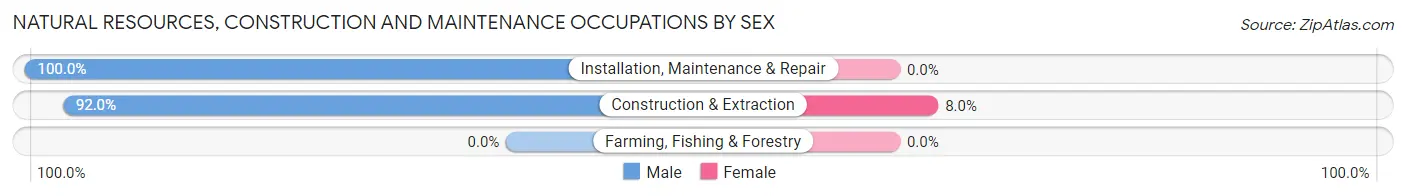
| Occupation | Male | Female |
| Farming, Fishing & Forestry | 0 (0.0%) | 0 (0.0%) |
| Construction & Extraction | 127 (92.0%) | 11 (8.0%) |
| Installation, Maintenance & Repair | 88 (100.0%) | 0 (0.0%) |
| Total (Category) | 215 (95.1%) | 11 (4.9%) |
| Total (Overall) | 1,354 (41.4%) | 1,917 (58.6%) |
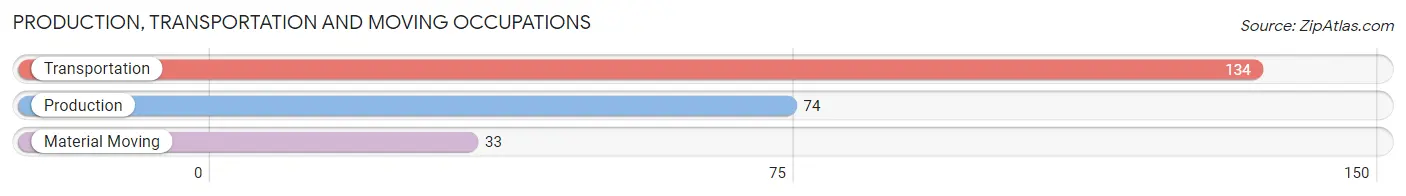
Production, Transportation and Moving Occupations
The most common Production, Transportation and Moving occupations in Brooksville are Transportation (134 | 4.1%), Production (74 | 2.3%), and Material Moving (33 | 1.0%).
Production, Transportation and Moving Occupations by Sex
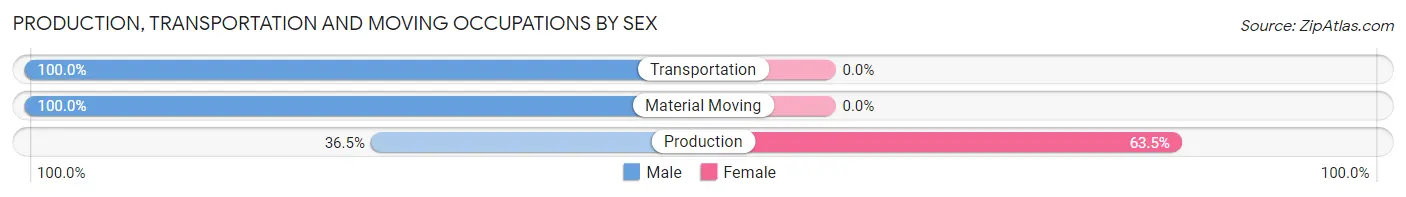
| Occupation | Male | Female |
| Production | 27 (36.5%) | 47 (63.5%) |
| Transportation | 134 (100.0%) | 0 (0.0%) |
| Material Moving | 33 (100.0%) | 0 (0.0%) |
| Total (Category) | 194 (80.5%) | 47 (19.5%) |
| Total (Overall) | 1,354 (41.4%) | 1,917 (58.6%) |
Employment Industries by Sex in Brooksville
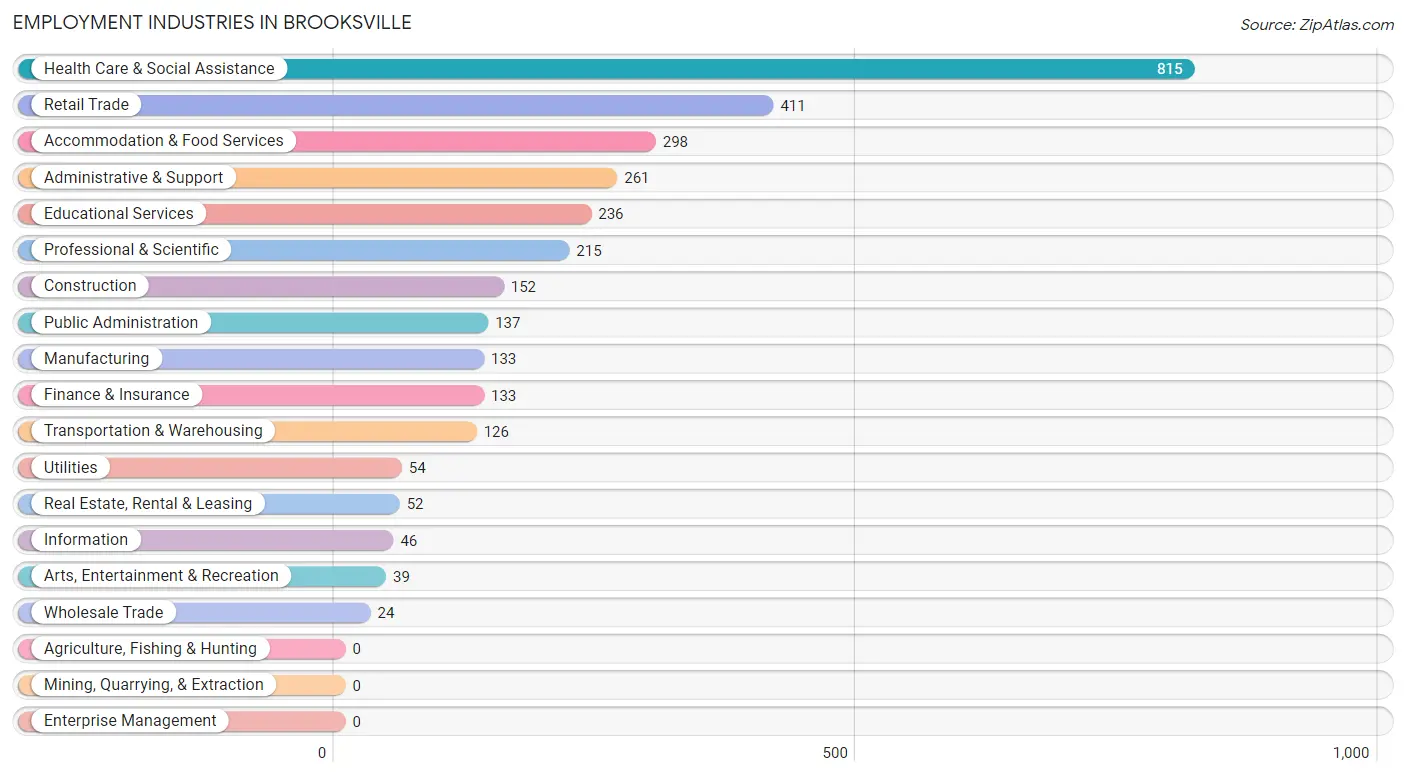
Employment Industries in Brooksville
The major employment industries in Brooksville include Health Care & Social Assistance (815 | 24.9%), Retail Trade (411 | 12.6%), Accommodation & Food Services (298 | 9.1%), Administrative & Support (261 | 8.0%), and Educational Services (236 | 7.2%).
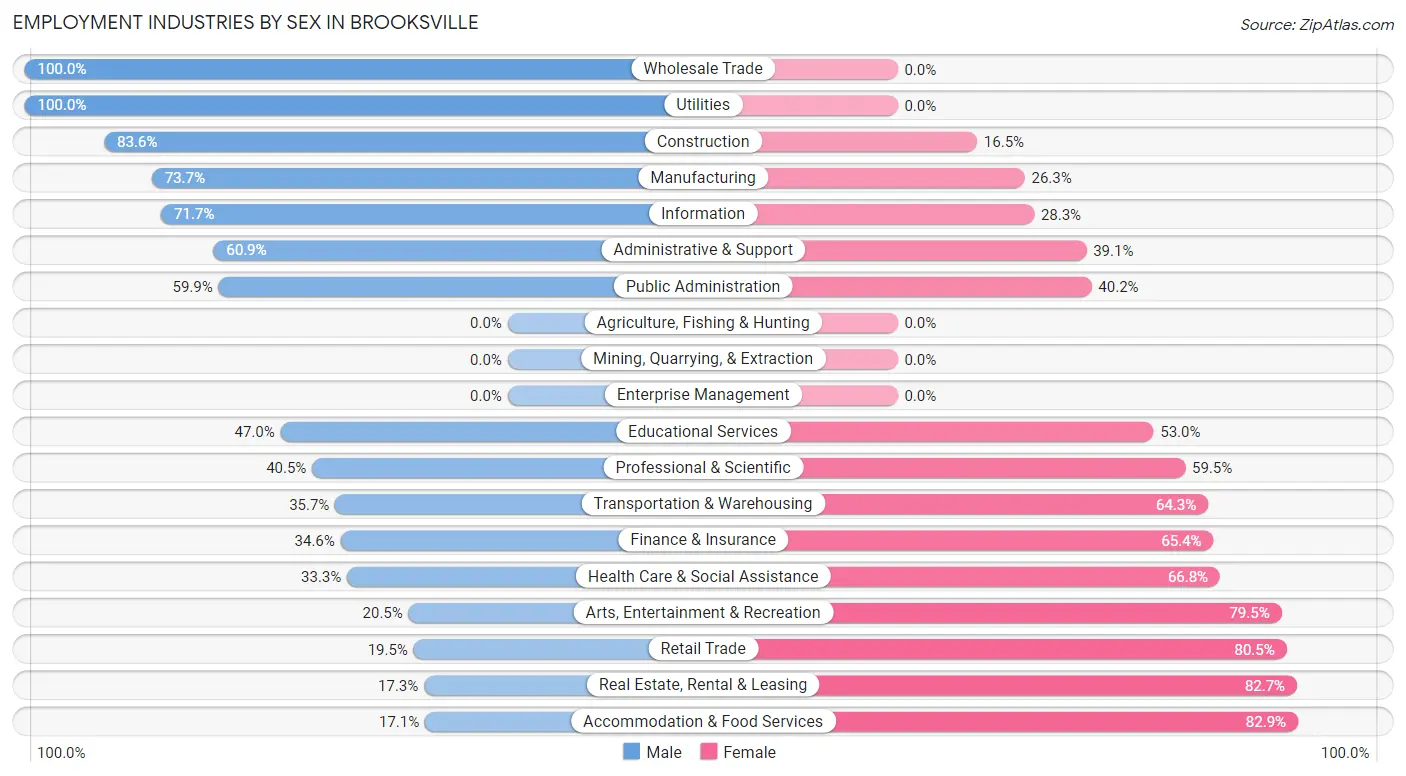
Employment Industries by Sex in Brooksville
The Brooksville industries that see more men than women are Wholesale Trade (100.0%), Utilities (100.0%), and Construction (83.6%), whereas the industries that tend to have a higher number of women are Accommodation & Food Services (82.9%), Real Estate, Rental & Leasing (82.7%), and Retail Trade (80.5%).
| Industry | Male | Female |
| Agriculture, Fishing & Hunting | 0 (0.0%) | 0 (0.0%) |
| Mining, Quarrying, & Extraction | 0 (0.0%) | 0 (0.0%) |
| Construction | 127 (83.6%) | 25 (16.5%) |
| Manufacturing | 98 (73.7%) | 35 (26.3%) |
| Wholesale Trade | 24 (100.0%) | 0 (0.0%) |
| Retail Trade | 80 (19.5%) | 331 (80.5%) |
| Transportation & Warehousing | 45 (35.7%) | 81 (64.3%) |
| Utilities | 54 (100.0%) | 0 (0.0%) |
| Information | 33 (71.7%) | 13 (28.3%) |
| Finance & Insurance | 46 (34.6%) | 87 (65.4%) |
| Real Estate, Rental & Leasing | 9 (17.3%) | 43 (82.7%) |
| Professional & Scientific | 87 (40.5%) | 128 (59.5%) |
| Enterprise Management | 0 (0.0%) | 0 (0.0%) |
| Administrative & Support | 159 (60.9%) | 102 (39.1%) |
| Educational Services | 111 (47.0%) | 125 (53.0%) |
| Health Care & Social Assistance | 271 (33.3%) | 544 (66.7%) |
| Arts, Entertainment & Recreation | 8 (20.5%) | 31 (79.5%) |
| Accommodation & Food Services | 51 (17.1%) | 247 (82.9%) |
| Public Administration | 82 (59.9%) | 55 (40.2%) |
| Total | 1,354 (41.4%) | 1,917 (58.6%) |
Education in Brooksville
School Enrollment in Brooksville
The most common levels of schooling among the 1,458 students in Brooksville are college / undergraduate (338 | 23.2%), middle school (291 | 20.0%), and high school (281 | 19.3%).
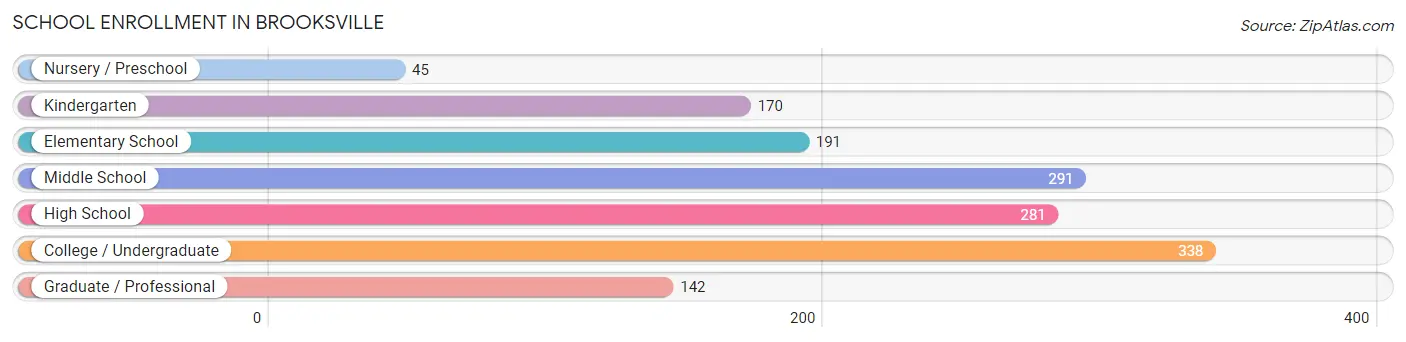
| School Level | # Students | % Students |
| Nursery / Preschool | 45 | 3.1% |
| Kindergarten | 170 | 11.7% |
| Elementary School | 191 | 13.1% |
| Middle School | 291 | 20.0% |
| High School | 281 | 19.3% |
| College / Undergraduate | 338 | 23.2% |
| Graduate / Professional | 142 | 9.7% |
| Total | 1,458 | 100.0% |
School Enrollment by Age by Funding Source in Brooksville
Out of a total of 1,458 students who are enrolled in schools in Brooksville, 364 (25.0%) attend a private institution, while the remaining 1,094 (75.0%) are enrolled in public schools. The age group of 20 to 24 year olds has the highest likelihood of being enrolled in private schools, with 200 (61.4% in the age bracket) enrolled. Conversely, the age group of 3 to 4 year olds has the lowest likelihood of being enrolled in a private school, with 45 (100.0% in the age bracket) attending a public institution.
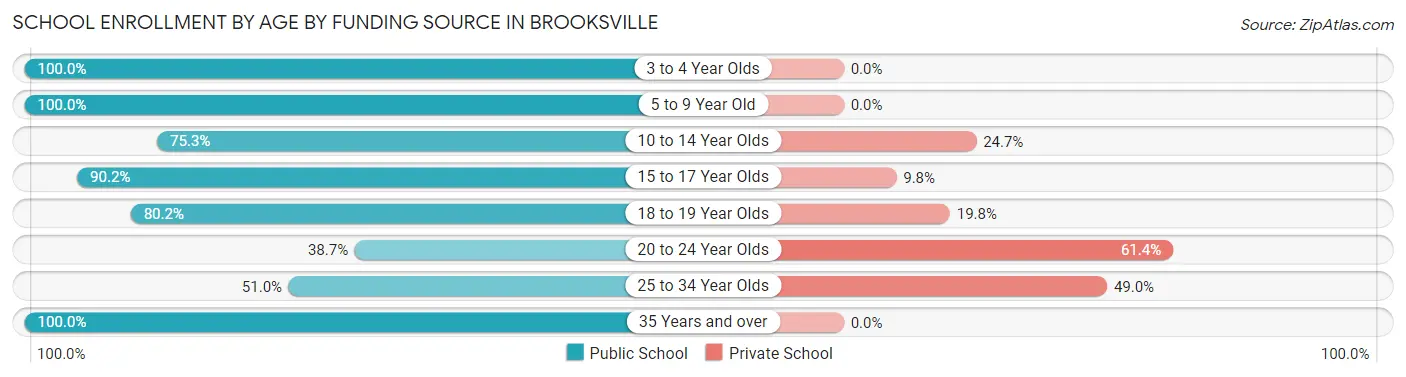
| Age Bracket | Public School | Private School |
| 3 to 4 Year Olds | 45 (100.0%) | 0 (0.0%) |
| 5 to 9 Year Old | 361 (100.0%) | 0 (0.0%) |
| 10 to 14 Year Olds | 232 (75.3%) | 76 (24.7%) |
| 15 to 17 Year Olds | 184 (90.2%) | 20 (9.8%) |
| 18 to 19 Year Olds | 69 (80.2%) | 17 (19.8%) |
| 20 to 24 Year Olds | 126 (38.7%) | 200 (61.4%) |
| 25 to 34 Year Olds | 53 (51.0%) | 51 (49.0%) |
| 35 Years and over | 24 (100.0%) | 0 (0.0%) |
| Total | 1,094 (75.0%) | 364 (25.0%) |
Educational Attainment by Field of Study in Brooksville
Business (304 | 19.4%), education (260 | 16.6%), bio, nature & agricultural (134 | 8.6%), science & technology (125 | 8.0%), and arts & humanities (123 | 7.8%) are the most common fields of study among 1,568 individuals in Brooksville who have obtained a bachelor's degree or higher.
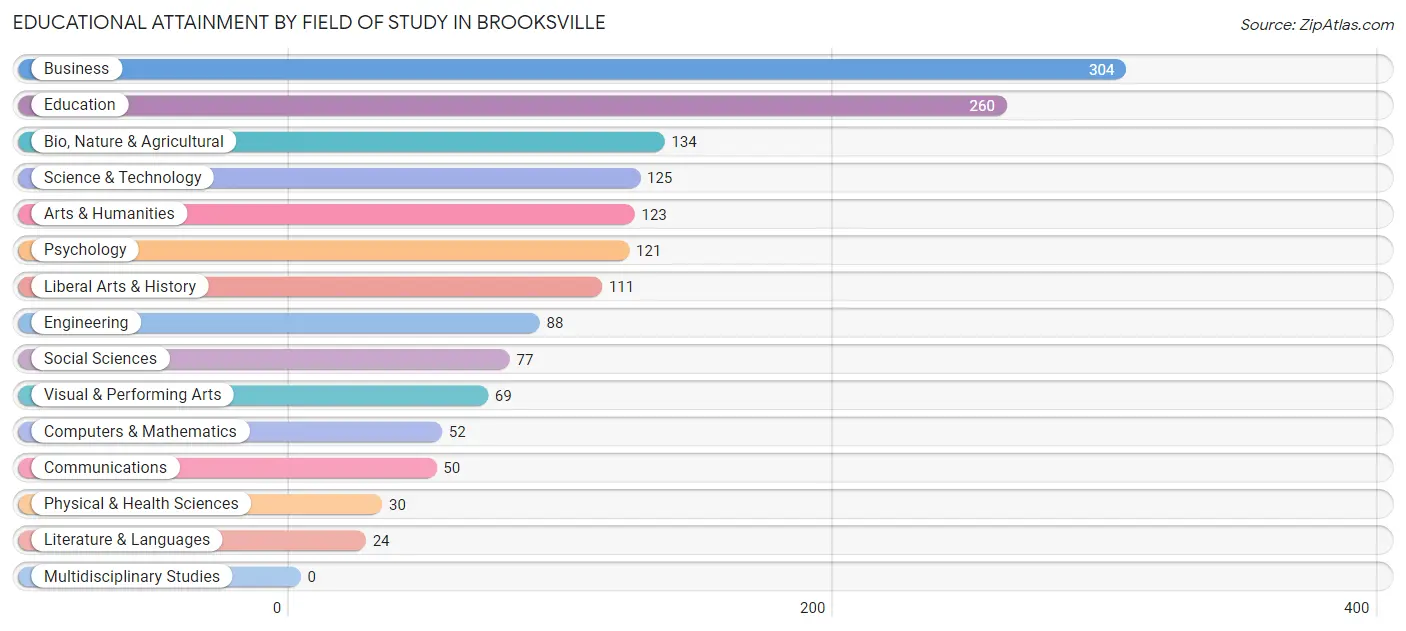
| Field of Study | # Graduates | % Graduates |
| Computers & Mathematics | 52 | 3.3% |
| Bio, Nature & Agricultural | 134 | 8.6% |
| Physical & Health Sciences | 30 | 1.9% |
| Psychology | 121 | 7.7% |
| Social Sciences | 77 | 4.9% |
| Engineering | 88 | 5.6% |
| Multidisciplinary Studies | 0 | 0.0% |
| Science & Technology | 125 | 8.0% |
| Business | 304 | 19.4% |
| Education | 260 | 16.6% |
| Literature & Languages | 24 | 1.5% |
| Liberal Arts & History | 111 | 7.1% |
| Visual & Performing Arts | 69 | 4.4% |
| Communications | 50 | 3.2% |
| Arts & Humanities | 123 | 7.8% |
| Total | 1,568 | 100.0% |
Transportation & Commute in Brooksville
Vehicle Availability by Sex in Brooksville
The most prevalent vehicle ownership categories in Brooksville are males with 2 vehicles (687, accounting for 53.9%) and females with 2 vehicles (797, making up 36.1%).
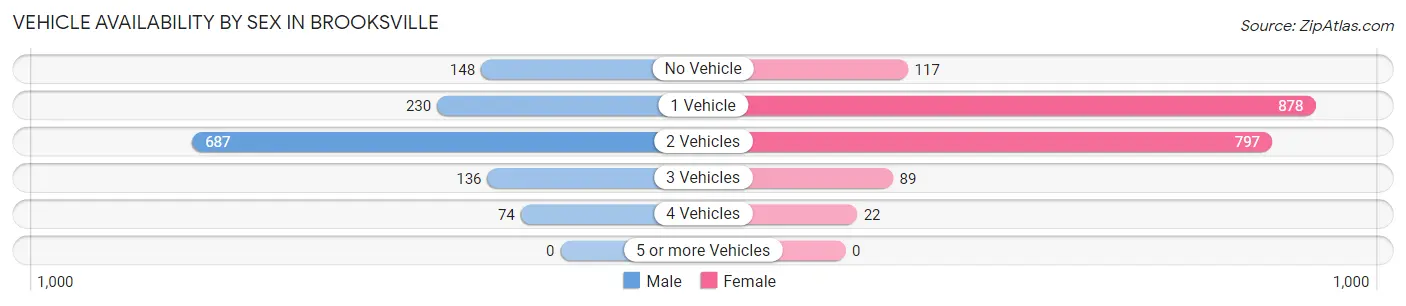
| Vehicles Available | Male | Female |
| No Vehicle | 148 (11.6%) | 117 (6.1%) |
| 1 Vehicle | 230 (18.0%) | 878 (46.1%) |
| 2 Vehicles | 687 (53.9%) | 797 (41.9%) |
| 3 Vehicles | 136 (10.7%) | 89 (4.7%) |
| 4 Vehicles | 74 (5.8%) | 22 (1.2%) |
| 5 or more Vehicles | 0 (0.0%) | 0 (0.0%) |
| Total | 1,275 (100.0%) | 1,903 (100.0%) |
Commute Time in Brooksville
The most frequently occuring commute durations in Brooksville are 5 to 9 minutes (481 commuters, 15.9%), 30 to 34 minutes (443 commuters, 14.7%), and 15 to 19 minutes (412 commuters, 13.6%).
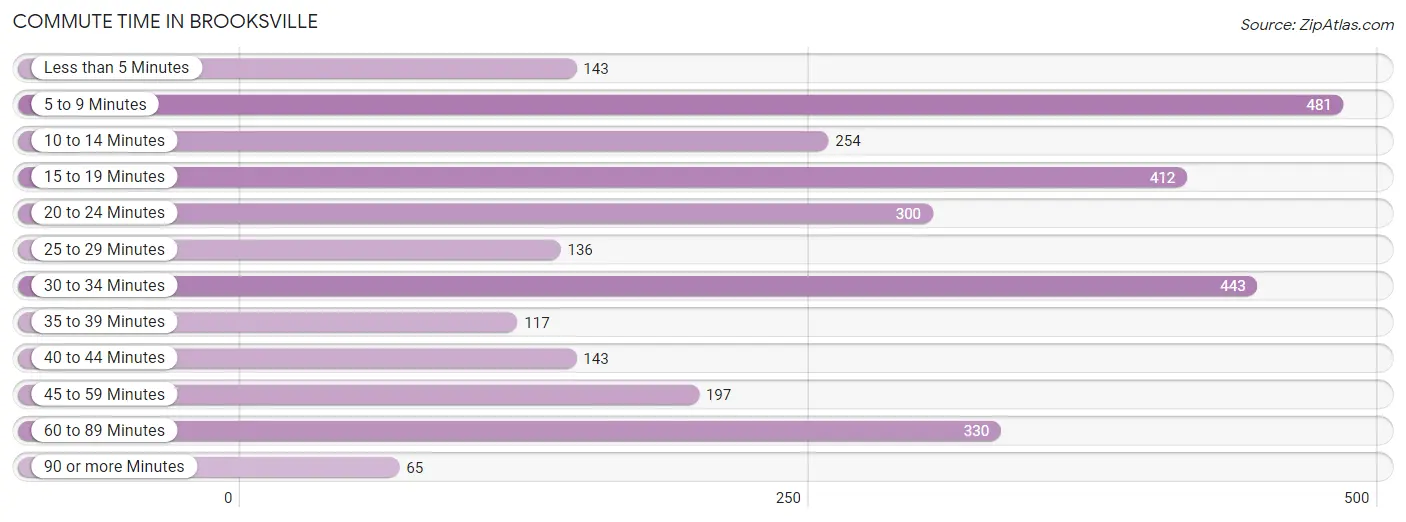
| Commute Time | # Commuters | % Commuters |
| Less than 5 Minutes | 143 | 4.7% |
| 5 to 9 Minutes | 481 | 15.9% |
| 10 to 14 Minutes | 254 | 8.4% |
| 15 to 19 Minutes | 412 | 13.6% |
| 20 to 24 Minutes | 300 | 9.9% |
| 25 to 29 Minutes | 136 | 4.5% |
| 30 to 34 Minutes | 443 | 14.7% |
| 35 to 39 Minutes | 117 | 3.9% |
| 40 to 44 Minutes | 143 | 4.7% |
| 45 to 59 Minutes | 197 | 6.5% |
| 60 to 89 Minutes | 330 | 10.9% |
| 90 or more Minutes | 65 | 2.1% |
Commute Time by Sex in Brooksville
The most common commute times in Brooksville are 60 to 89 minutes (211 commuters, 16.7%) for males and 30 to 34 minutes (337 commuters, 19.2%) for females.
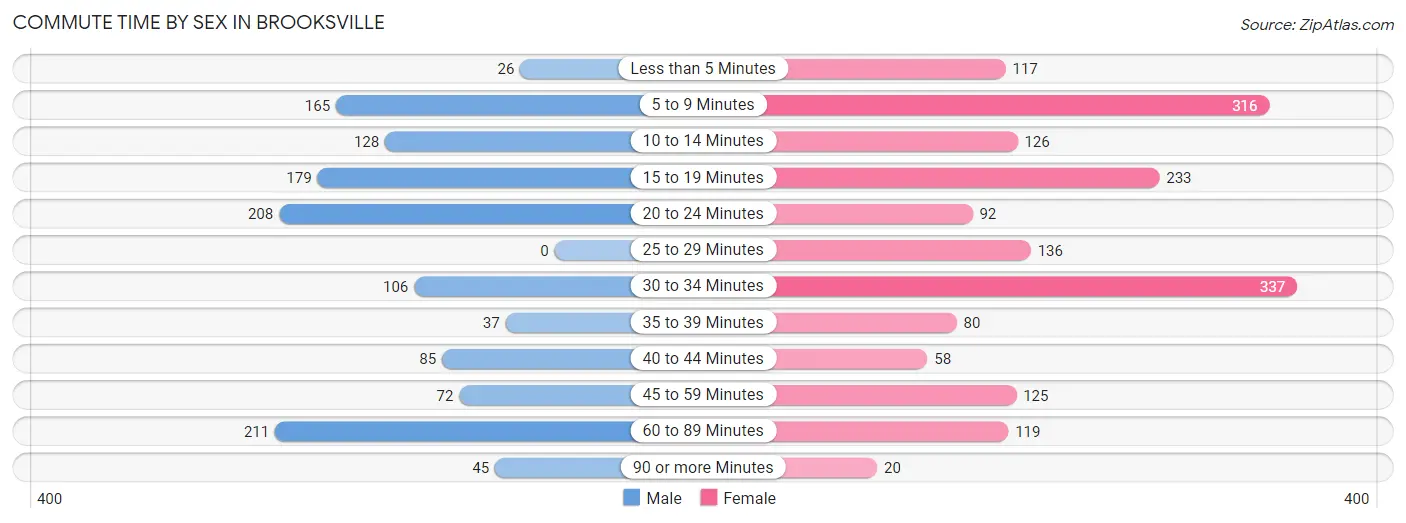
| Commute Time | Male | Female |
| Less than 5 Minutes | 26 (2.1%) | 117 (6.7%) |
| 5 to 9 Minutes | 165 (13.1%) | 316 (18.0%) |
| 10 to 14 Minutes | 128 (10.1%) | 126 (7.2%) |
| 15 to 19 Minutes | 179 (14.2%) | 233 (13.3%) |
| 20 to 24 Minutes | 208 (16.5%) | 92 (5.2%) |
| 25 to 29 Minutes | 0 (0.0%) | 136 (7.7%) |
| 30 to 34 Minutes | 106 (8.4%) | 337 (19.2%) |
| 35 to 39 Minutes | 37 (2.9%) | 80 (4.5%) |
| 40 to 44 Minutes | 85 (6.7%) | 58 (3.3%) |
| 45 to 59 Minutes | 72 (5.7%) | 125 (7.1%) |
| 60 to 89 Minutes | 211 (16.7%) | 119 (6.8%) |
| 90 or more Minutes | 45 (3.6%) | 20 (1.1%) |
Time of Departure to Work by Sex in Brooksville
The most frequent times of departure to work in Brooksville are 6:00 AM to 6:29 AM (183, 14.5%) for males and 6:00 AM to 6:29 AM (223, 12.7%) for females.
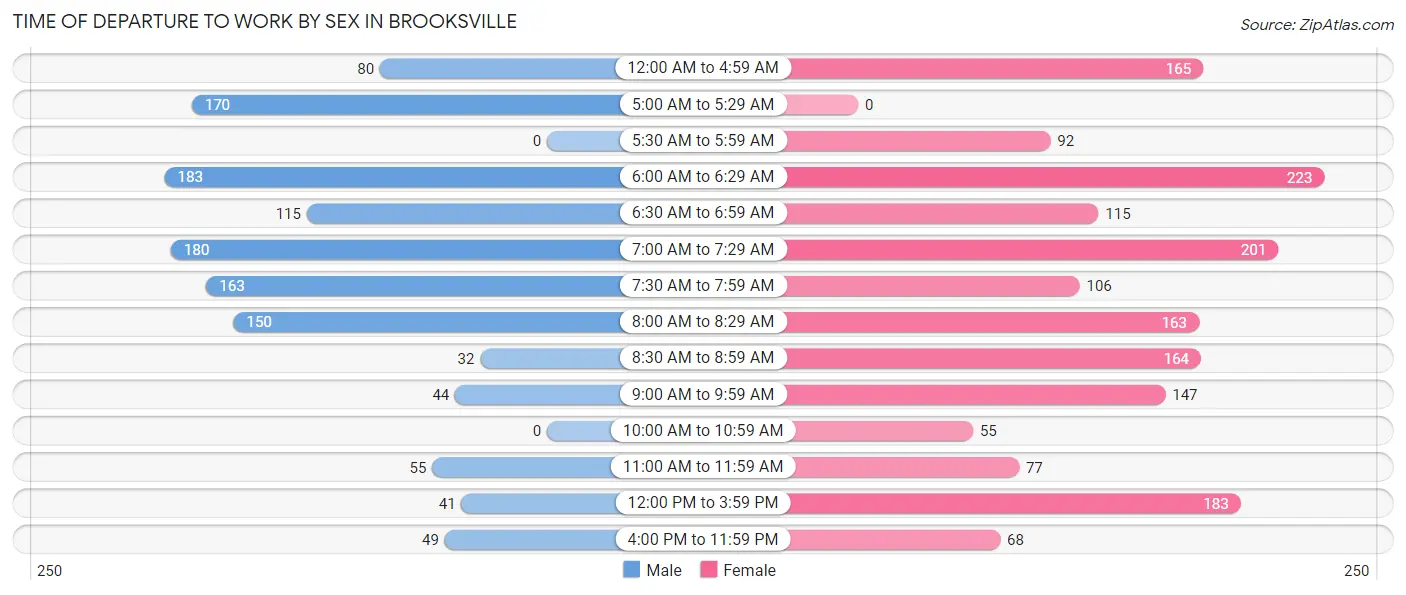
| Time of Departure | Male | Female |
| 12:00 AM to 4:59 AM | 80 (6.3%) | 165 (9.4%) |
| 5:00 AM to 5:29 AM | 170 (13.5%) | 0 (0.0%) |
| 5:30 AM to 5:59 AM | 0 (0.0%) | 92 (5.2%) |
| 6:00 AM to 6:29 AM | 183 (14.5%) | 223 (12.7%) |
| 6:30 AM to 6:59 AM | 115 (9.1%) | 115 (6.5%) |
| 7:00 AM to 7:29 AM | 180 (14.3%) | 201 (11.4%) |
| 7:30 AM to 7:59 AM | 163 (12.9%) | 106 (6.0%) |
| 8:00 AM to 8:29 AM | 150 (11.9%) | 163 (9.3%) |
| 8:30 AM to 8:59 AM | 32 (2.5%) | 164 (9.3%) |
| 9:00 AM to 9:59 AM | 44 (3.5%) | 147 (8.4%) |
| 10:00 AM to 10:59 AM | 0 (0.0%) | 55 (3.1%) |
| 11:00 AM to 11:59 AM | 55 (4.4%) | 77 (4.4%) |
| 12:00 PM to 3:59 PM | 41 (3.3%) | 183 (10.4%) |
| 4:00 PM to 11:59 PM | 49 (3.9%) | 68 (3.9%) |
| Total | 1,262 (100.0%) | 1,759 (100.0%) |
Housing Occupancy in Brooksville
Occupancy by Ownership in Brooksville
Of the total 4,249 dwellings in Brooksville, owner-occupied units account for 2,556 (60.2%), while renter-occupied units make up 1,693 (39.8%).
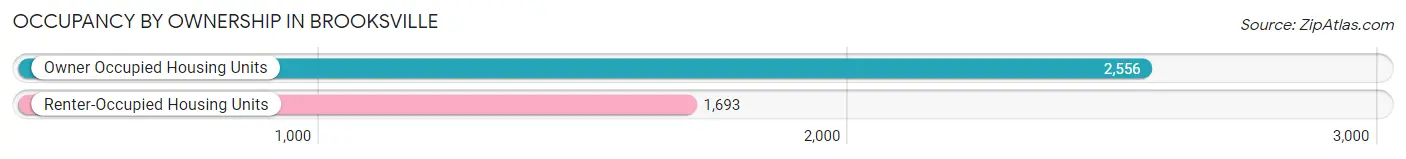
| Occupancy | # Housing Units | % Housing Units |
| Owner Occupied Housing Units | 2,556 | 60.2% |
| Renter-Occupied Housing Units | 1,693 | 39.8% |
| Total Occupied Housing Units | 4,249 | 100.0% |
Occupancy by Household Size in Brooksville
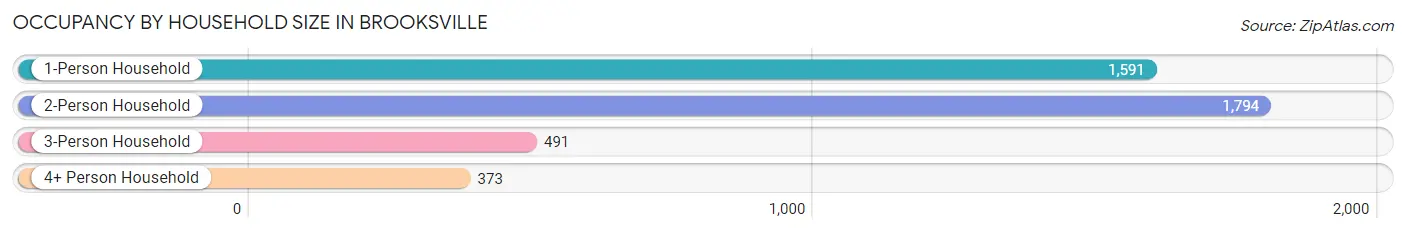
| Household Size | # Housing Units | % Housing Units |
| 1-Person Household | 1,591 | 37.4% |
| 2-Person Household | 1,794 | 42.2% |
| 3-Person Household | 491 | 11.6% |
| 4+ Person Household | 373 | 8.8% |
| Total Housing Units | 4,249 | 100.0% |
Occupancy by Ownership by Household Size in Brooksville
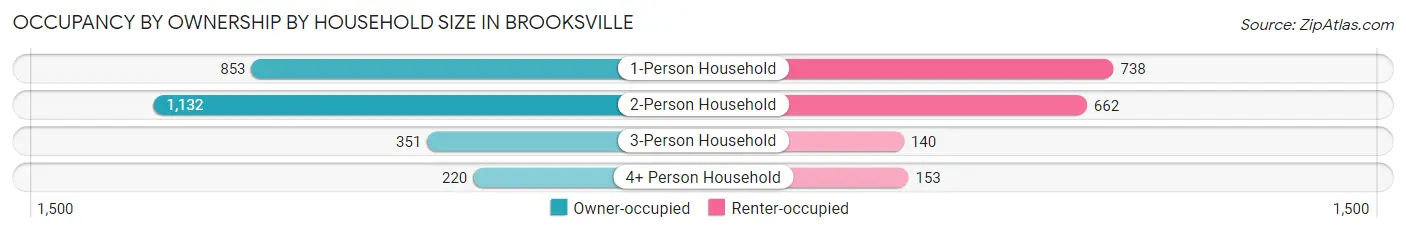
| Household Size | Owner-occupied | Renter-occupied |
| 1-Person Household | 853 (53.6%) | 738 (46.4%) |
| 2-Person Household | 1,132 (63.1%) | 662 (36.9%) |
| 3-Person Household | 351 (71.5%) | 140 (28.5%) |
| 4+ Person Household | 220 (59.0%) | 153 (41.0%) |
| Total Housing Units | 2,556 (60.2%) | 1,693 (39.8%) |
Occupancy by Educational Attainment in Brooksville
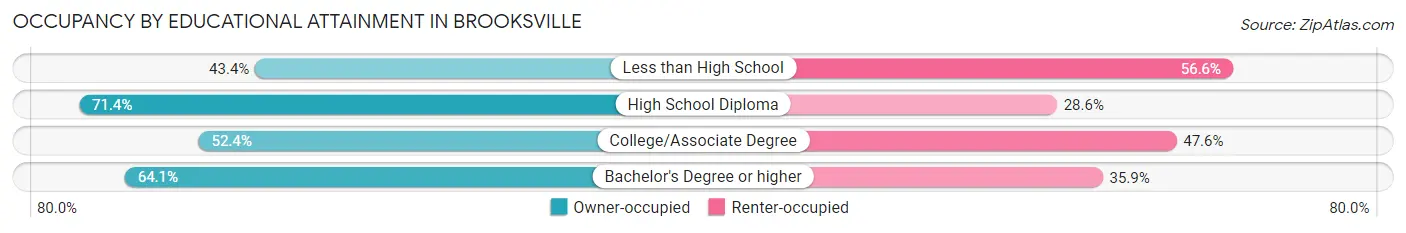
| Household Size | Owner-occupied | Renter-occupied |
| Less than High School | 152 (43.4%) | 198 (56.6%) |
| High School Diploma | 912 (71.4%) | 366 (28.6%) |
| College/Associate Degree | 842 (52.4%) | 765 (47.6%) |
| Bachelor's Degree or higher | 650 (64.1%) | 364 (35.9%) |
Occupancy by Age of Householder in Brooksville
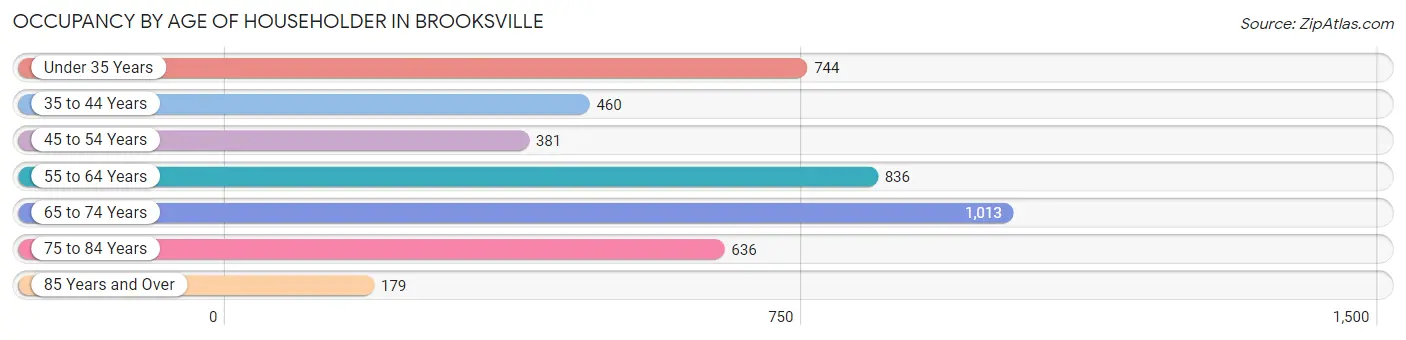
| Age Bracket | # Households | % Households |
| Under 35 Years | 744 | 17.5% |
| 35 to 44 Years | 460 | 10.8% |
| 45 to 54 Years | 381 | 9.0% |
| 55 to 64 Years | 836 | 19.7% |
| 65 to 74 Years | 1,013 | 23.8% |
| 75 to 84 Years | 636 | 15.0% |
| 85 Years and Over | 179 | 4.2% |
| Total | 4,249 | 100.0% |
Housing Finances in Brooksville
Median Income by Occupancy in Brooksville
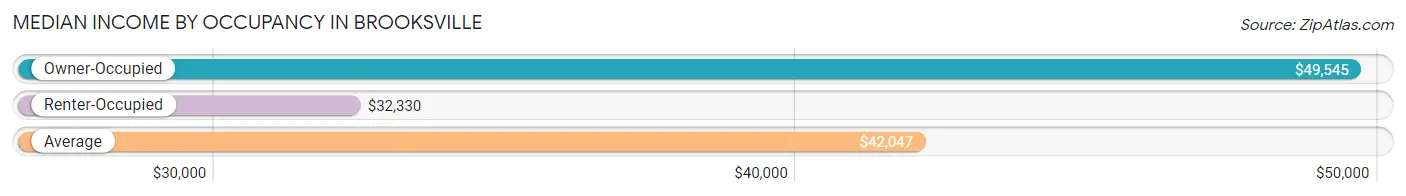
| Occupancy Type | # Households | Median Income |
| Owner-Occupied | 2,556 (60.2%) | $49,545 |
| Renter-Occupied | 1,693 (39.8%) | $32,330 |
| Average | 4,249 (100.0%) | $42,047 |
Occupancy by Householder Income Bracket in Brooksville
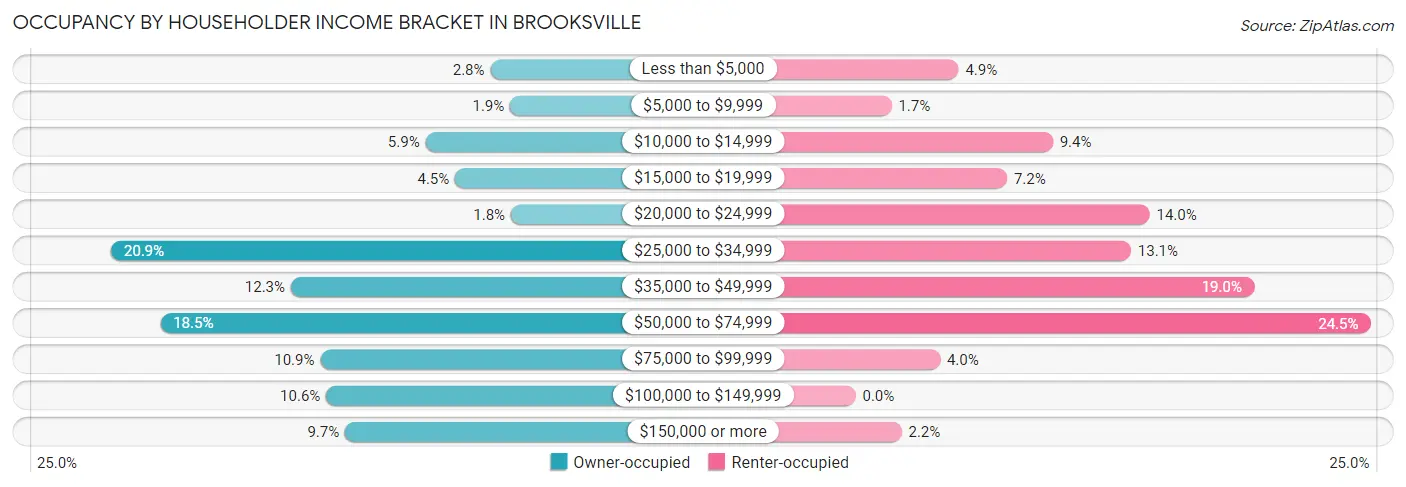
| Income Bracket | Owner-occupied | Renter-occupied |
| Less than $5,000 | 72 (2.8%) | 83 (4.9%) |
| $5,000 to $9,999 | 48 (1.9%) | 29 (1.7%) |
| $10,000 to $14,999 | 151 (5.9%) | 159 (9.4%) |
| $15,000 to $19,999 | 115 (4.5%) | 122 (7.2%) |
| $20,000 to $24,999 | 47 (1.8%) | 237 (14.0%) |
| $25,000 to $34,999 | 534 (20.9%) | 222 (13.1%) |
| $35,000 to $49,999 | 315 (12.3%) | 321 (19.0%) |
| $50,000 to $74,999 | 474 (18.5%) | 415 (24.5%) |
| $75,000 to $99,999 | 279 (10.9%) | 68 (4.0%) |
| $100,000 to $149,999 | 272 (10.6%) | 0 (0.0%) |
| $150,000 or more | 249 (9.7%) | 37 (2.2%) |
| Total | 2,556 (100.0%) | 1,693 (100.0%) |
Monthly Housing Cost Tiers in Brooksville
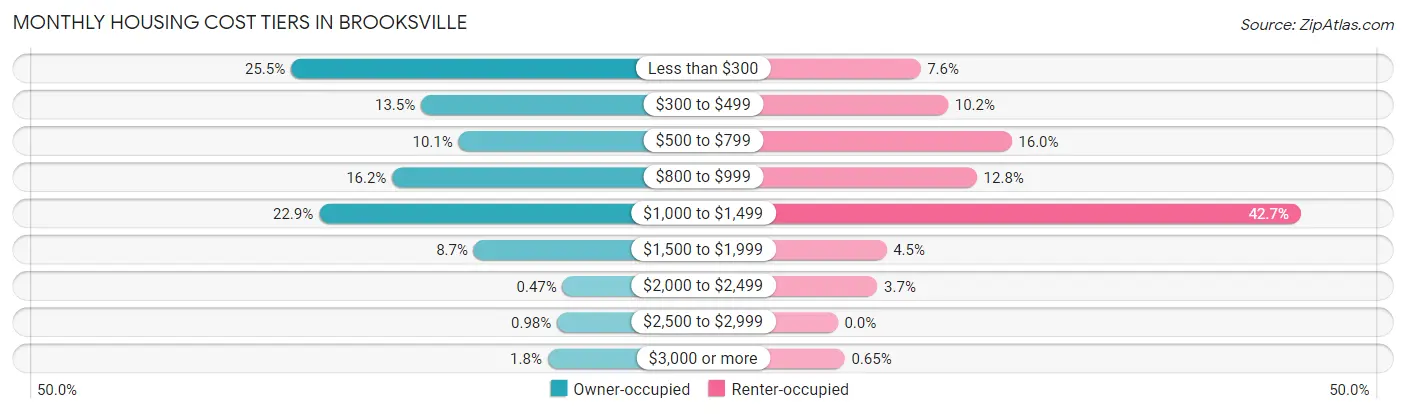
| Monthly Cost | Owner-occupied | Renter-occupied |
| Less than $300 | 651 (25.5%) | 129 (7.6%) |
| $300 to $499 | 345 (13.5%) | 172 (10.2%) |
| $500 to $799 | 257 (10.1%) | 271 (16.0%) |
| $800 to $999 | 413 (16.2%) | 217 (12.8%) |
| $1,000 to $1,499 | 585 (22.9%) | 722 (42.6%) |
| $1,500 to $1,999 | 221 (8.6%) | 76 (4.5%) |
| $2,000 to $2,499 | 12 (0.5%) | 62 (3.7%) |
| $2,500 to $2,999 | 25 (1.0%) | 0 (0.0%) |
| $3,000 or more | 47 (1.8%) | 11 (0.6%) |
| Total | 2,556 (100.0%) | 1,693 (100.0%) |
Physical Housing Characteristics in Brooksville
Housing Structures in Brooksville
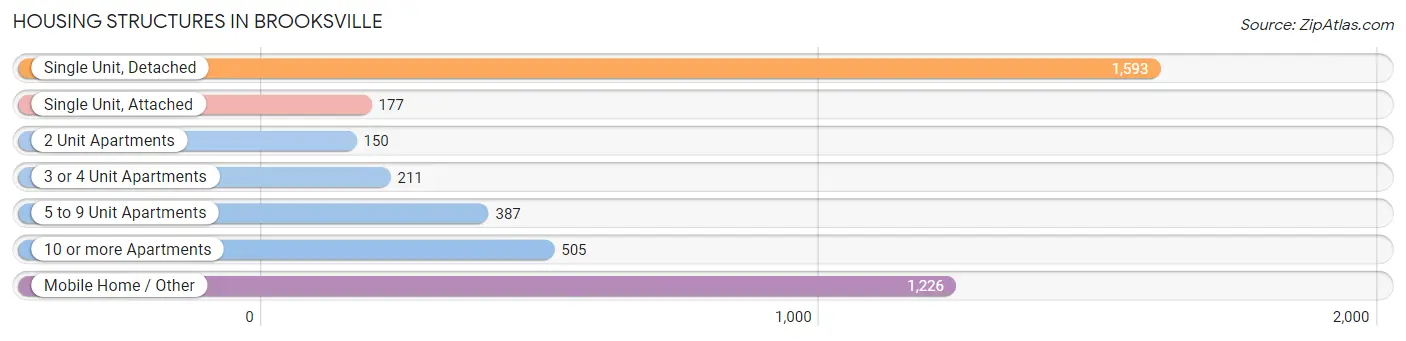
| Structure Type | # Housing Units | % Housing Units |
| Single Unit, Detached | 1,593 | 37.5% |
| Single Unit, Attached | 177 | 4.2% |
| 2 Unit Apartments | 150 | 3.5% |
| 3 or 4 Unit Apartments | 211 | 5.0% |
| 5 to 9 Unit Apartments | 387 | 9.1% |
| 10 or more Apartments | 505 | 11.9% |
| Mobile Home / Other | 1,226 | 28.8% |
| Total | 4,249 | 100.0% |
Housing Structures by Occupancy in Brooksville
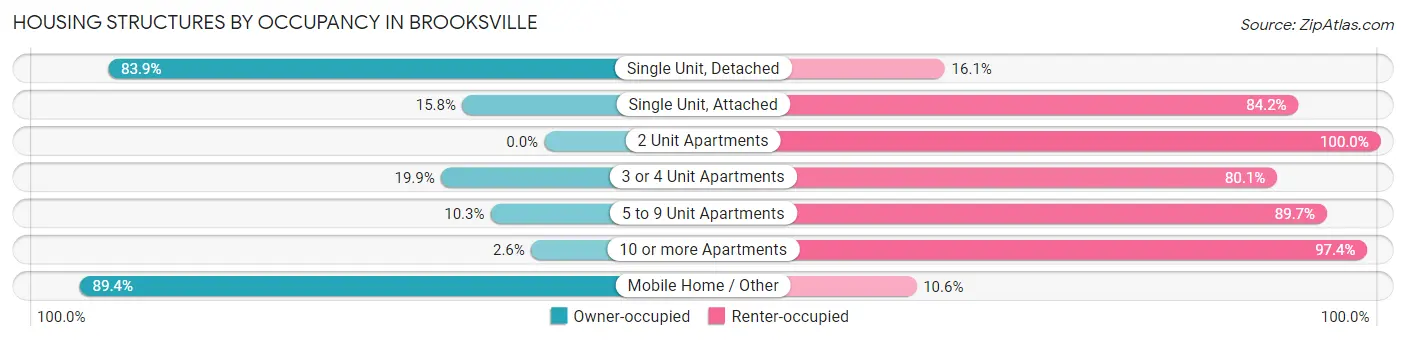
| Structure Type | Owner-occupied | Renter-occupied |
| Single Unit, Detached | 1,337 (83.9%) | 256 (16.1%) |
| Single Unit, Attached | 28 (15.8%) | 149 (84.2%) |
| 2 Unit Apartments | 0 (0.0%) | 150 (100.0%) |
| 3 or 4 Unit Apartments | 42 (19.9%) | 169 (80.1%) |
| 5 to 9 Unit Apartments | 40 (10.3%) | 347 (89.7%) |
| 10 or more Apartments | 13 (2.6%) | 492 (97.4%) |
| Mobile Home / Other | 1,096 (89.4%) | 130 (10.6%) |
| Total | 2,556 (60.2%) | 1,693 (39.8%) |
Housing Structures by Number of Rooms in Brooksville
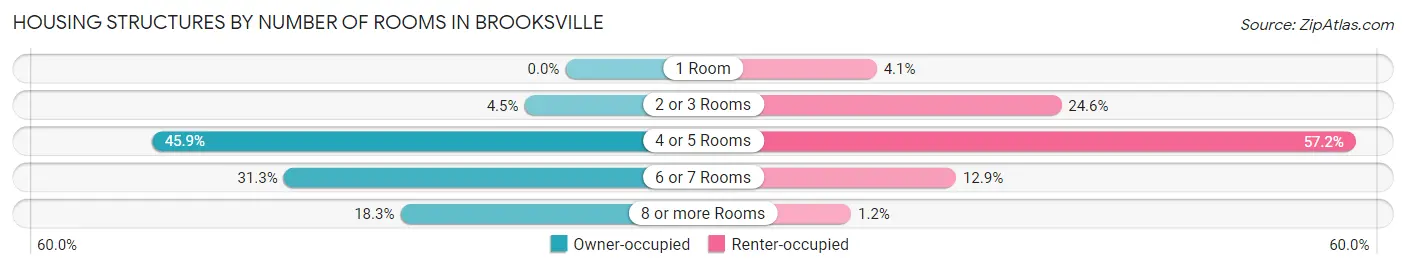
| Number of Rooms | Owner-occupied | Renter-occupied |
| 1 Room | 0 (0.0%) | 69 (4.1%) |
| 2 or 3 Rooms | 116 (4.5%) | 416 (24.6%) |
| 4 or 5 Rooms | 1,173 (45.9%) | 969 (57.2%) |
| 6 or 7 Rooms | 799 (31.3%) | 218 (12.9%) |
| 8 or more Rooms | 468 (18.3%) | 21 (1.2%) |
| Total | 2,556 (100.0%) | 1,693 (100.0%) |
Housing Structure by Heating Type in Brooksville
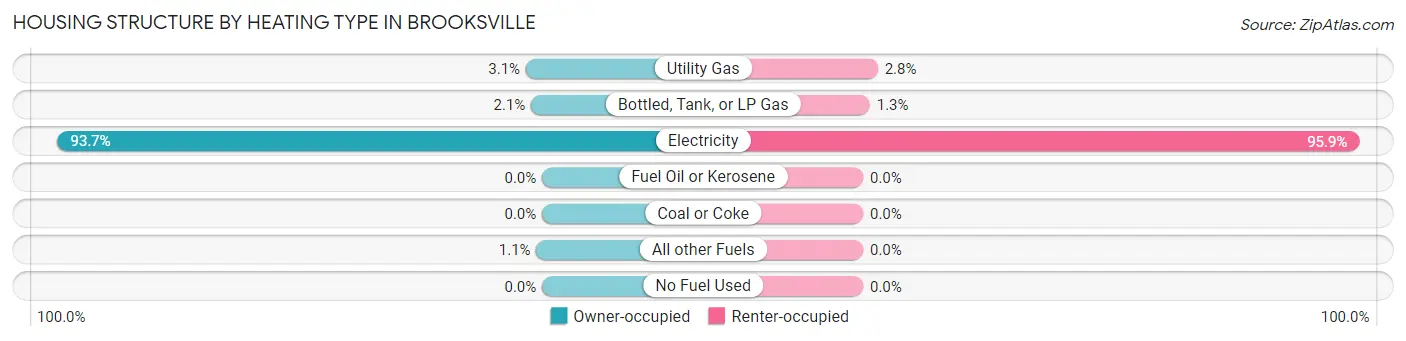
| Heating Type | Owner-occupied | Renter-occupied |
| Utility Gas | 80 (3.1%) | 48 (2.8%) |
| Bottled, Tank, or LP Gas | 54 (2.1%) | 22 (1.3%) |
| Electricity | 2,394 (93.7%) | 1,623 (95.9%) |
| Fuel Oil or Kerosene | 0 (0.0%) | 0 (0.0%) |
| Coal or Coke | 0 (0.0%) | 0 (0.0%) |
| All other Fuels | 28 (1.1%) | 0 (0.0%) |
| No Fuel Used | 0 (0.0%) | 0 (0.0%) |
| Total | 2,556 (100.0%) | 1,693 (100.0%) |
Household Vehicle Usage in Brooksville
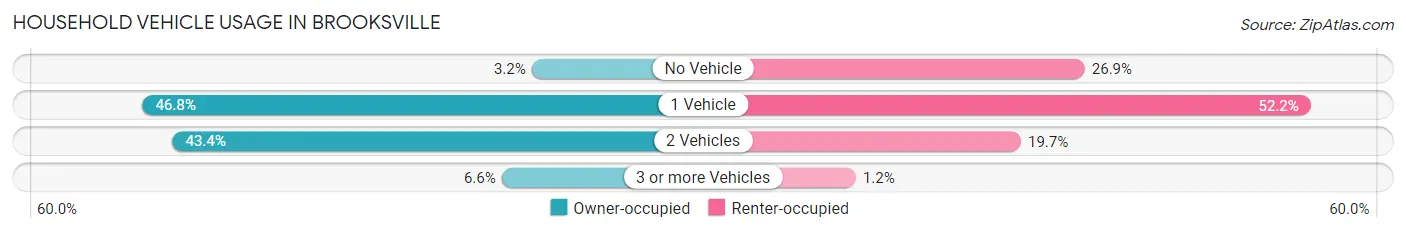
| Vehicles per Household | Owner-occupied | Renter-occupied |
| No Vehicle | 82 (3.2%) | 455 (26.9%) |
| 1 Vehicle | 1,196 (46.8%) | 883 (52.2%) |
| 2 Vehicles | 1,110 (43.4%) | 334 (19.7%) |
| 3 or more Vehicles | 168 (6.6%) | 21 (1.2%) |
| Total | 2,556 (100.0%) | 1,693 (100.0%) |
Real Estate & Mortgages in Brooksville
Real Estate and Mortgage Overview in Brooksville
| Characteristic | Without Mortgage | With Mortgage |
| Housing Units | 1,729 | 827 |
| Median Property Value | $37,900 | $179,000 |
| Median Household Income | $34,885 | $151 |
| Monthly Housing Costs | $394 | $47 |
| Real Estate Taxes | $932 | $0 |
Property Value by Mortgage Status in Brooksville
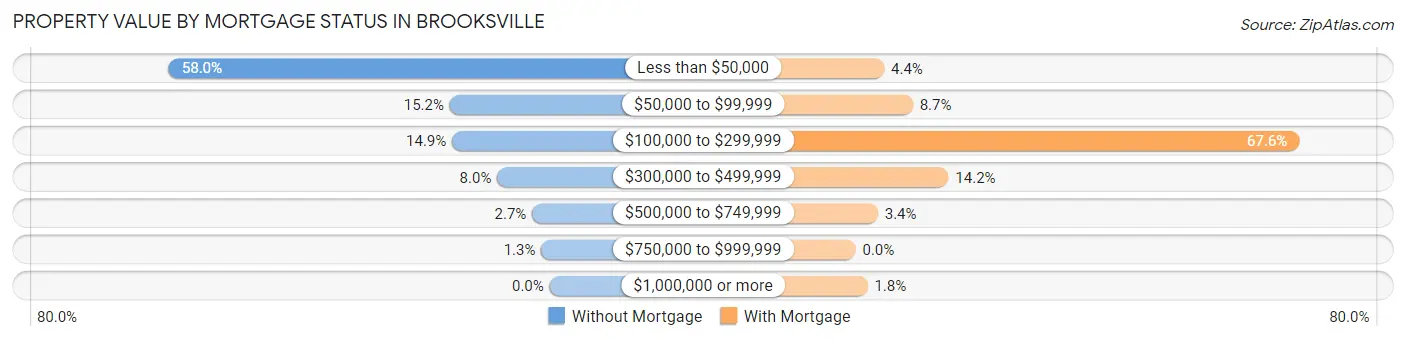
| Property Value | Without Mortgage | With Mortgage |
| Less than $50,000 | 1,003 (58.0%) | 36 (4.3%) |
| $50,000 to $99,999 | 263 (15.2%) | 72 (8.7%) |
| $100,000 to $299,999 | 257 (14.9%) | 559 (67.6%) |
| $300,000 to $499,999 | 138 (8.0%) | 117 (14.1%) |
| $500,000 to $749,999 | 46 (2.7%) | 28 (3.4%) |
| $750,000 to $999,999 | 22 (1.3%) | 0 (0.0%) |
| $1,000,000 or more | 0 (0.0%) | 15 (1.8%) |
| Total | 1,729 (100.0%) | 827 (100.0%) |
Household Income by Mortgage Status in Brooksville
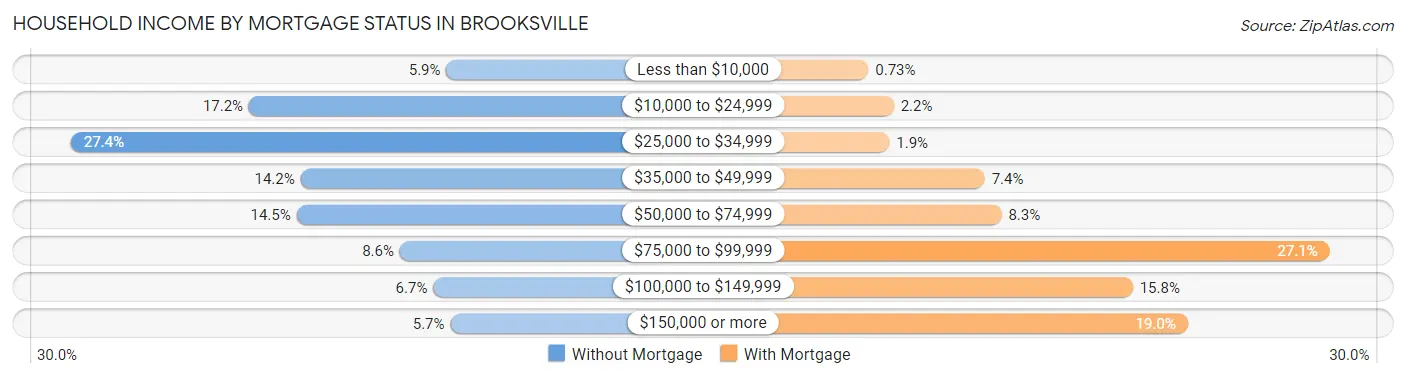
| Household Income | Without Mortgage | With Mortgage |
| Less than $10,000 | 102 (5.9%) | 6 (0.7%) |
| $10,000 to $24,999 | 297 (17.2%) | 18 (2.2%) |
| $25,000 to $34,999 | 473 (27.4%) | 16 (1.9%) |
| $35,000 to $49,999 | 246 (14.2%) | 61 (7.4%) |
| $50,000 to $74,999 | 250 (14.5%) | 69 (8.3%) |
| $75,000 to $99,999 | 148 (8.6%) | 224 (27.1%) |
| $100,000 to $149,999 | 115 (6.7%) | 131 (15.8%) |
| $150,000 or more | 98 (5.7%) | 157 (19.0%) |
| Total | 1,729 (100.0%) | 827 (100.0%) |
Property Value to Household Income Ratio in Brooksville
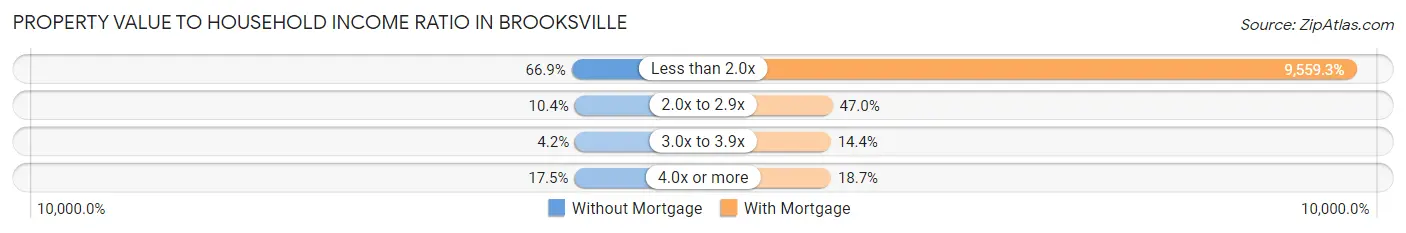
| Value-to-Income Ratio | Without Mortgage | With Mortgage |
| Less than 2.0x | 1,157 (66.9%) | 79,055 (9,559.3%) |
| 2.0x to 2.9x | 180 (10.4%) | 389 (47.0%) |
| 3.0x to 3.9x | 73 (4.2%) | 119 (14.4%) |
| 4.0x or more | 302 (17.5%) | 155 (18.7%) |
| Total | 1,729 (100.0%) | 827 (100.0%) |
Real Estate Taxes by Mortgage Status in Brooksville
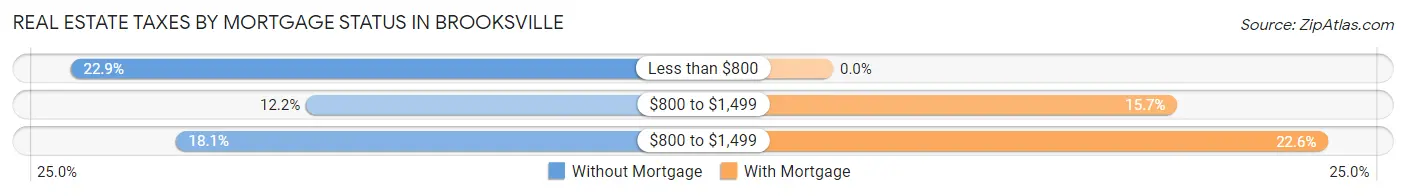
| Property Taxes | Without Mortgage | With Mortgage |
| Less than $800 | 396 (22.9%) | 0 (0.0%) |
| $800 to $1,499 | 210 (12.1%) | 130 (15.7%) |
| $800 to $1,499 | 313 (18.1%) | 187 (22.6%) |
| Total | 1,729 (100.0%) | 827 (100.0%) |
Health & Disability in Brooksville
Health Insurance Coverage by Age in Brooksville
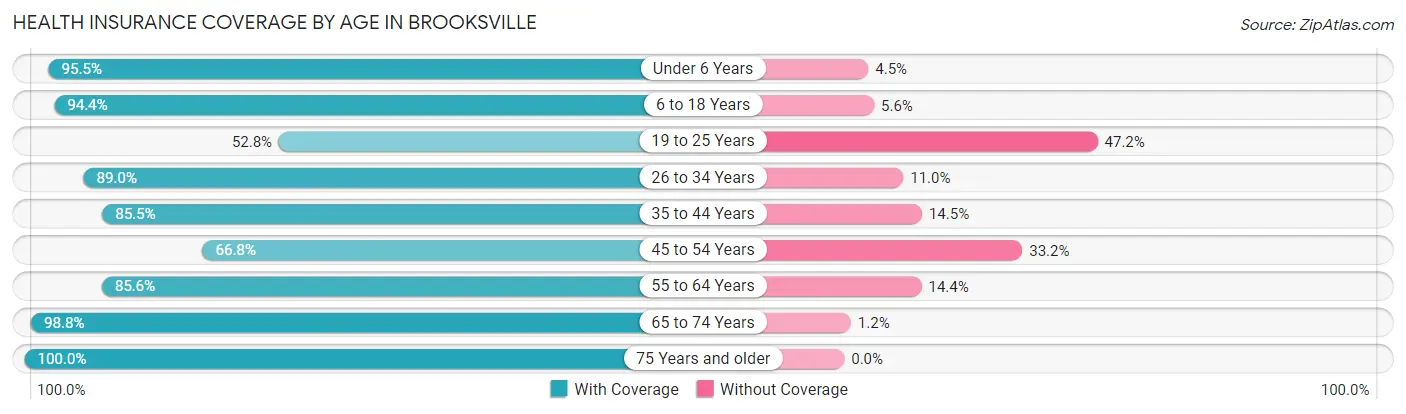
| Age Bracket | With Coverage | Without Coverage |
| Under 6 Years | 490 (95.5%) | 23 (4.5%) |
| 6 to 18 Years | 918 (94.4%) | 54 (5.6%) |
| 19 to 25 Years | 469 (52.8%) | 420 (47.2%) |
| 26 to 34 Years | 866 (89.0%) | 107 (11.0%) |
| 35 to 44 Years | 596 (85.5%) | 101 (14.5%) |
| 45 to 54 Years | 497 (66.8%) | 247 (33.2%) |
| 55 to 64 Years | 1,189 (85.6%) | 200 (14.4%) |
| 65 to 74 Years | 1,367 (98.8%) | 17 (1.2%) |
| 75 Years and older | 1,144 (100.0%) | 0 (0.0%) |
| Total | 7,536 (86.6%) | 1,169 (13.4%) |
Health Insurance Coverage by Citizenship Status in Brooksville
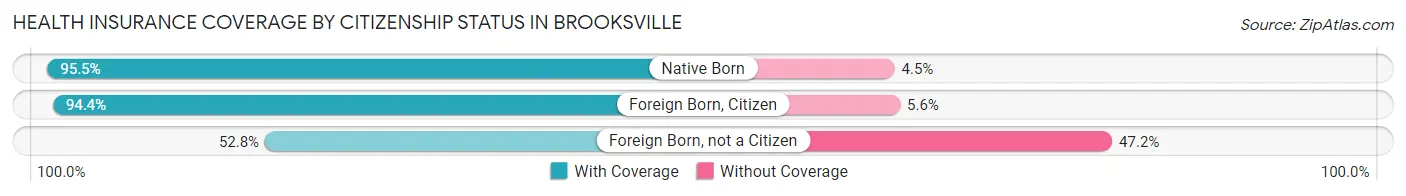
| Citizenship Status | With Coverage | Without Coverage |
| Native Born | 490 (95.5%) | 23 (4.5%) |
| Foreign Born, Citizen | 918 (94.4%) | 54 (5.6%) |
| Foreign Born, not a Citizen | 469 (52.8%) | 420 (47.2%) |
Health Insurance Coverage by Household Income in Brooksville
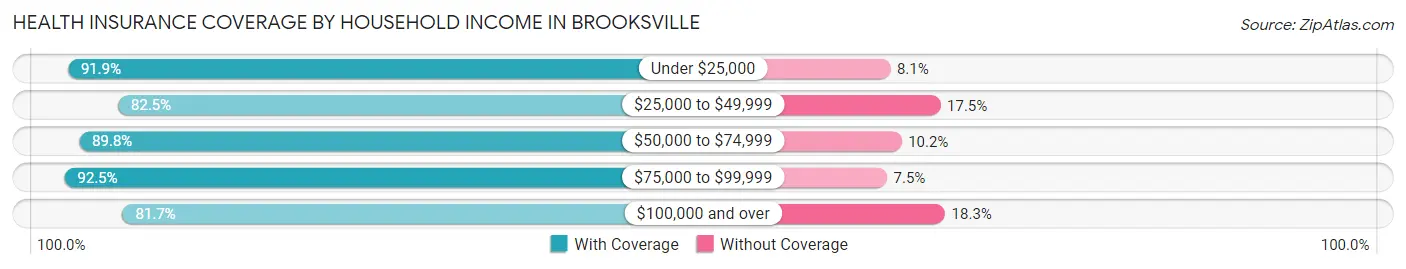
| Household Income | With Coverage | Without Coverage |
| Under $25,000 | 1,329 (91.9%) | 117 (8.1%) |
| $25,000 to $49,999 | 2,441 (82.5%) | 517 (17.5%) |
| $50,000 to $74,999 | 1,639 (89.8%) | 186 (10.2%) |
| $75,000 to $99,999 | 843 (92.5%) | 68 (7.5%) |
| $100,000 and over | 1,238 (81.7%) | 278 (18.3%) |
Public vs Private Health Insurance Coverage by Age in Brooksville
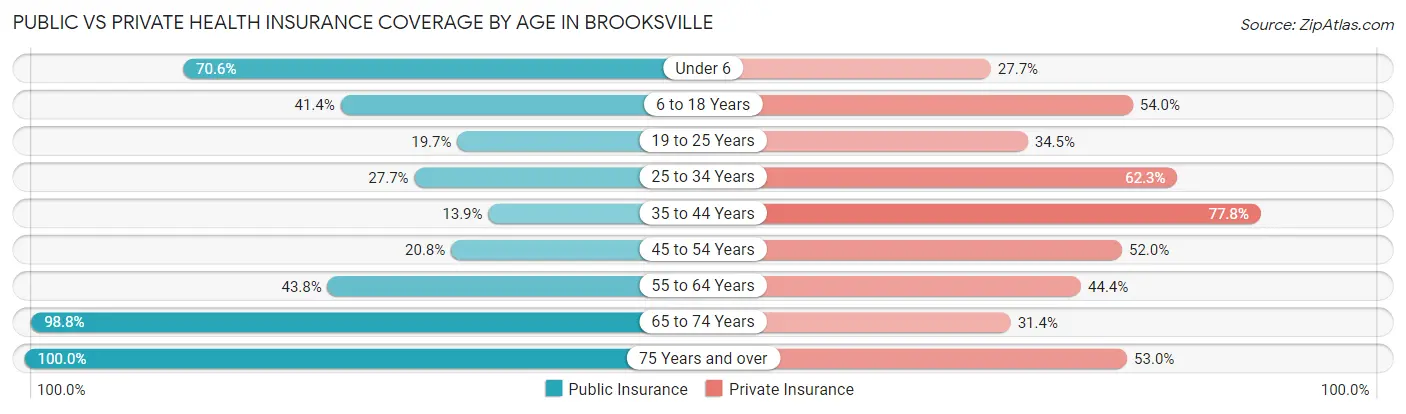
| Age Bracket | Public Insurance | Private Insurance |
| Under 6 | 362 (70.6%) | 142 (27.7%) |
| 6 to 18 Years | 402 (41.4%) | 525 (54.0%) |
| 19 to 25 Years | 175 (19.7%) | 307 (34.5%) |
| 25 to 34 Years | 269 (27.7%) | 606 (62.3%) |
| 35 to 44 Years | 97 (13.9%) | 542 (77.8%) |
| 45 to 54 Years | 155 (20.8%) | 387 (52.0%) |
| 55 to 64 Years | 608 (43.8%) | 617 (44.4%) |
| 65 to 74 Years | 1,367 (98.8%) | 434 (31.4%) |
| 75 Years and over | 1,144 (100.0%) | 606 (53.0%) |
| Total | 4,579 (52.6%) | 4,166 (47.9%) |
Disability Status by Sex by Age in Brooksville
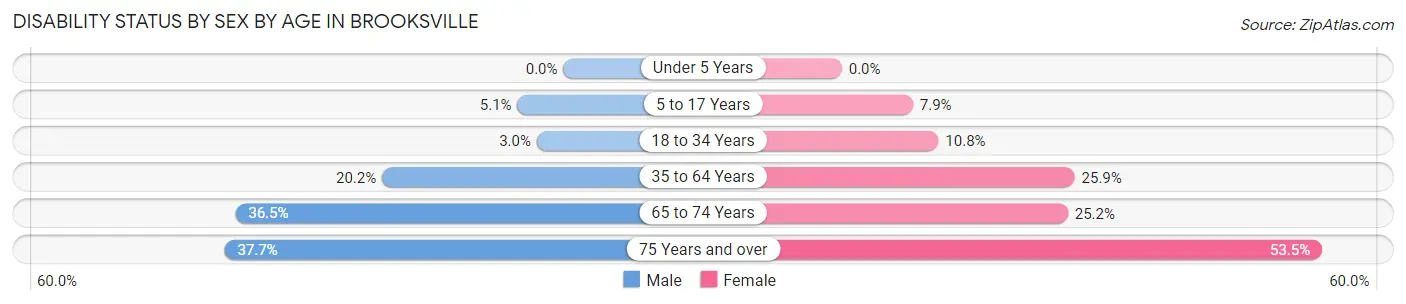
| Age Bracket | Male | Female |
| Under 5 Years | 0 (0.0%) | 0 (0.0%) |
| 5 to 17 Years | 28 (5.1%) | 31 (7.9%) |
| 18 to 34 Years | 23 (3.0%) | 127 (10.8%) |
| 35 to 64 Years | 235 (20.2%) | 432 (25.9%) |
| 65 to 74 Years | 240 (36.5%) | 183 (25.2%) |
| 75 Years and over | 177 (37.7%) | 361 (53.5%) |
Disability Class by Sex by Age in Brooksville
Disability Class: Hearing Difficulty
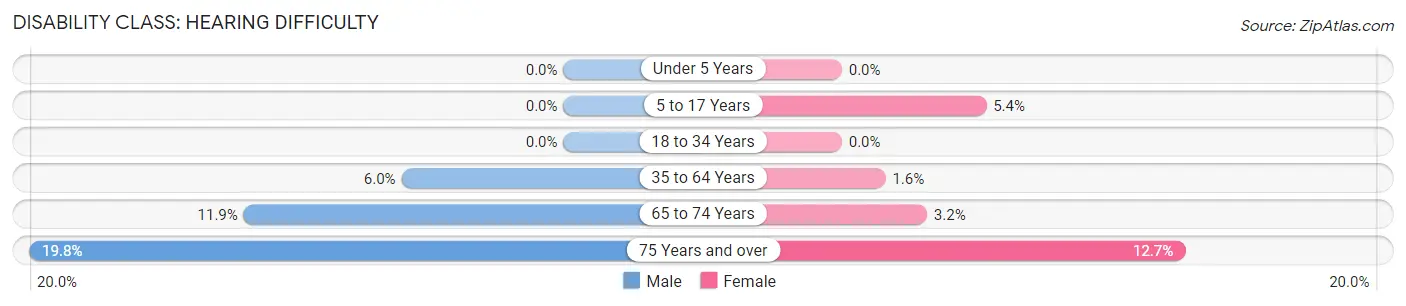
| Age Bracket | Male | Female |
| Under 5 Years | 0 (0.0%) | 0 (0.0%) |
| 5 to 17 Years | 0 (0.0%) | 21 (5.4%) |
| 18 to 34 Years | 0 (0.0%) | 0 (0.0%) |
| 35 to 64 Years | 70 (6.0%) | 27 (1.6%) |
| 65 to 74 Years | 78 (11.9%) | 23 (3.2%) |
| 75 Years and over | 93 (19.8%) | 86 (12.7%) |
Disability Class: Vision Difficulty
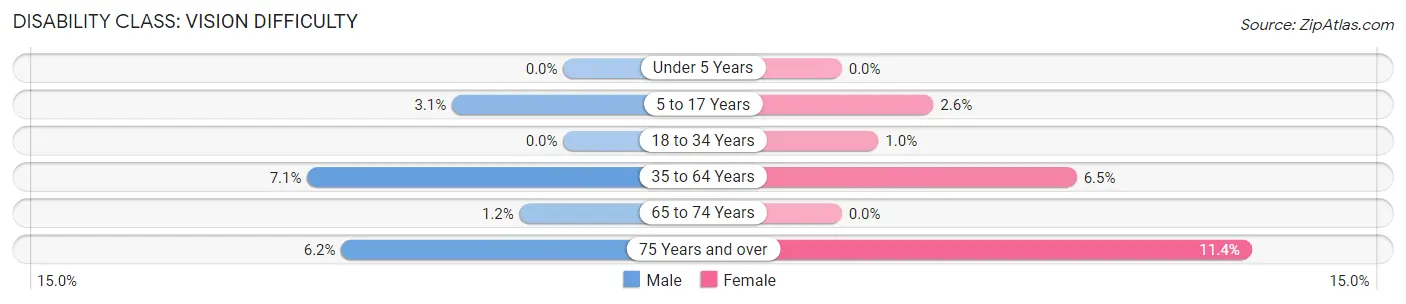
| Age Bracket | Male | Female |
| Under 5 Years | 0 (0.0%) | 0 (0.0%) |
| 5 to 17 Years | 17 (3.1%) | 10 (2.5%) |
| 18 to 34 Years | 0 (0.0%) | 12 (1.0%) |
| 35 to 64 Years | 83 (7.1%) | 109 (6.5%) |
| 65 to 74 Years | 8 (1.2%) | 0 (0.0%) |
| 75 Years and over | 29 (6.2%) | 77 (11.4%) |
Disability Class: Cognitive Difficulty
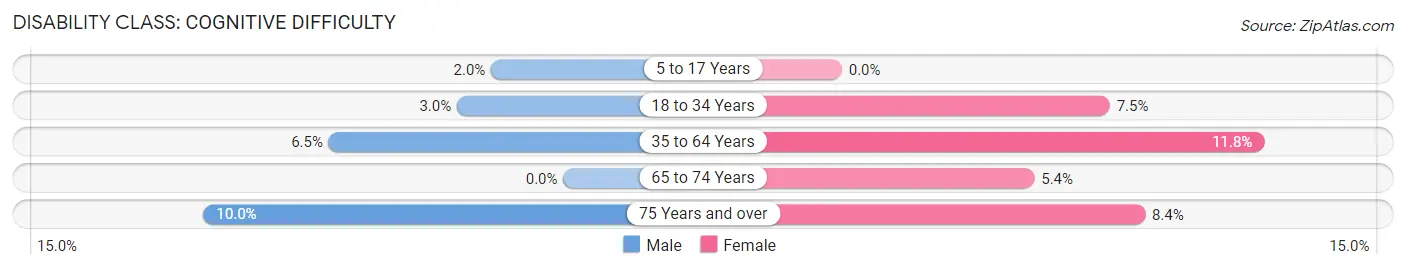
| Age Bracket | Male | Female |
| 5 to 17 Years | 11 (2.0%) | 0 (0.0%) |
| 18 to 34 Years | 23 (3.0%) | 88 (7.5%) |
| 35 to 64 Years | 76 (6.5%) | 196 (11.8%) |
| 65 to 74 Years | 0 (0.0%) | 39 (5.4%) |
| 75 Years and over | 47 (10.0%) | 57 (8.4%) |
Disability Class: Ambulatory Difficulty
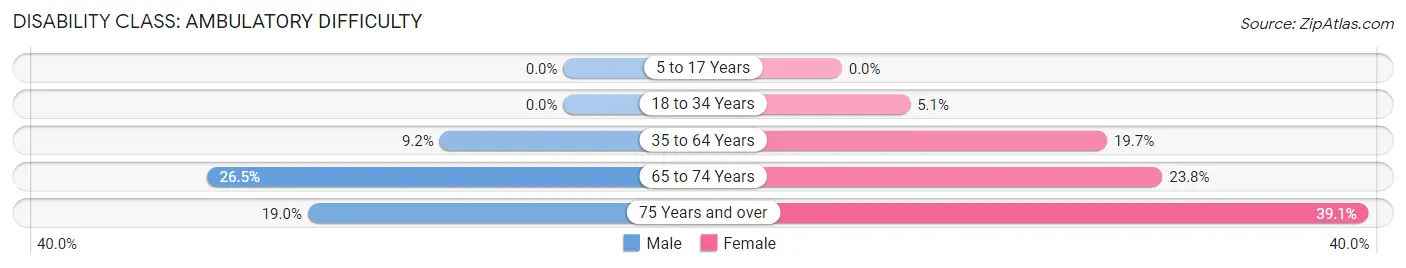
| Age Bracket | Male | Female |
| 5 to 17 Years | 0 (0.0%) | 0 (0.0%) |
| 18 to 34 Years | 0 (0.0%) | 60 (5.1%) |
| 35 to 64 Years | 107 (9.2%) | 328 (19.7%) |
| 65 to 74 Years | 174 (26.5%) | 173 (23.8%) |
| 75 Years and over | 89 (19.0%) | 264 (39.1%) |
Disability Class: Self-Care Difficulty
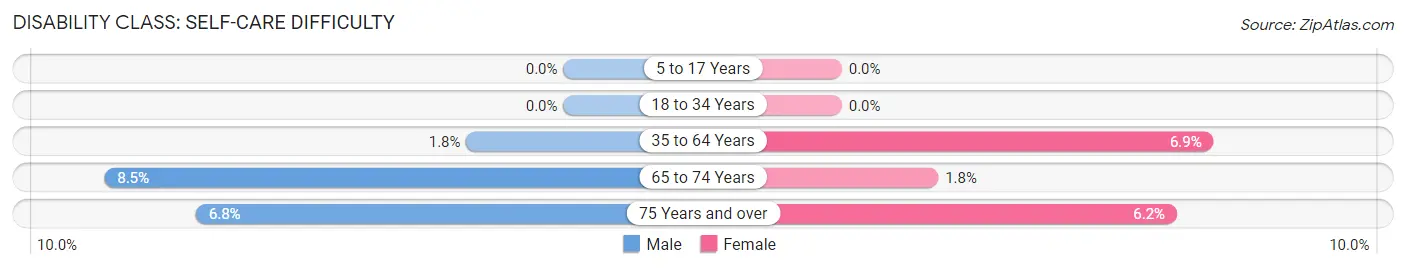
| Age Bracket | Male | Female |
| 5 to 17 Years | 0 (0.0%) | 0 (0.0%) |
| 18 to 34 Years | 0 (0.0%) | 0 (0.0%) |
| 35 to 64 Years | 21 (1.8%) | 115 (6.9%) |
| 65 to 74 Years | 56 (8.5%) | 13 (1.8%) |
| 75 Years and over | 32 (6.8%) | 42 (6.2%) |
Technology Access in Brooksville
Computing Device Access in Brooksville
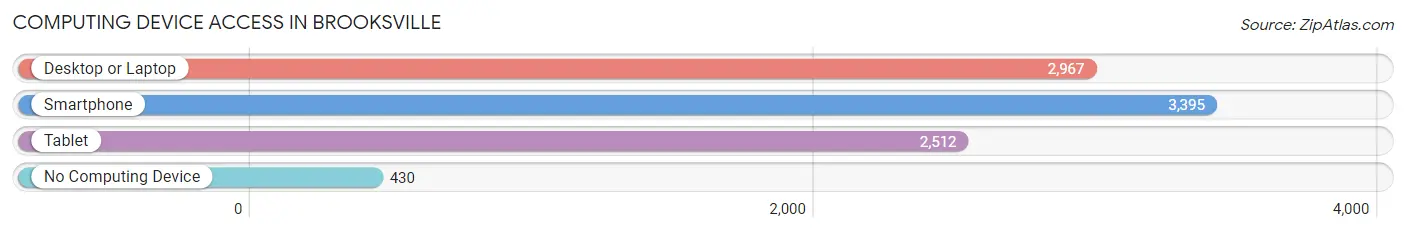
| Device Type | # Households | % Households |
| Desktop or Laptop | 2,967 | 69.8% |
| Smartphone | 3,395 | 79.9% |
| Tablet | 2,512 | 59.1% |
| No Computing Device | 430 | 10.1% |
| Total | 4,249 | 100.0% |
Internet Access in Brooksville
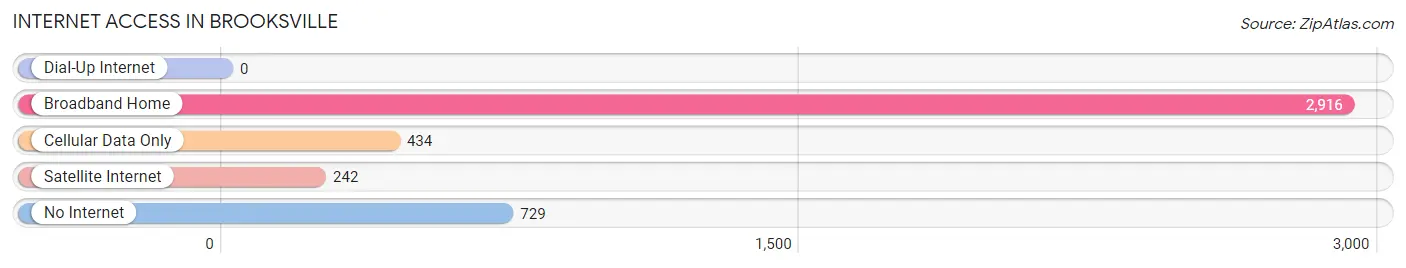
| Internet Type | # Households | % Households |
| Dial-Up Internet | 0 | 0.0% |
| Broadband Home | 2,916 | 68.6% |
| Cellular Data Only | 434 | 10.2% |
| Satellite Internet | 242 | 5.7% |
| No Internet | 729 | 17.2% |
| Total | 4,249 | 100.0% |
Brooksville Summary
Brooksville, Florida is a city located in Hernando County, Florida, United States. It is the county seat of Hernando County and is located approximately 50 miles north of Tampa. The population of Brooksville was 7,719 at the 2010 census, up from 7,264 at the 2000 census.
History
The area that is now Brooksville was first settled in 1845 by John May, who established a homestead near the present-day intersection of Cortez Boulevard and Broad Street. The settlement was originally known as Mayville, but was later renamed to honor Preston Brooks, a Confederate soldier who was killed in the Civil War.
In 1856, the Florida Legislature established Hernando County, with Brooksville as its county seat. The city was incorporated in 1880 and has since grown to become the largest city in Hernando County.
Geography
Brooksville is located in central Hernando County at 28°32'N 82°22'W (28.5333, -82.3667). It is bordered to the north by the city of Spring Hill, to the east by the city of Weeki Wachee, to the south by the city of Masaryktown, and to the west by the city of Ridge Manor.
According to the United States Census Bureau, the city has a total area of 8.2 square miles (21.2 km2), of which 8.1 square miles (21.0 km2) is land and 0.1 square miles (0.2 km2) (1.25%) is water.
Economy
The economy of Brooksville is largely based on agriculture and tourism. The city is home to several large farms, including the Florida Strawberry Growers Association, which is the largest strawberry producer in the state. The city is also home to several tourist attractions, including the Weeki Wachee Springs State Park, which is home to the world-famous Weeki Wachee mermaids.
Demographics
As of the 2010 census, there were 7,719 people, 2,945 households, and 1,945 families residing in the city. The population density was 951.2 people per square mile (367.7/km2). There were 3,279 housing units at an average density of 404.3 per square mile (156.2/km2). The racial makeup of the city was 79.2% White, 14.3% African American, 0.5% Native American, 1.2% Asian, 0.1% Pacific Islander, 2.7% from other races, and 2.1% from two or more races. Hispanic or Latino of any race were 8.3% of the population.
There were 2,945 households, out of which 28.2% had children under the age of 18 living with them, 44.2% were married couples living together, 15.7% had a female householder with no husband present, and 34.7% were non-families. 28.2% of all households were made up of individuals, and 12.3% had someone living alone who was 65 years of age or older. The average household size was 2.50 and the average family size was 3.04.
In the city, the population was spread out, with 24.2% under the age of 18, 8.7% from 18 to 24, 25.2% from 25 to 44, 24.2% from 45 to 64, and 17.7% who were 65 years of age or older. The median age was 38 years. For every 100 females, there were 93.2 males. For every 100 females age 18 and over, there were 89.2 males.
The median income for a household in the city was $30,917, and the median income for a family was $36,945. Males had a median income of $30,917 versus $21,917 for females. The per capita income for the city was $15,945. About 14.2% of families and 17.7% of the population were below the poverty line, including 25.2% of those under age 18 and 11.2% of those age 65 or over.
Common Questions
What is Per Capita Income in Brooksville?
Per Capita income in Brooksville is $32,758.
What is the Median Family Income in Brooksville?
Median Family Income in Brooksville is $52,024.
What is the Median Household income in Brooksville?
Median Household Income in Brooksville is $42,047.
What is Income or Wage Gap in Brooksville?
Income or Wage Gap in Brooksville is 23.7%.
Women in Brooksville earn 76.3 cents for every dollar earned by a man.
What is Family Income Deficit in Brooksville?
Family Income Deficit in Brooksville is $7,997.
Families that are below poverty line in Brooksville earn $7,997 less on average than the poverty threshold level.
What is Inequality or Gini Index in Brooksville?
Inequality or Gini Index in Brooksville is 0.51.
What is the Total Population of Brooksville?
Total Population of Brooksville is 8,981.
What is the Total Male Population of Brooksville?
Total Male Population of Brooksville is 3,977.
What is the Total Female Population of Brooksville?
Total Female Population of Brooksville is 5,004.
What is the Ratio of Males per 100 Females in Brooksville?
There are 79.48 Males per 100 Females in Brooksville.
What is the Ratio of Females per 100 Males in Brooksville?
There are 125.82 Females per 100 Males in Brooksville.
What is the Median Population Age in Brooksville?
Median Population Age in Brooksville is 52.3 Years.
What is the Average Family Size in Brooksville
Average Family Size in Brooksville is 2.6 People.
What is the Average Household Size in Brooksville
Average Household Size in Brooksville is 2.0 People.
How Large is the Labor Force in Brooksville?
There are 3,421 People in the Labor Forcein in Brooksville.
What is the Percentage of People in the Labor Force in Brooksville?
44.3% of People are in the Labor Force in Brooksville.
What is the Unemployment Rate in Brooksville?
Unemployment Rate in Brooksville is 4.4%.