Balm, FL Map & Demographics
Balm Map
Balm Overview
$33,489
PER CAPITA INCOME
$101,841
AVG FAMILY INCOME
$102,162
AVG HOUSEHOLD INCOME
20.0%
WAGE / INCOME GAP [ % ]
80.0¢/ $1
WAGE / INCOME GAP [ $ ]
0.30
INEQUALITY / GINI INDEX
5,397
TOTAL POPULATION
2,579
MALE POPULATION
2,818
FEMALE POPULATION
91.52
MALES / 100 FEMALES
109.27
FEMALES / 100 MALES
32.8
MEDIAN AGE
3.5
AVG FAMILY SIZE
3.2
AVG HOUSEHOLD SIZE
3,093
LABOR FORCE [ PEOPLE ]
72.6%
PERCENT IN LABOR FORCE
2.6%
UNEMPLOYMENT RATE
Balm Zip Codes
Balm Area Codes
Income in Balm
Income Overview in Balm
Per Capita Income in Balm is $33,489, while median incomes of families and households are $101,841 and $102,162 respectively.
| Characteristic | Number | Measure |
| Per Capita Income | 5,397 | $33,489 |
| Median Family Income | 1,355 | $101,841 |
| Mean Family Income | 1,355 | $106,025 |
| Median Household Income | 1,704 | $102,162 |
| Mean Household Income | 1,704 | $103,072 |
| Income Deficit | 1,355 | $0 |
| Wage / Income Gap (%) | 5,397 | 20.01% |
| Wage / Income Gap ($) | 5,397 | 79.99¢ per $1 |
| Gini / Inequality Index | 5,397 | 0.30 |
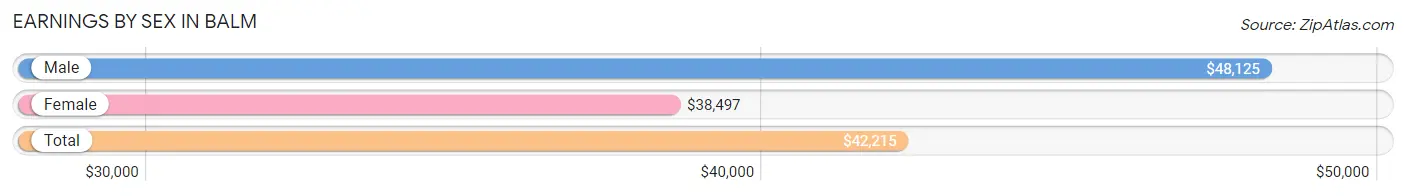
Earnings by Sex in Balm
Average Earnings in Balm are $42,215, $48,125 for men and $38,497 for women, a difference of 20.0%.
| Sex | Number | Average Earnings |
| Male | 1,711 (53.1%) | $48,125 |
| Female | 1,513 (46.9%) | $38,497 |
| Total | 3,224 (100.0%) | $42,215 |
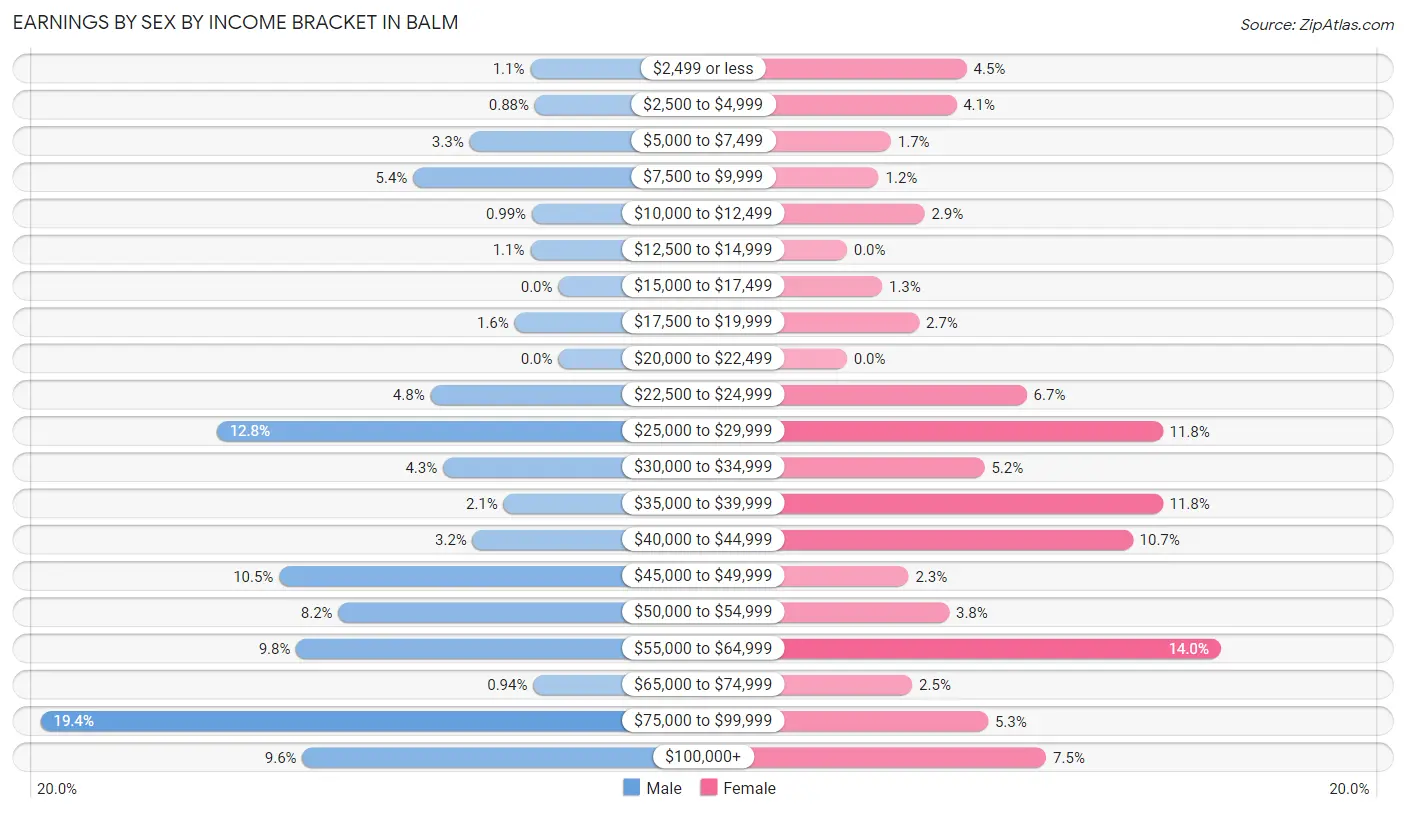
Earnings by Sex by Income Bracket in Balm
The most common earnings brackets in Balm are $75,000 to $99,999 for men (332 | 19.4%) and $55,000 to $64,999 for women (212 | 14.0%).
| Income | Male | Female |
| $2,499 or less | 18 (1.1%) | 68 (4.5%) |
| $2,500 to $4,999 | 15 (0.9%) | 62 (4.1%) |
| $5,000 to $7,499 | 57 (3.3%) | 25 (1.7%) |
| $7,500 to $9,999 | 93 (5.4%) | 18 (1.2%) |
| $10,000 to $12,499 | 17 (1.0%) | 44 (2.9%) |
| $12,500 to $14,999 | 18 (1.1%) | 0 (0.0%) |
| $15,000 to $17,499 | 0 (0.0%) | 20 (1.3%) |
| $17,500 to $19,999 | 28 (1.6%) | 41 (2.7%) |
| $20,000 to $22,499 | 0 (0.0%) | 0 (0.0%) |
| $22,500 to $24,999 | 82 (4.8%) | 102 (6.7%) |
| $25,000 to $29,999 | 219 (12.8%) | 179 (11.8%) |
| $30,000 to $34,999 | 74 (4.3%) | 78 (5.2%) |
| $35,000 to $39,999 | 35 (2.1%) | 179 (11.8%) |
| $40,000 to $44,999 | 55 (3.2%) | 162 (10.7%) |
| $45,000 to $49,999 | 179 (10.5%) | 35 (2.3%) |
| $50,000 to $54,999 | 141 (8.2%) | 58 (3.8%) |
| $55,000 to $64,999 | 168 (9.8%) | 212 (14.0%) |
| $65,000 to $74,999 | 16 (0.9%) | 37 (2.5%) |
| $75,000 to $99,999 | 332 (19.4%) | 80 (5.3%) |
| $100,000+ | 164 (9.6%) | 113 (7.5%) |
| Total | 1,711 (100.0%) | 1,513 (100.0%) |
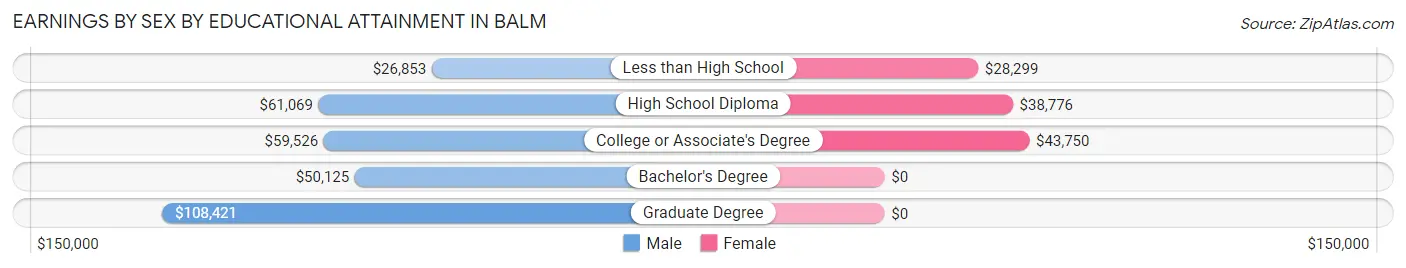
Earnings by Sex by Educational Attainment in Balm
Average earnings in Balm are $52,780 for men and $40,807 for women, a difference of 22.7%. Men with an educational attainment of graduate degree enjoy the highest average annual earnings of $108,421, while those with less than high school education earn the least with $26,853. Women with an educational attainment of college or associate's degree earn the most with the average annual earnings of $43,750, while those with less than high school education have the smallest earnings of $28,299.
| Educational Attainment | Male Income | Female Income |
| Less than High School | $26,853 | $28,299 |
| High School Diploma | $61,069 | $38,776 |
| College or Associate's Degree | $59,526 | $43,750 |
| Bachelor's Degree | $50,125 | $0 |
| Graduate Degree | $108,421 | $0 |
| Total | $52,780 | $40,807 |
Family Income in Balm
Family Income Brackets in Balm
According to the Balm family income data, there are 551 families falling into the $100,000 to $149,999 income range, which is the most common income bracket and makes up 40.7% of all families.
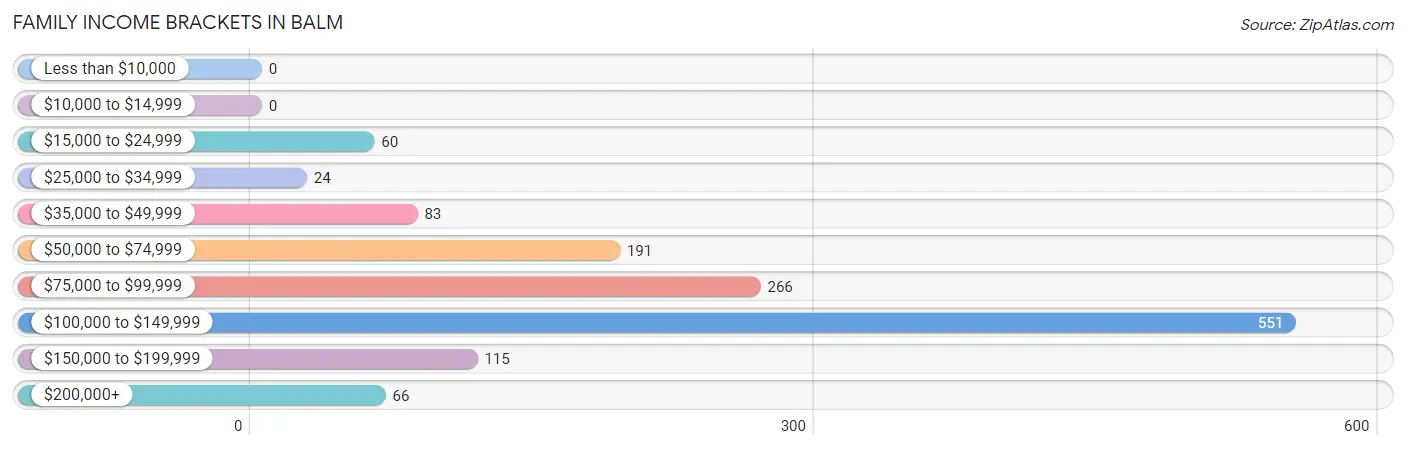
| Income Bracket | # Families | % Families |
| Less than $10,000 | 0 | 0.0% |
| $10,000 to $14,999 | 0 | 0.0% |
| $15,000 to $24,999 | 60 | 4.4% |
| $25,000 to $34,999 | 24 | 1.8% |
| $35,000 to $49,999 | 83 | 6.1% |
| $50,000 to $74,999 | 191 | 14.1% |
| $75,000 to $99,999 | 266 | 19.6% |
| $100,000 to $149,999 | 551 | 40.7% |
| $150,000 to $199,999 | 115 | 8.5% |
| $200,000+ | 66 | 4.9% |
Family Income by Famaliy Size in Balm
4-person families (381 | 28.1%) account for the highest median family income in Balm with $123,301 per family, while 2-person families (496 | 36.6%) have the highest median income of $44,676 per family member.
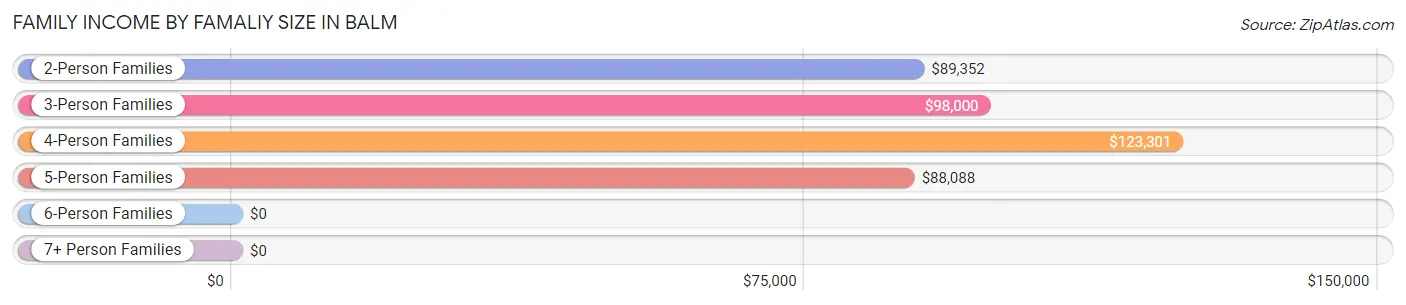
| Income Bracket | # Families | Median Income |
| 2-Person Families | 496 (36.6%) | $89,352 |
| 3-Person Families | 270 (19.9%) | $98,000 |
| 4-Person Families | 381 (28.1%) | $123,301 |
| 5-Person Families | 108 (8.0%) | $88,088 |
| 6-Person Families | 68 (5.0%) | $0 |
| 7+ Person Families | 32 (2.4%) | $0 |
| Total | 1,355 (100.0%) | $101,841 |
Family Income by Number of Earners in Balm
The median family income in Balm is $101,841, with families comprising 2 earners (644) having the highest median family income of $118,906, while families with no earners (120) have the lowest median family income of $39,167, accounting for 47.5% and 8.9% of families, respectively.
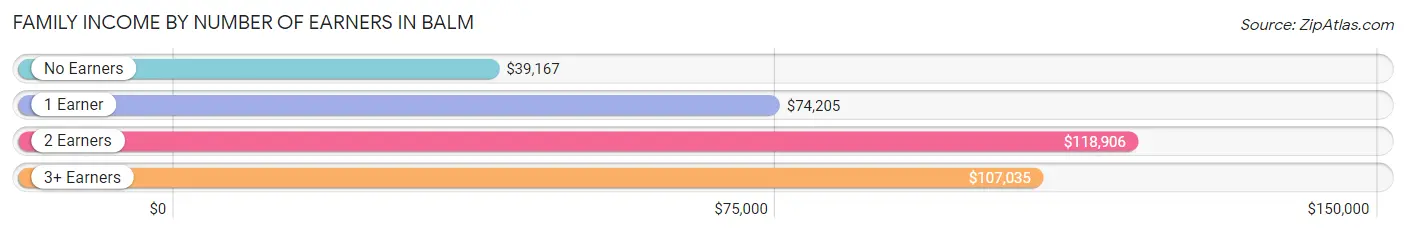
| Number of Earners | # Families | Median Income |
| No Earners | 120 (8.9%) | $39,167 |
| 1 Earner | 323 (23.8%) | $74,205 |
| 2 Earners | 644 (47.5%) | $118,906 |
| 3+ Earners | 268 (19.8%) | $107,035 |
| Total | 1,355 (100.0%) | $101,841 |
Household Income in Balm
Household Income Brackets in Balm
With 683 households falling in the category, the $100,000 to $149,999 income range is the most frequent in Balm, accounting for 40.1% of all households. In contrast, only 12 households (0.7%) fall into the less than $10,000 income bracket, making it the least populous group.
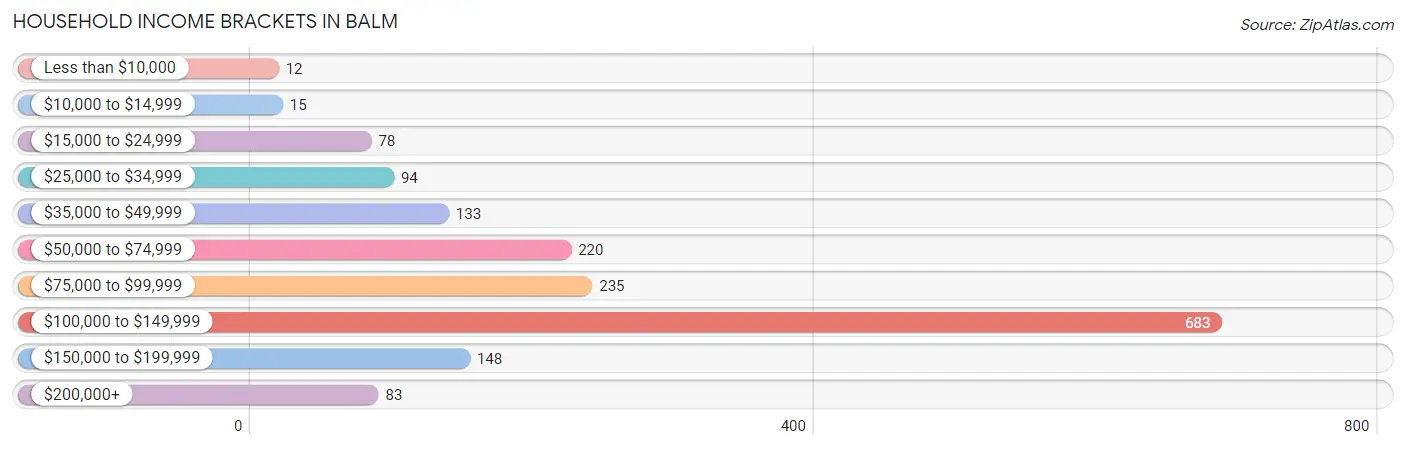
| Income Bracket | # Households | % Households |
| Less than $10,000 | 12 | 0.7% |
| $10,000 to $14,999 | 15 | 0.9% |
| $15,000 to $24,999 | 78 | 4.6% |
| $25,000 to $34,999 | 94 | 5.5% |
| $35,000 to $49,999 | 133 | 7.8% |
| $50,000 to $74,999 | 220 | 12.9% |
| $75,000 to $99,999 | 235 | 13.8% |
| $100,000 to $149,999 | 683 | 40.1% |
| $150,000 to $199,999 | 148 | 8.7% |
| $200,000+ | 83 | 4.9% |
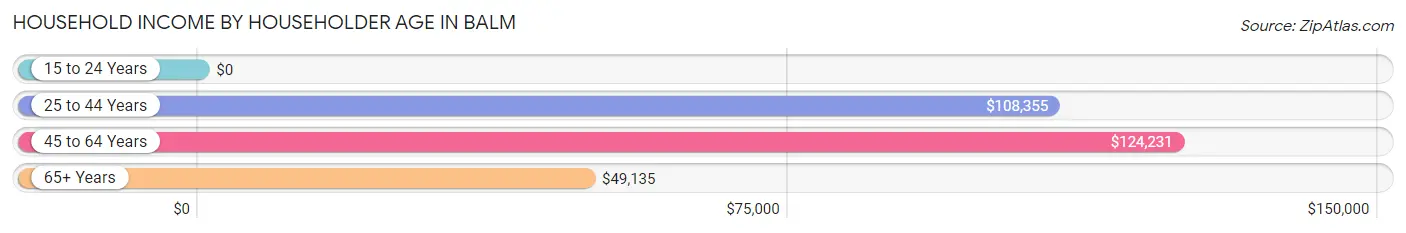
Household Income by Householder Age in Balm
The median household income in Balm is $102,162, with the highest median household income of $124,231 found in the 45 to 64 years age bracket for the primary householder. A total of 482 households (28.3%) fall into this category.
| Income Bracket | # Households | Median Income |
| 15 to 24 Years | 0 (0.0%) | $0 |
| 25 to 44 Years | 917 (53.8%) | $108,355 |
| 45 to 64 Years | 482 (28.3%) | $124,231 |
| 65+ Years | 305 (17.9%) | $49,135 |
| Total | 1,704 (100.0%) | $102,162 |
Poverty in Balm
Income Below Poverty by Sex and Age in Balm
With 2.6% poverty level for males and 6.1% for females among the residents of Balm, 75 year old and over males and 75 year old and over females are the most vulnerable to poverty, with 23 males (25.8%) and 24 females (52.2%) in their respective age groups living below the poverty level.
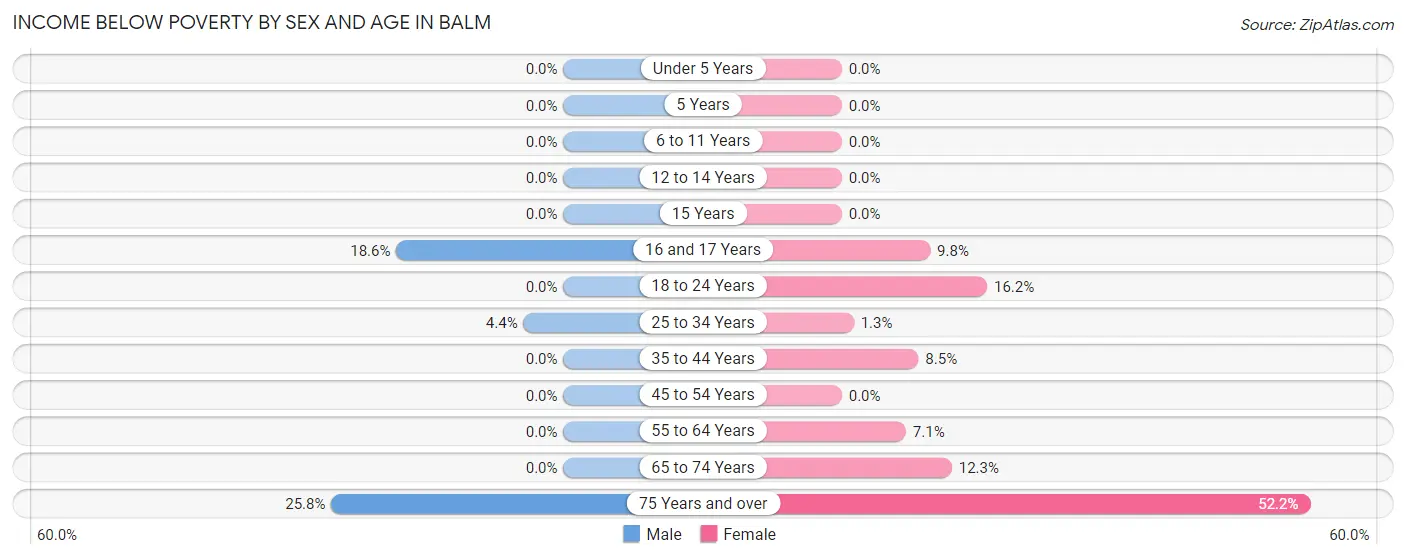
| Age Bracket | Male | Female |
| Under 5 Years | 0 (0.0%) | 0 (0.0%) |
| 5 Years | 0 (0.0%) | 0 (0.0%) |
| 6 to 11 Years | 0 (0.0%) | 0 (0.0%) |
| 12 to 14 Years | 0 (0.0%) | 0 (0.0%) |
| 15 Years | 0 (0.0%) | 0 (0.0%) |
| 16 and 17 Years | 16 (18.6%) | 19 (9.8%) |
| 18 to 24 Years | 0 (0.0%) | 28 (16.2%) |
| 25 to 34 Years | 28 (4.4%) | 7 (1.3%) |
| 35 to 44 Years | 0 (0.0%) | 51 (8.5%) |
| 45 to 54 Years | 0 (0.0%) | 0 (0.0%) |
| 55 to 64 Years | 0 (0.0%) | 12 (7.1%) |
| 65 to 74 Years | 0 (0.0%) | 31 (12.2%) |
| 75 Years and over | 23 (25.8%) | 24 (52.2%) |
| Total | 67 (2.6%) | 172 (6.1%) |
Income Above Poverty by Sex and Age in Balm
According to the poverty statistics in Balm, males aged under 5 years and females aged under 5 years are the age groups that are most secure financially, with 100.0% of males and 100.0% of females in these age groups living above the poverty line.
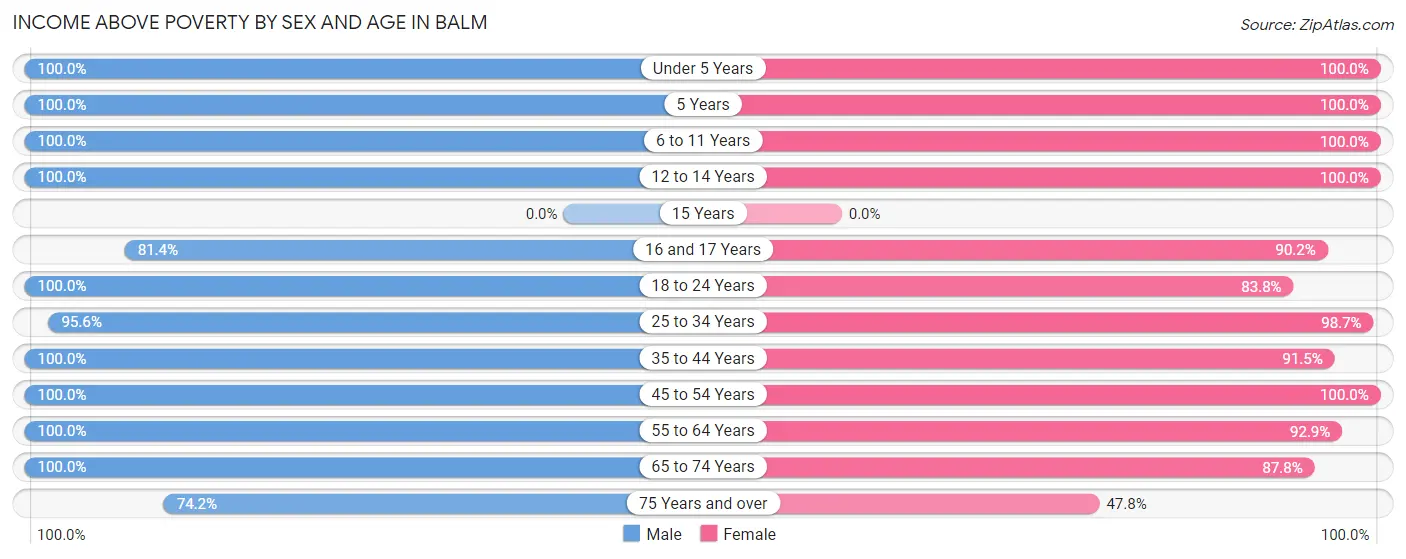
| Age Bracket | Male | Female |
| Under 5 Years | 178 (100.0%) | 254 (100.0%) |
| 5 Years | 10 (100.0%) | 43 (100.0%) |
| 6 to 11 Years | 257 (100.0%) | 266 (100.0%) |
| 12 to 14 Years | 39 (100.0%) | 67 (100.0%) |
| 15 Years | 0 (0.0%) | 0 (0.0%) |
| 16 and 17 Years | 70 (81.4%) | 174 (90.2%) |
| 18 to 24 Years | 241 (100.0%) | 145 (83.8%) |
| 25 to 34 Years | 602 (95.6%) | 518 (98.7%) |
| 35 to 44 Years | 310 (100.0%) | 547 (91.5%) |
| 45 to 54 Years | 355 (100.0%) | 209 (100.0%) |
| 55 to 64 Years | 218 (100.0%) | 156 (92.9%) |
| 65 to 74 Years | 166 (100.0%) | 222 (87.7%) |
| 75 Years and over | 66 (74.2%) | 22 (47.8%) |
| Total | 2,512 (97.4%) | 2,623 (93.9%) |
Income Below Poverty Among Married-Couple Families in Balm
The poverty statistics for married-couple families in Balm show that 2.1% or 23 of the total 1,088 families live below the poverty line. Families with no children have the highest poverty rate of 4.8%, comprising of 23 families. On the other hand, families with 1 or 2 children have the lowest poverty rate of 0.0%, which includes 0 families.
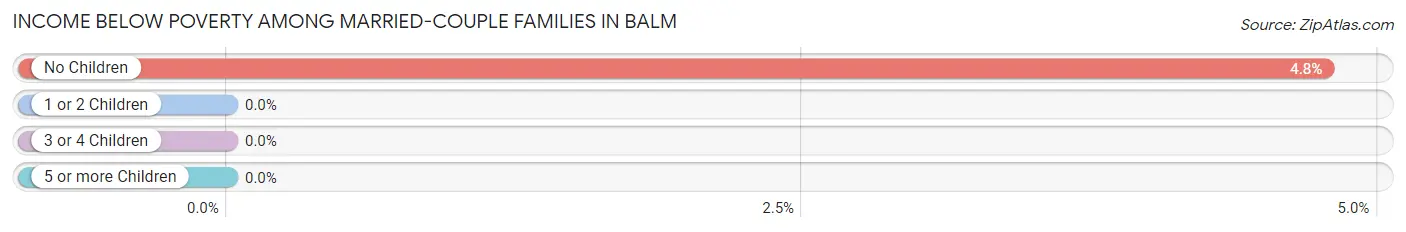
| Children | Above Poverty | Below Poverty |
| No Children | 459 (95.2%) | 23 (4.8%) |
| 1 or 2 Children | 480 (100.0%) | 0 (0.0%) |
| 3 or 4 Children | 126 (100.0%) | 0 (0.0%) |
| 5 or more Children | 0 (0.0%) | 0 (0.0%) |
| Total | 1,065 (97.9%) | 23 (2.1%) |
Income Below Poverty Among Single-Parent Households in Balm
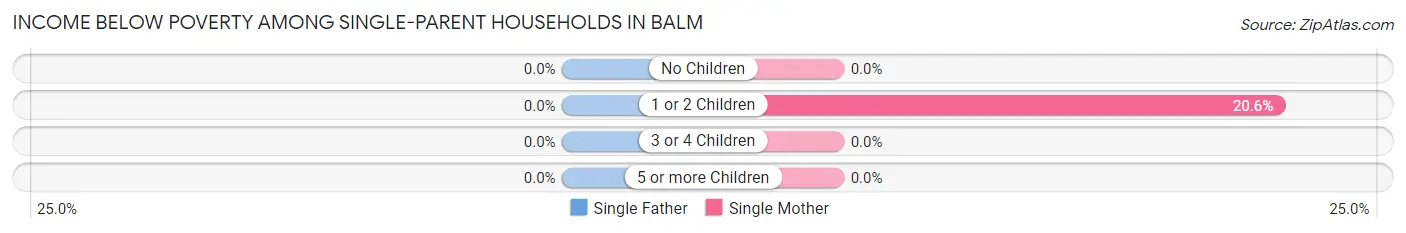
| Children | Single Father | Single Mother |
| No Children | 0 (0.0%) | 0 (0.0%) |
| 1 or 2 Children | 0 (0.0%) | 15 (20.5%) |
| 3 or 4 Children | 0 (0.0%) | 0 (0.0%) |
| 5 or more Children | 0 (0.0%) | 0 (0.0%) |
| Total | 0 (0.0%) | 15 (8.9%) |
Income Below Poverty Among Married-Couple vs Single-Parent Households in Balm
The poverty data for Balm shows that 23 of the married-couple family households (2.1%) and 15 of the single-parent households (5.6%) are living below the poverty level. Within the married-couple family households, those with no children have the highest poverty rate, with 23 households (4.8%) falling below the poverty line. Among the single-parent households, those with 1 or 2 children have the highest poverty rate, with 15 household (9.6%) living below poverty.
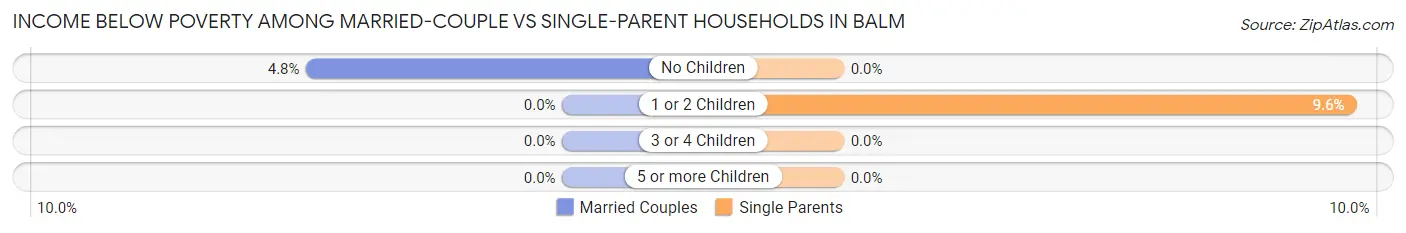
| Children | Married-Couple Families | Single-Parent Households |
| No Children | 23 (4.8%) | 0 (0.0%) |
| 1 or 2 Children | 0 (0.0%) | 15 (9.6%) |
| 3 or 4 Children | 0 (0.0%) | 0 (0.0%) |
| 5 or more Children | 0 (0.0%) | 0 (0.0%) |
| Total | 23 (2.1%) | 15 (5.6%) |
Race in Balm
The most populous races in Balm are White / Caucasian (2,155 | 39.9%), Black / African American (1,714 | 31.8%), and Hispanic or Latino (1,526 | 28.3%).
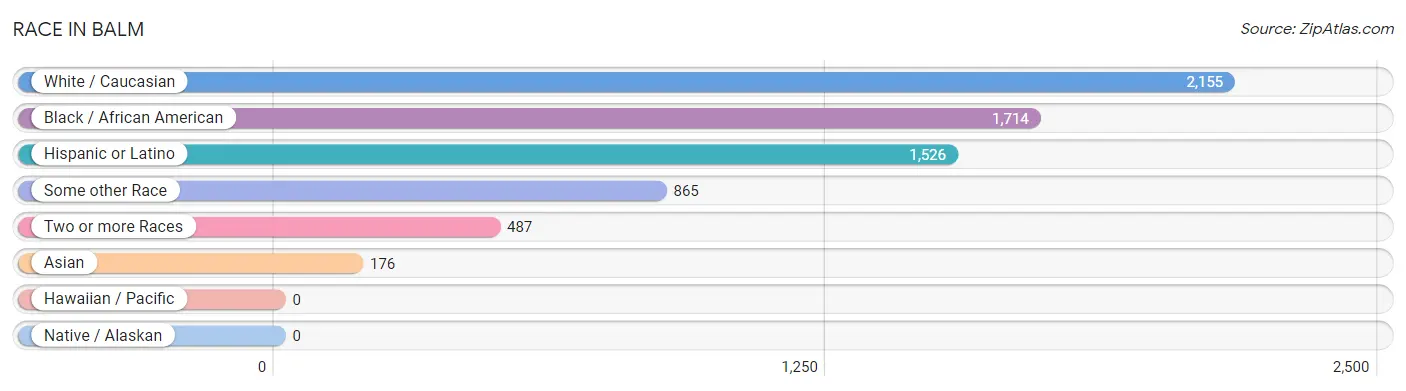
| Race | # Population | % Population |
| Asian | 176 | 3.3% |
| Black / African American | 1,714 | 31.8% |
| Hawaiian / Pacific | 0 | 0.0% |
| Hispanic or Latino | 1,526 | 28.3% |
| Native / Alaskan | 0 | 0.0% |
| White / Caucasian | 2,155 | 39.9% |
| Two or more Races | 487 | 9.0% |
| Some other Race | 865 | 16.0% |
| Total | 5,397 | 100.0% |
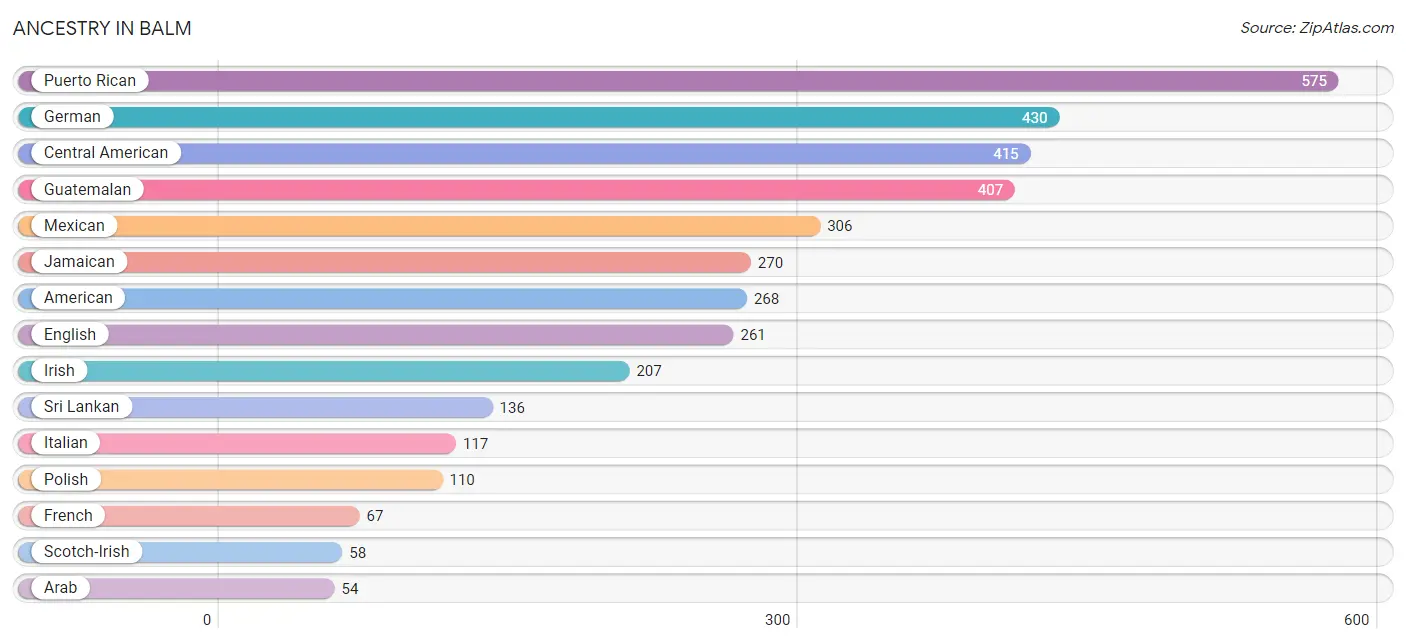
Ancestry in Balm
The most populous ancestries reported in Balm are Puerto Rican (575 | 10.6%), German (430 | 8.0%), Central American (415 | 7.7%), Guatemalan (407 | 7.5%), and Mexican (306 | 5.7%), together accounting for 39.5% of all Balm residents.
| Ancestry | # Population | % Population |
| American | 268 | 5.0% |
| Arab | 54 | 1.0% |
| Argentinean | 19 | 0.4% |
| Australian | 18 | 0.3% |
| Austrian | 36 | 0.7% |
| Barbadian | 43 | 0.8% |
| Bhutanese | 13 | 0.2% |
| British | 51 | 0.9% |
| Canadian | 8 | 0.2% |
| Central American | 415 | 7.7% |
| Cuban | 18 | 0.3% |
| Danish | 16 | 0.3% |
| Dominican | 45 | 0.8% |
| Dutch | 17 | 0.3% |
| English | 261 | 4.8% |
| Ethiopian | 17 | 0.3% |
| European | 12 | 0.2% |
| Finnish | 10 | 0.2% |
| French | 67 | 1.2% |
| French Canadian | 15 | 0.3% |
| German | 430 | 8.0% |
| Guatemalan | 407 | 7.5% |
| Guyanese | 16 | 0.3% |
| Haitian | 48 | 0.9% |
| Indian (Asian) | 42 | 0.8% |
| Irish | 207 | 3.8% |
| Italian | 117 | 2.2% |
| Jamaican | 270 | 5.0% |
| Korean | 14 | 0.3% |
| Mexican | 306 | 5.7% |
| Moroccan | 54 | 1.0% |
| Norwegian | 10 | 0.2% |
| Pakistani | 12 | 0.2% |
| Panamanian | 8 | 0.2% |
| Polish | 110 | 2.0% |
| Portuguese | 17 | 0.3% |
| Puerto Rican | 575 | 10.6% |
| Scotch-Irish | 58 | 1.1% |
| South American | 19 | 0.4% |
| Sri Lankan | 136 | 2.5% |
| Subsaharan African | 17 | 0.3% |
| Swedish | 7 | 0.1% |
| Swiss | 36 | 0.7% |
| Thai | 16 | 0.3% |
| Welsh | 12 | 0.2% |
| Yup'ik | 11 | 0.2% | View All 46 Rows |
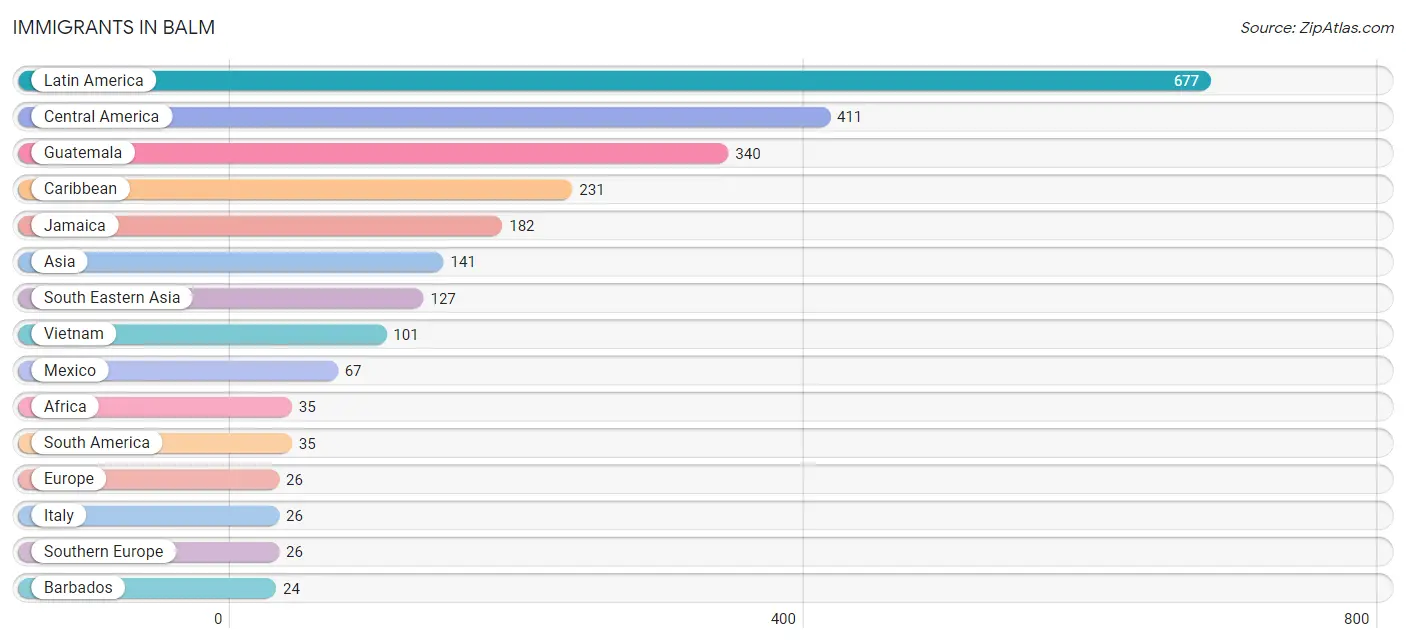
Immigrants in Balm
The most numerous immigrant groups reported in Balm came from Latin America (677 | 12.5%), Central America (411 | 7.6%), Guatemala (340 | 6.3%), Caribbean (231 | 4.3%), and Jamaica (182 | 3.4%), together accounting for 34.1% of all Balm residents.
| Immigration Origin | # Population | % Population |
| Africa | 35 | 0.6% |
| Argentina | 19 | 0.4% |
| Asia | 141 | 2.6% |
| Barbados | 24 | 0.4% |
| Caribbean | 231 | 4.3% |
| Central America | 411 | 7.6% |
| Dominican Republic | 6 | 0.1% |
| Eastern Africa | 17 | 0.3% |
| Ethiopia | 17 | 0.3% |
| Europe | 26 | 0.5% |
| Guatemala | 340 | 6.3% |
| Guyana | 16 | 0.3% |
| Haiti | 19 | 0.4% |
| Italy | 26 | 0.5% |
| Jamaica | 182 | 3.4% |
| Latin America | 677 | 12.5% |
| Mexico | 67 | 1.2% |
| Morocco | 18 | 0.3% |
| Northern Africa | 18 | 0.3% |
| Pakistan | 14 | 0.3% |
| Panama | 4 | 0.1% |
| Philippines | 14 | 0.3% |
| South America | 35 | 0.6% |
| South Central Asia | 14 | 0.3% |
| South Eastern Asia | 127 | 2.4% |
| Southern Europe | 26 | 0.5% |
| Thailand | 12 | 0.2% |
| Vietnam | 101 | 1.9% | View All 28 Rows |
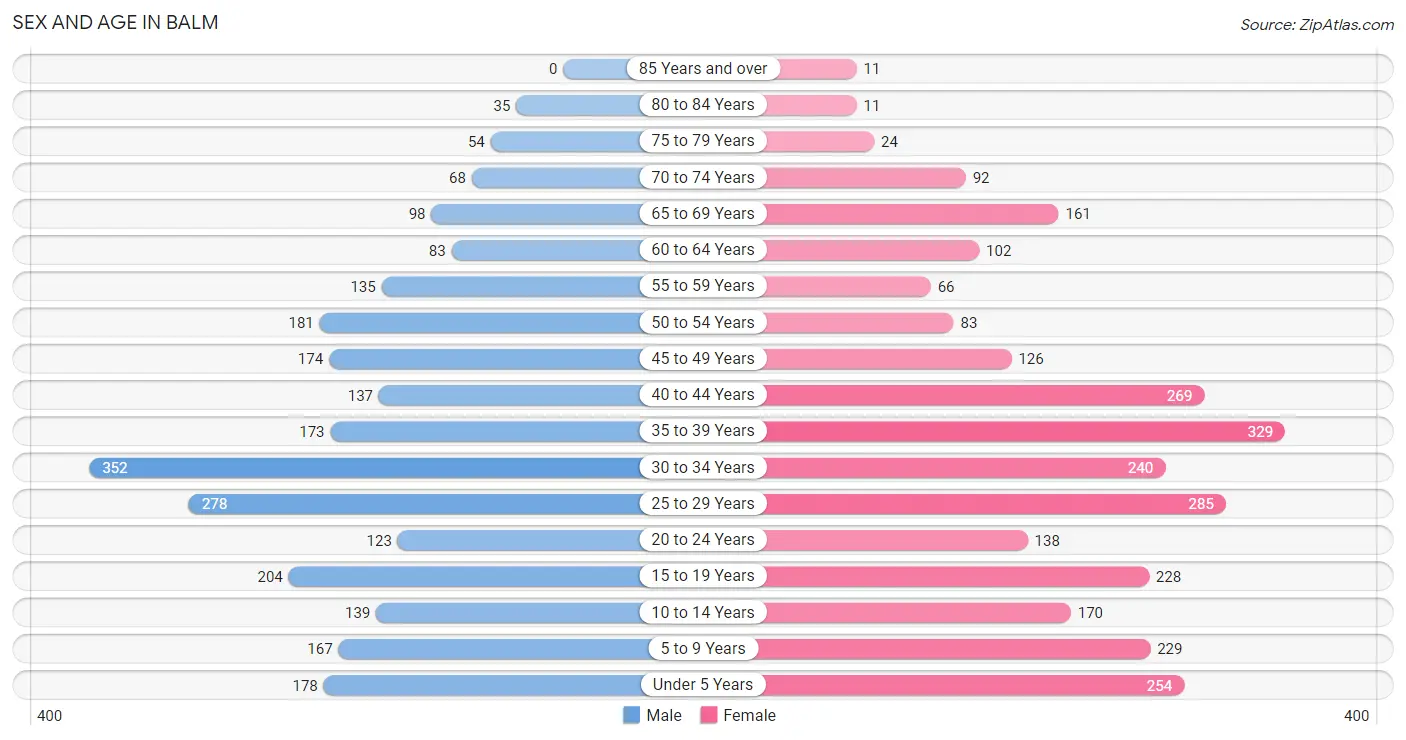
Sex and Age in Balm
Sex and Age in Balm
The most populous age groups in Balm are 30 to 34 Years (352 | 13.7%) for men and 35 to 39 Years (329 | 11.7%) for women.
| Age Bracket | Male | Female |
| Under 5 Years | 178 (6.9%) | 254 (9.0%) |
| 5 to 9 Years | 167 (6.5%) | 229 (8.1%) |
| 10 to 14 Years | 139 (5.4%) | 170 (6.0%) |
| 15 to 19 Years | 204 (7.9%) | 228 (8.1%) |
| 20 to 24 Years | 123 (4.8%) | 138 (4.9%) |
| 25 to 29 Years | 278 (10.8%) | 285 (10.1%) |
| 30 to 34 Years | 352 (13.7%) | 240 (8.5%) |
| 35 to 39 Years | 173 (6.7%) | 329 (11.7%) |
| 40 to 44 Years | 137 (5.3%) | 269 (9.6%) |
| 45 to 49 Years | 174 (6.8%) | 126 (4.5%) |
| 50 to 54 Years | 181 (7.0%) | 83 (2.9%) |
| 55 to 59 Years | 135 (5.2%) | 66 (2.3%) |
| 60 to 64 Years | 83 (3.2%) | 102 (3.6%) |
| 65 to 69 Years | 98 (3.8%) | 161 (5.7%) |
| 70 to 74 Years | 68 (2.6%) | 92 (3.3%) |
| 75 to 79 Years | 54 (2.1%) | 24 (0.9%) |
| 80 to 84 Years | 35 (1.4%) | 11 (0.4%) |
| 85 Years and over | 0 (0.0%) | 11 (0.4%) |
| Total | 2,579 (100.0%) | 2,818 (100.0%) |
Families and Households in Balm
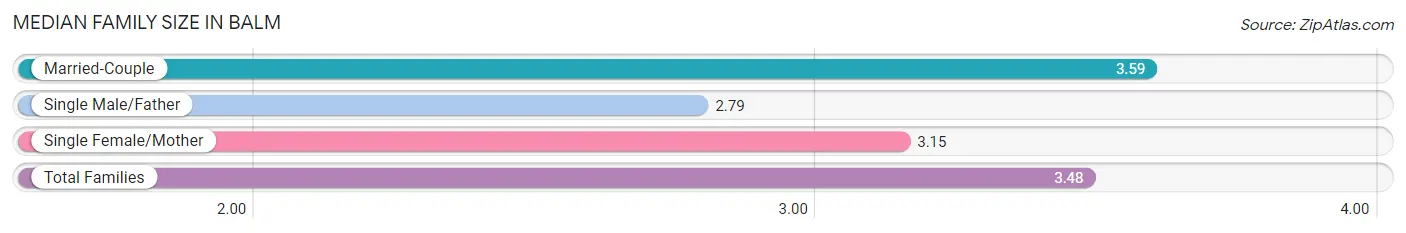
Median Family Size in Balm
The median family size in Balm is 3.48 persons per family, with married-couple families (1,088 | 80.3%) accounting for the largest median family size of 3.59 persons per family. On the other hand, single male/father families (99 | 7.3%) represent the smallest median family size with 2.79 persons per family.
| Family Type | # Families | Family Size |
| Married-Couple | 1,088 (80.3%) | 3.59 |
| Single Male/Father | 99 (7.3%) | 2.79 |
| Single Female/Mother | 168 (12.4%) | 3.15 |
| Total Families | 1,355 (100.0%) | 3.48 |
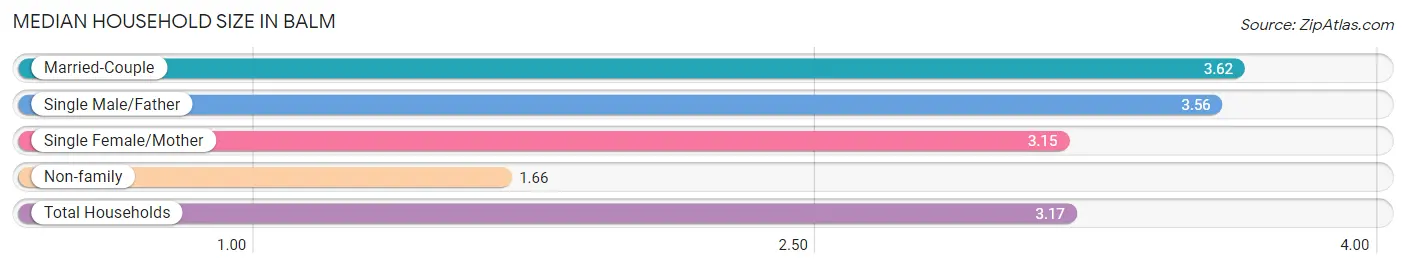
Median Household Size in Balm
The median household size in Balm is 3.17 persons per household, with married-couple households (1,088 | 63.8%) accounting for the largest median household size of 3.62 persons per household. non-family households (349 | 20.5%) represent the smallest median household size with 1.66 persons per household.
| Household Type | # Households | Household Size |
| Married-Couple | 1,088 (63.8%) | 3.62 |
| Single Male/Father | 99 (5.8%) | 3.56 |
| Single Female/Mother | 168 (9.9%) | 3.15 |
| Non-family | 349 (20.5%) | 1.66 |
| Total Households | 1,704 (100.0%) | 3.17 |
Household Size by Marriage Status in Balm
Out of a total of 1,704 households in Balm, 1,355 (79.5%) are family households, while 349 (20.5%) are nonfamily households. The most numerous type of family households are 2-person households, comprising 467, and the most common type of nonfamily households are 1-person households, comprising 246.
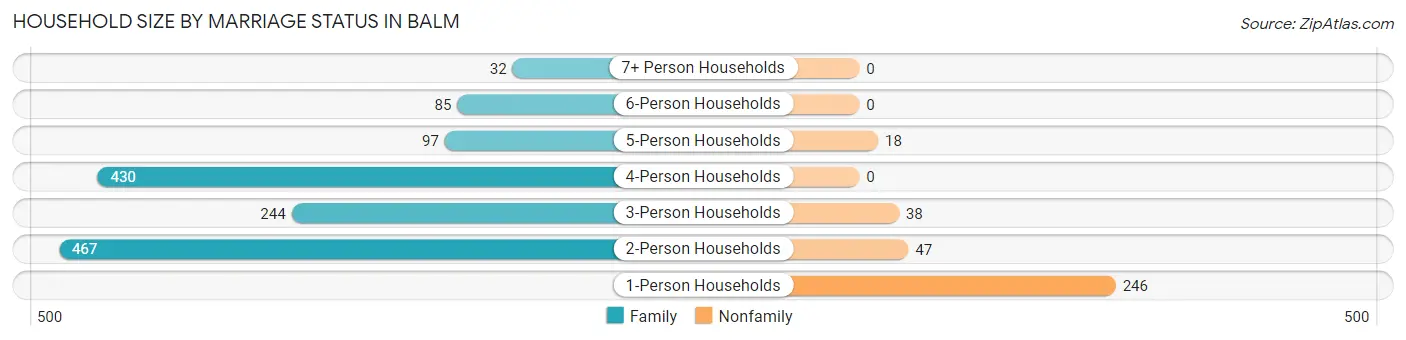
| Household Size | Family Households | Nonfamily Households |
| 1-Person Households | - | 246 (14.4%) |
| 2-Person Households | 467 (27.4%) | 47 (2.8%) |
| 3-Person Households | 244 (14.3%) | 38 (2.2%) |
| 4-Person Households | 430 (25.2%) | 0 (0.0%) |
| 5-Person Households | 97 (5.7%) | 18 (1.1%) |
| 6-Person Households | 85 (5.0%) | 0 (0.0%) |
| 7+ Person Households | 32 (1.9%) | 0 (0.0%) |
| Total | 1,355 (79.5%) | 349 (20.5%) |
Female Fertility in Balm
Fertility by Age in Balm
Average fertility rate in Balm is 17.0 births per 1,000 women. Women in the age bracket of 20 to 34 years have the highest fertility rate with 41.0 births per 1,000 women. Women in the age bracket of 20 to 34 years acount for 100.0% of all women with births.
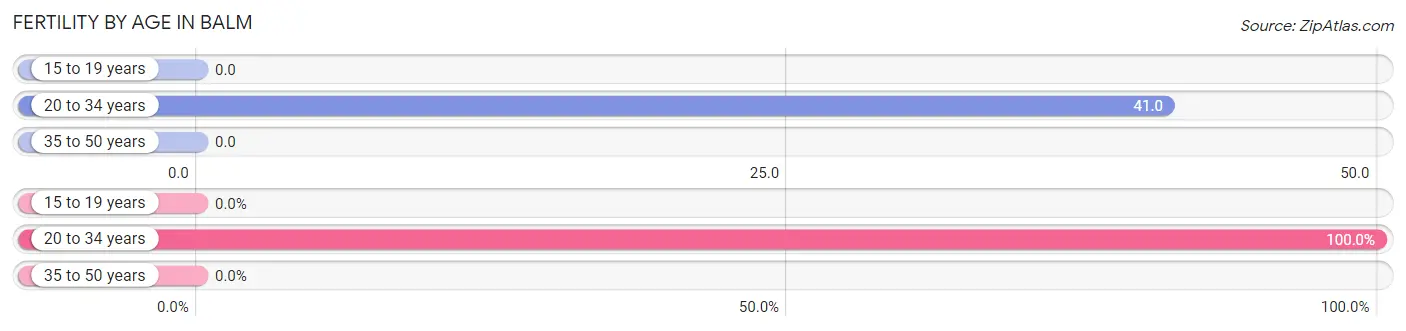
| Age Bracket | Women with Births | Births / 1,000 Women |
| 15 to 19 years | 0 (0.0%) | 0.0 |
| 20 to 34 years | 27 (100.0%) | 41.0 |
| 35 to 50 years | 0 (0.0%) | 0.0 |
| Total | 27 (100.0%) | 17.0 |
Fertility by Age by Marriage Status in Balm
74.1% of women with births (27) in Balm are married. The highest percentage of unmarried women with births falls into 20 to 34 years age bracket with 25.9% of them unmarried at the time of birth, while the lowest percentage of unmarried women with births belong to 20 to 34 years age bracket with 25.9% of them unmarried.
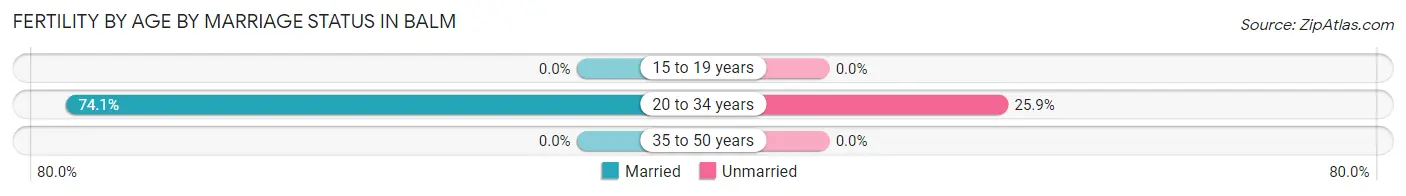
| Age Bracket | Married | Unmarried |
| 15 to 19 years | 0 (0.0%) | 0 (0.0%) |
| 20 to 34 years | 20 (74.1%) | 7 (25.9%) |
| 35 to 50 years | 0 (0.0%) | 0 (0.0%) |
| Total | 20 (74.1%) | 7 (25.9%) |
Fertility by Education in Balm
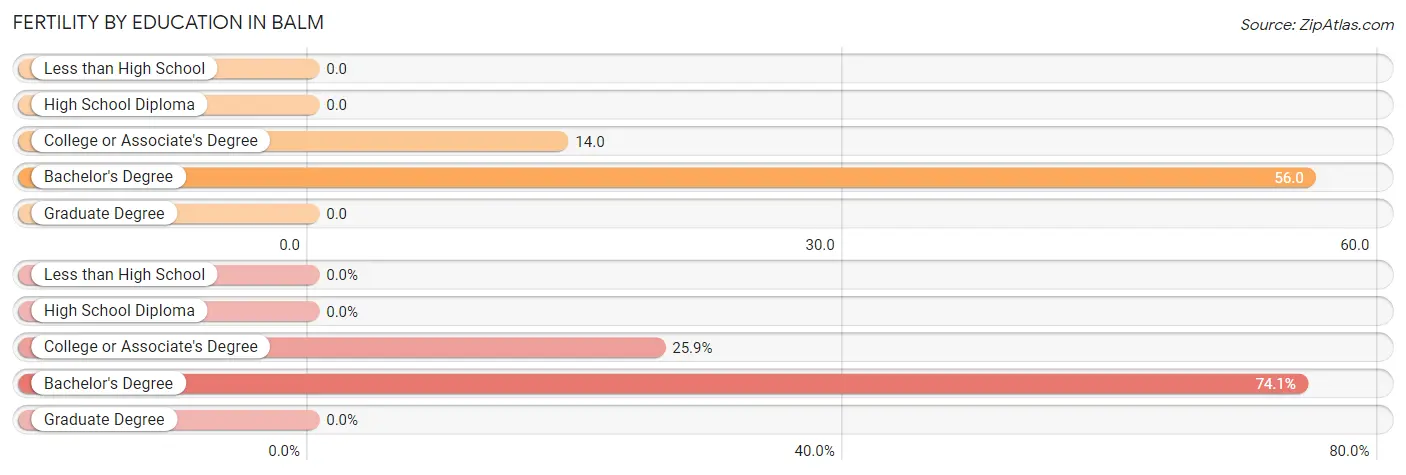
| Educational Attainment | Women with Births | Births / 1,000 Women |
| Less than High School | 0 (0.0%) | 0.0 |
| High School Diploma | 0 (0.0%) | 0.0 |
| College or Associate's Degree | 7 (25.9%) | 14.0 |
| Bachelor's Degree | 20 (74.1%) | 56.0 |
| Graduate Degree | 0 (0.0%) | 0.0 |
| Total | 27 (100.0%) | 17.0 |
Fertility by Education by Marriage Status in Balm
25.9% of women with births in Balm are unmarried. Women with the educational attainment of bachelor's degree are most likely to be married with 100.0% of them married at childbirth, while women with the educational attainment of college or associate's degree are least likely to be married with 100.0% of them unmarried at childbirth.
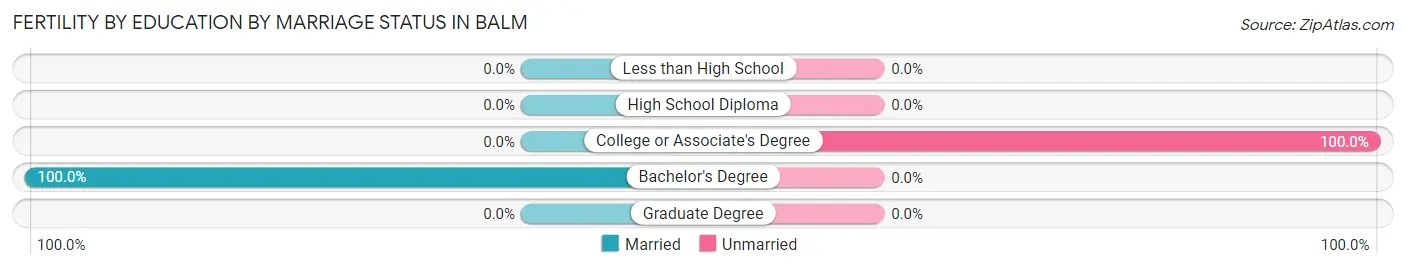
| Educational Attainment | Married | Unmarried |
| Less than High School | 0 (0.0%) | 0 (0.0%) |
| High School Diploma | 0 (0.0%) | 0 (0.0%) |
| College or Associate's Degree | 0 (0.0%) | 7 (100.0%) |
| Bachelor's Degree | 20 (100.0%) | 0 (0.0%) |
| Graduate Degree | 0 (0.0%) | 0 (0.0%) |
| Total | 20 (74.1%) | 7 (25.9%) |
Employment Characteristics in Balm
Employment by Class of Employer in Balm
Among the 2,998 employed individuals in Balm, private company employees (2,324 | 77.5%), not-for-profit organizations (153 | 5.1%), and local government employees (144 | 4.8%) make up the most common classes of employment.
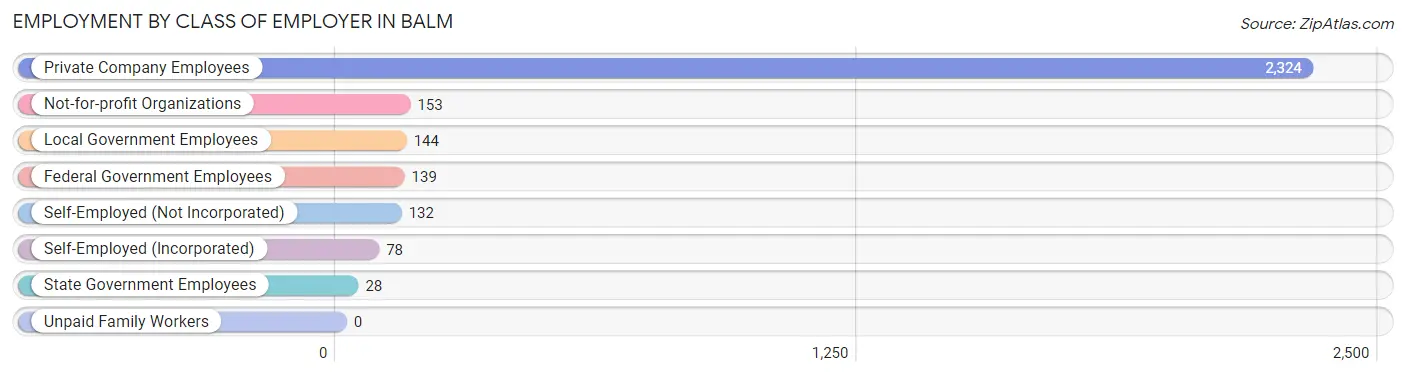
| Employer Class | # Employees | % Employees |
| Private Company Employees | 2,324 | 77.5% |
| Self-Employed (Incorporated) | 78 | 2.6% |
| Self-Employed (Not Incorporated) | 132 | 4.4% |
| Not-for-profit Organizations | 153 | 5.1% |
| Local Government Employees | 144 | 4.8% |
| State Government Employees | 28 | 0.9% |
| Federal Government Employees | 139 | 4.6% |
| Unpaid Family Workers | 0 | 0.0% |
| Total | 2,998 | 100.0% |
Employment Status by Age in Balm
According to the labor force statistics for Balm, out of the total population over 16 years of age (4,260), 72.6% or 3,093 individuals are in the labor force, with 2.6% or 80 of them unemployed. The age group with the highest labor force participation rate is 25 to 29 years, with 93.8% or 528 individuals in the labor force. Within the labor force, the 16 to 19 years age range has the highest percentage of unemployed individuals, with 9.8% or 26 of them being unemployed.
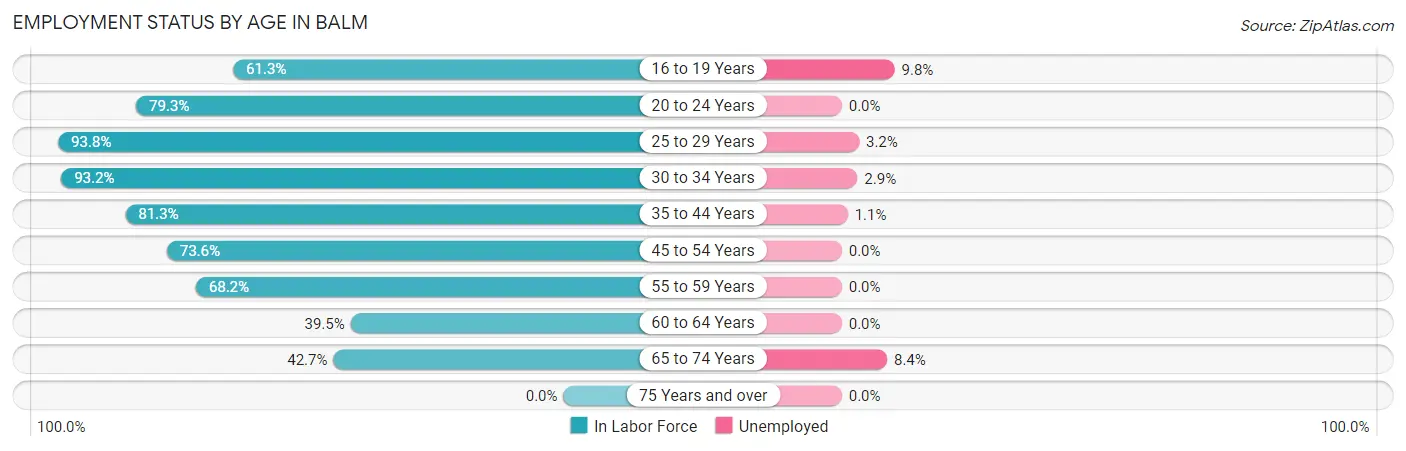
| Age Bracket | In Labor Force | Unemployed |
| 16 to 19 Years | 265 (61.3%) | 26 (9.8%) |
| 20 to 24 Years | 207 (79.3%) | 0 (0.0%) |
| 25 to 29 Years | 528 (93.8%) | 17 (3.2%) |
| 30 to 34 Years | 552 (93.2%) | 16 (2.9%) |
| 35 to 44 Years | 738 (81.3%) | 8 (1.1%) |
| 45 to 54 Years | 415 (73.6%) | 0 (0.0%) |
| 55 to 59 Years | 137 (68.2%) | 0 (0.0%) |
| 60 to 64 Years | 73 (39.5%) | 0 (0.0%) |
| 65 to 74 Years | 179 (42.7%) | 15 (8.4%) |
| 75 Years and over | 0 (0.0%) | 0 (0.0%) |
| Total | 3,093 (72.6%) | 80 (2.6%) |
Employment Status by Educational Attainment in Balm
According to labor force statistics for Balm, 81.1% of individuals (2,444) out of the total population between 25 and 64 years of age (3,013) are in the labor force, with 1.7% or 42 of them being unemployed. The group with the highest labor force participation rate are those with the educational attainment of college / associate degree, with 83.2% or 848 individuals in the labor force. Within the labor force, individuals with less than high school education have the highest percentage of unemployment, with 3.2% or 8 of them being unemployed.
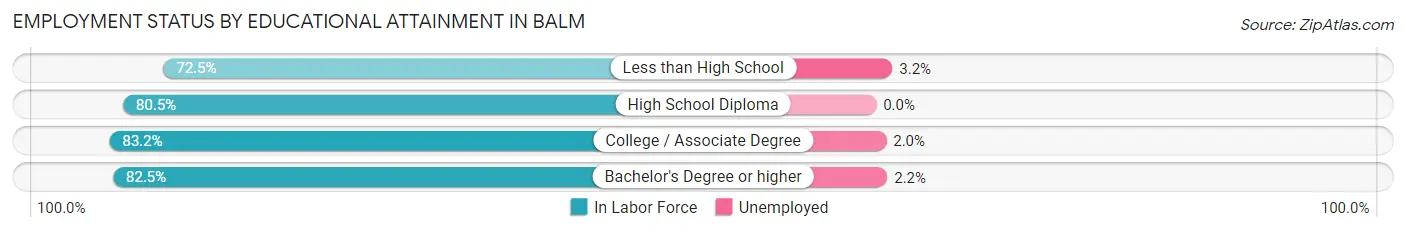
| Educational Attainment | In Labor Force | Unemployed |
| Less than High School | 253 (72.5%) | 11 (3.2%) |
| High School Diploma | 623 (80.5%) | 0 (0.0%) |
| College / Associate Degree | 848 (83.2%) | 20 (2.0%) |
| Bachelor's Degree or higher | 719 (82.5%) | 19 (2.2%) |
| Total | 2,444 (81.1%) | 51 (1.7%) |
Employment Occupations by Sex in Balm
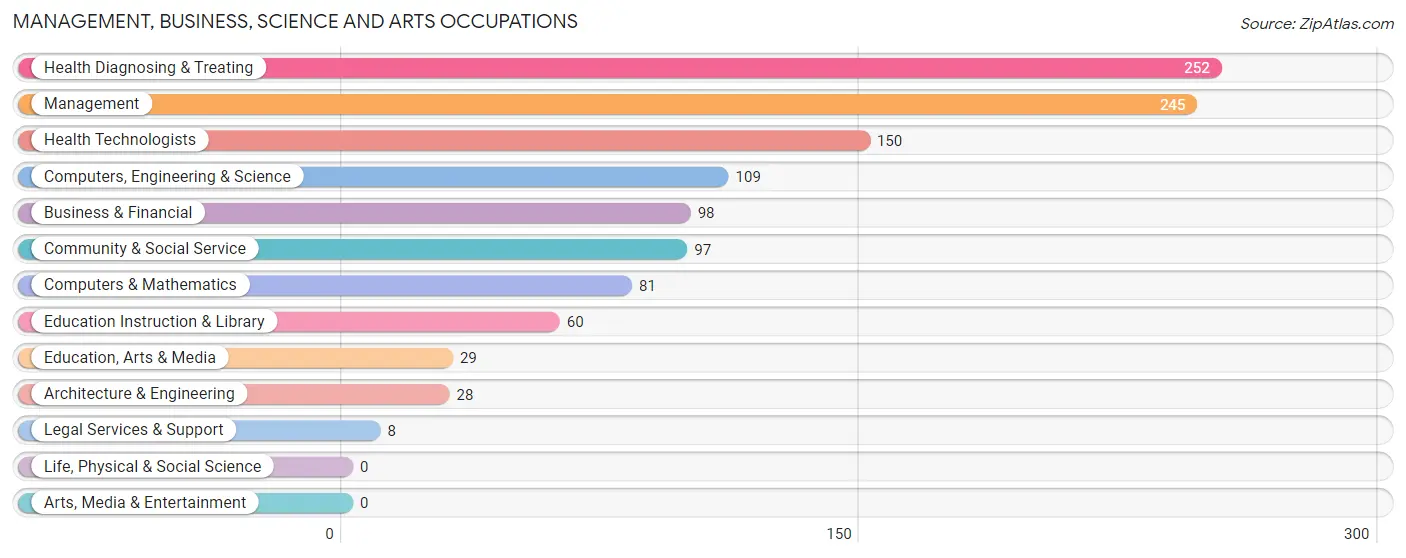
Management, Business, Science and Arts Occupations
The most common Management, Business, Science and Arts occupations in Balm are Health Diagnosing & Treating (252 | 8.4%), Management (245 | 8.2%), Health Technologists (150 | 5.0%), Computers, Engineering & Science (109 | 3.6%), and Business & Financial (98 | 3.3%).
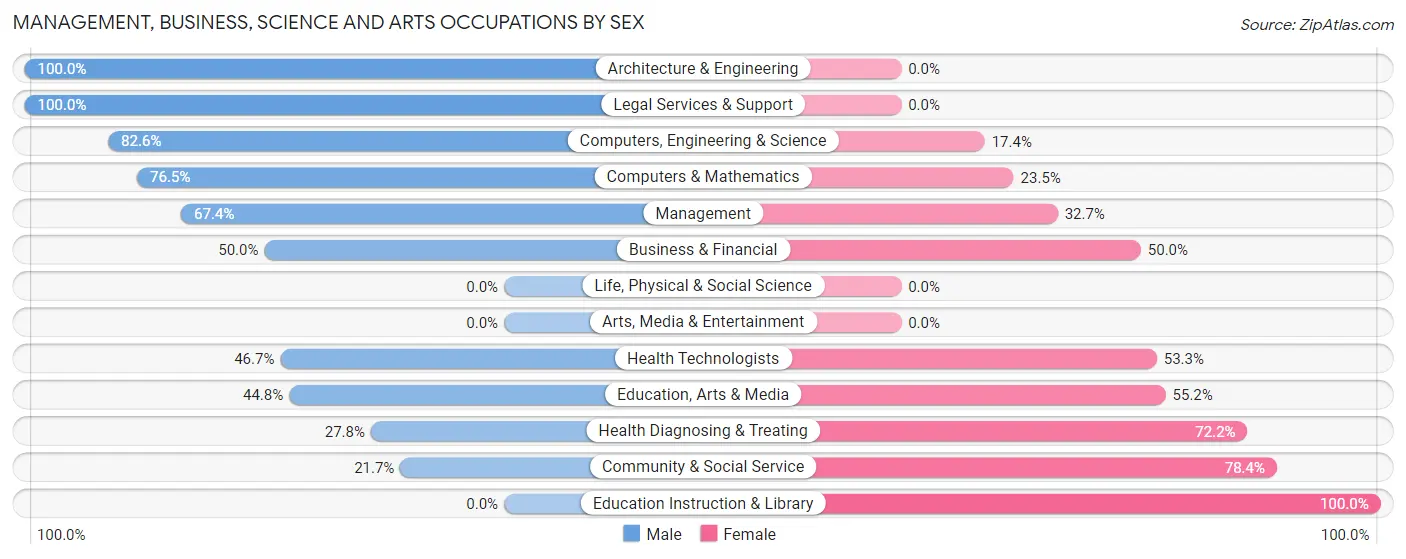
Management, Business, Science and Arts Occupations by Sex
Within the Management, Business, Science and Arts occupations in Balm, the most male-oriented occupations are Architecture & Engineering (100.0%), Legal Services & Support (100.0%), and Computers, Engineering & Science (82.6%), while the most female-oriented occupations are Education Instruction & Library (100.0%), Community & Social Service (78.3%), and Health Diagnosing & Treating (72.2%).
| Occupation | Male | Female |
| Management | 165 (67.3%) | 80 (32.7%) |
| Business & Financial | 49 (50.0%) | 49 (50.0%) |
| Computers, Engineering & Science | 90 (82.6%) | 19 (17.4%) |
| Computers & Mathematics | 62 (76.5%) | 19 (23.5%) |
| Architecture & Engineering | 28 (100.0%) | 0 (0.0%) |
| Life, Physical & Social Science | 0 (0.0%) | 0 (0.0%) |
| Community & Social Service | 21 (21.6%) | 76 (78.3%) |
| Education, Arts & Media | 13 (44.8%) | 16 (55.2%) |
| Legal Services & Support | 8 (100.0%) | 0 (0.0%) |
| Education Instruction & Library | 0 (0.0%) | 60 (100.0%) |
| Arts, Media & Entertainment | 0 (0.0%) | 0 (0.0%) |
| Health Diagnosing & Treating | 70 (27.8%) | 182 (72.2%) |
| Health Technologists | 70 (46.7%) | 80 (53.3%) |
| Total (Category) | 395 (49.3%) | 406 (50.7%) |
| Total (Overall) | 1,563 (52.3%) | 1,423 (47.7%) |
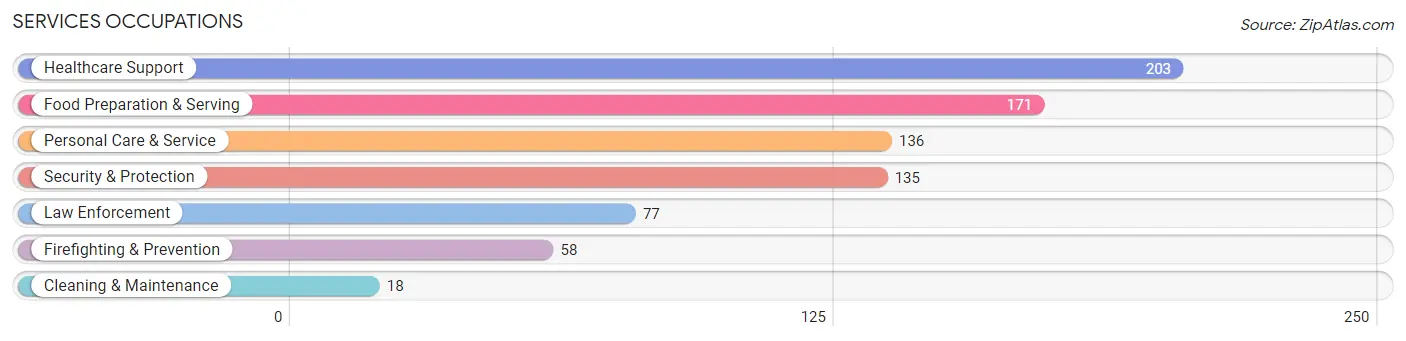
Services Occupations
The most common Services occupations in Balm are Healthcare Support (203 | 6.8%), Food Preparation & Serving (171 | 5.7%), Personal Care & Service (136 | 4.5%), Security & Protection (135 | 4.5%), and Law Enforcement (77 | 2.6%).
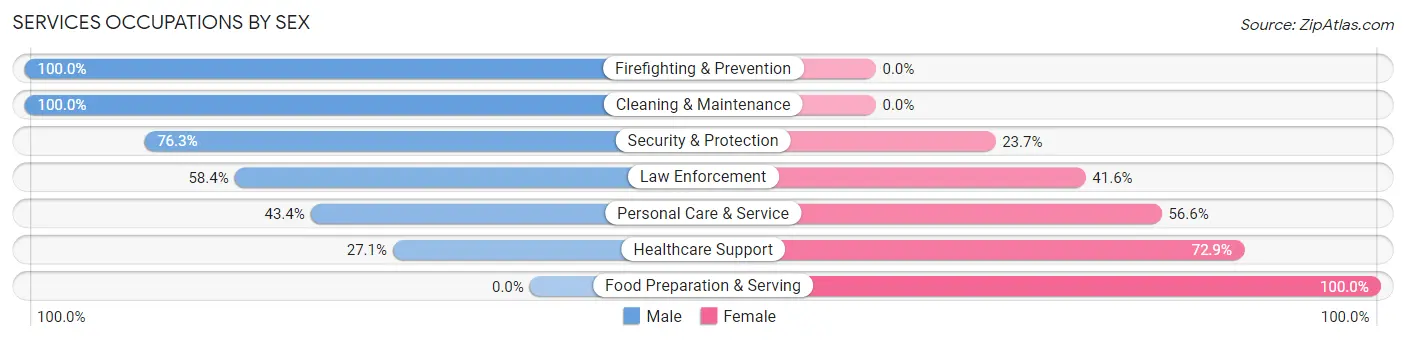
Services Occupations by Sex
Within the Services occupations in Balm, the most male-oriented occupations are Firefighting & Prevention (100.0%), Cleaning & Maintenance (100.0%), and Security & Protection (76.3%), while the most female-oriented occupations are Food Preparation & Serving (100.0%), Healthcare Support (72.9%), and Personal Care & Service (56.6%).
| Occupation | Male | Female |
| Healthcare Support | 55 (27.1%) | 148 (72.9%) |
| Security & Protection | 103 (76.3%) | 32 (23.7%) |
| Firefighting & Prevention | 58 (100.0%) | 0 (0.0%) |
| Law Enforcement | 45 (58.4%) | 32 (41.6%) |
| Food Preparation & Serving | 0 (0.0%) | 171 (100.0%) |
| Cleaning & Maintenance | 18 (100.0%) | 0 (0.0%) |
| Personal Care & Service | 59 (43.4%) | 77 (56.6%) |
| Total (Category) | 235 (35.4%) | 428 (64.6%) |
| Total (Overall) | 1,563 (52.3%) | 1,423 (47.7%) |
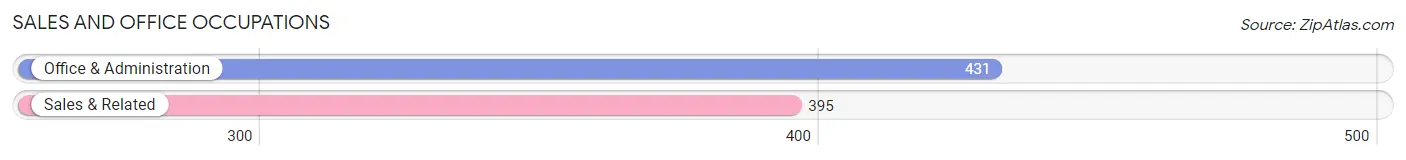
Sales and Office Occupations
The most common Sales and Office occupations in Balm are Office & Administration (431 | 14.4%), and Sales & Related (395 | 13.2%).
Sales and Office Occupations by Sex
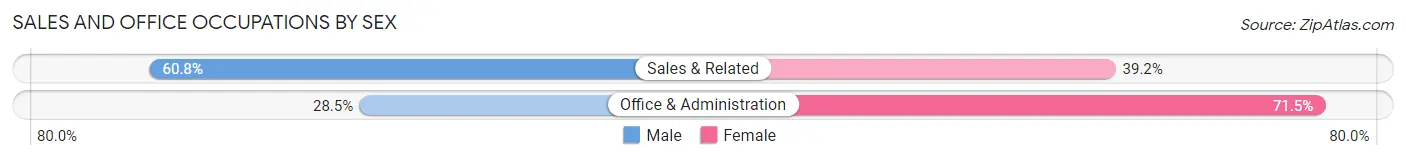
| Occupation | Male | Female |
| Sales & Related | 240 (60.8%) | 155 (39.2%) |
| Office & Administration | 123 (28.5%) | 308 (71.5%) |
| Total (Category) | 363 (44.0%) | 463 (56.0%) |
| Total (Overall) | 1,563 (52.3%) | 1,423 (47.7%) |
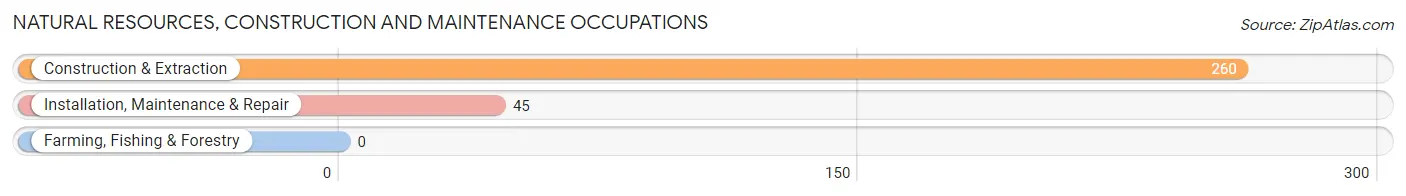
Natural Resources, Construction and Maintenance Occupations
The most common Natural Resources, Construction and Maintenance occupations in Balm are Construction & Extraction (260 | 8.7%), and Installation, Maintenance & Repair (45 | 1.5%).
Natural Resources, Construction and Maintenance Occupations by Sex
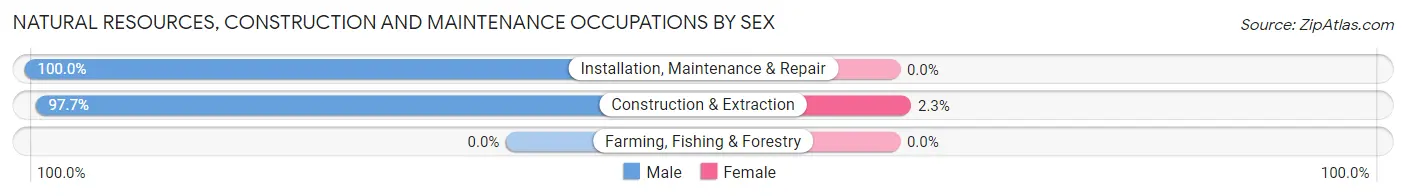
| Occupation | Male | Female |
| Farming, Fishing & Forestry | 0 (0.0%) | 0 (0.0%) |
| Construction & Extraction | 254 (97.7%) | 6 (2.3%) |
| Installation, Maintenance & Repair | 45 (100.0%) | 0 (0.0%) |
| Total (Category) | 299 (98.0%) | 6 (2.0%) |
| Total (Overall) | 1,563 (52.3%) | 1,423 (47.7%) |
Production, Transportation and Moving Occupations
The most common Production, Transportation and Moving occupations in Balm are Production (165 | 5.5%), Transportation (120 | 4.0%), and Material Moving (106 | 3.5%).
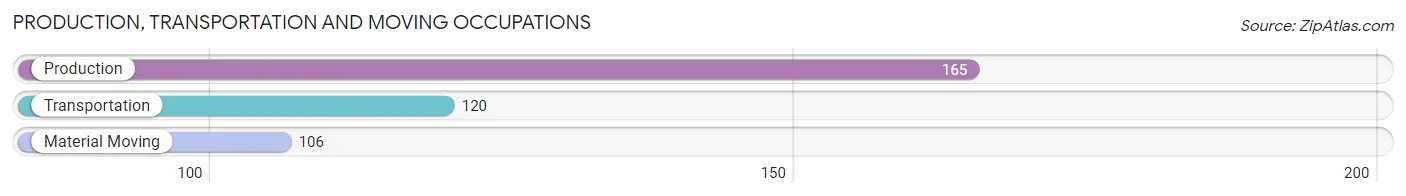
Production, Transportation and Moving Occupations by Sex
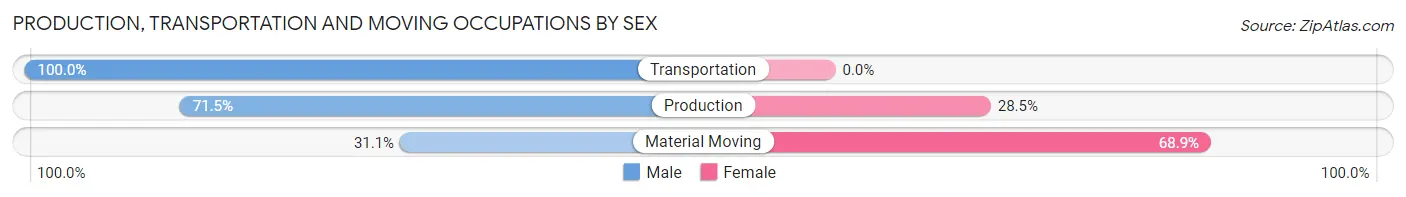
| Occupation | Male | Female |
| Production | 118 (71.5%) | 47 (28.5%) |
| Transportation | 120 (100.0%) | 0 (0.0%) |
| Material Moving | 33 (31.1%) | 73 (68.9%) |
| Total (Category) | 271 (69.3%) | 120 (30.7%) |
| Total (Overall) | 1,563 (52.3%) | 1,423 (47.7%) |
Employment Industries by Sex in Balm
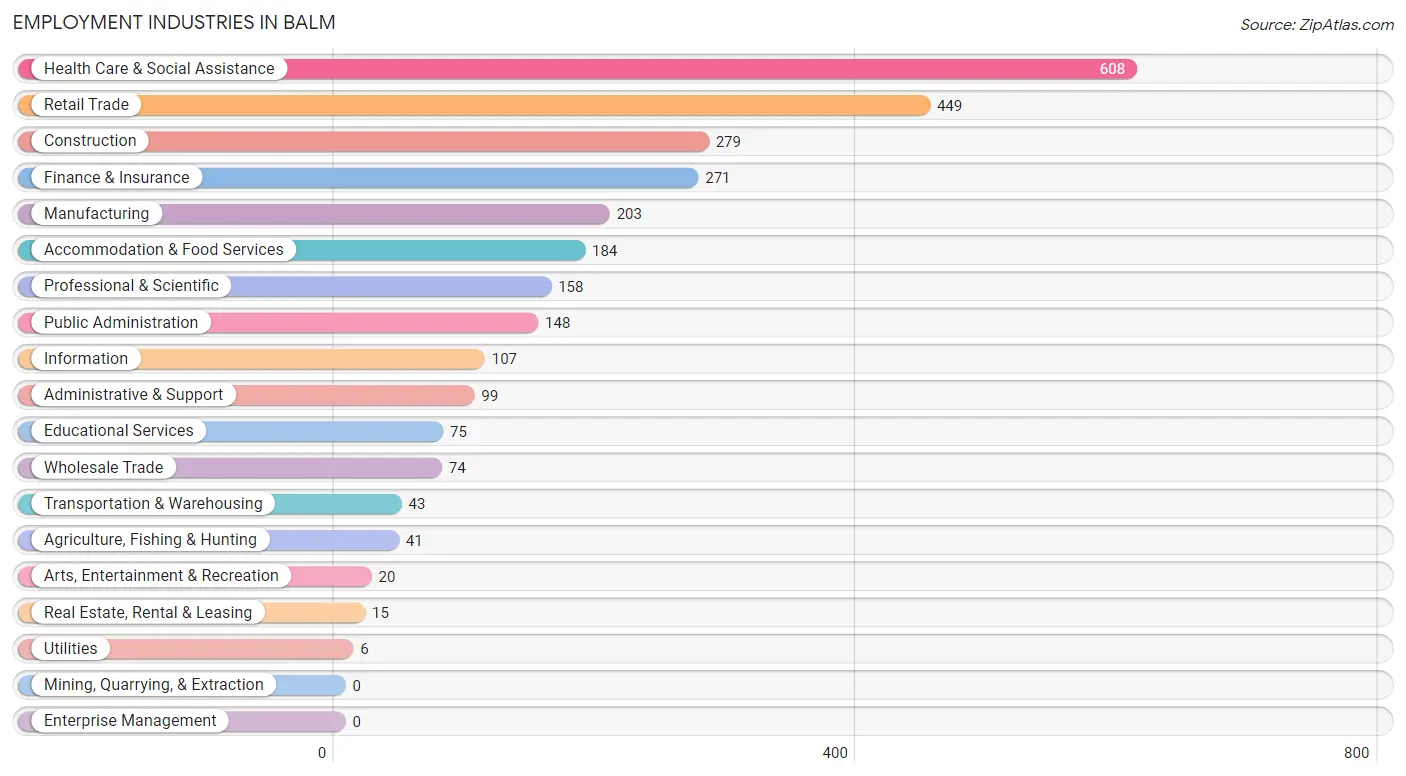
Employment Industries in Balm
The major employment industries in Balm include Health Care & Social Assistance (608 | 20.4%), Retail Trade (449 | 15.0%), Construction (279 | 9.3%), Finance & Insurance (271 | 9.1%), and Manufacturing (203 | 6.8%).
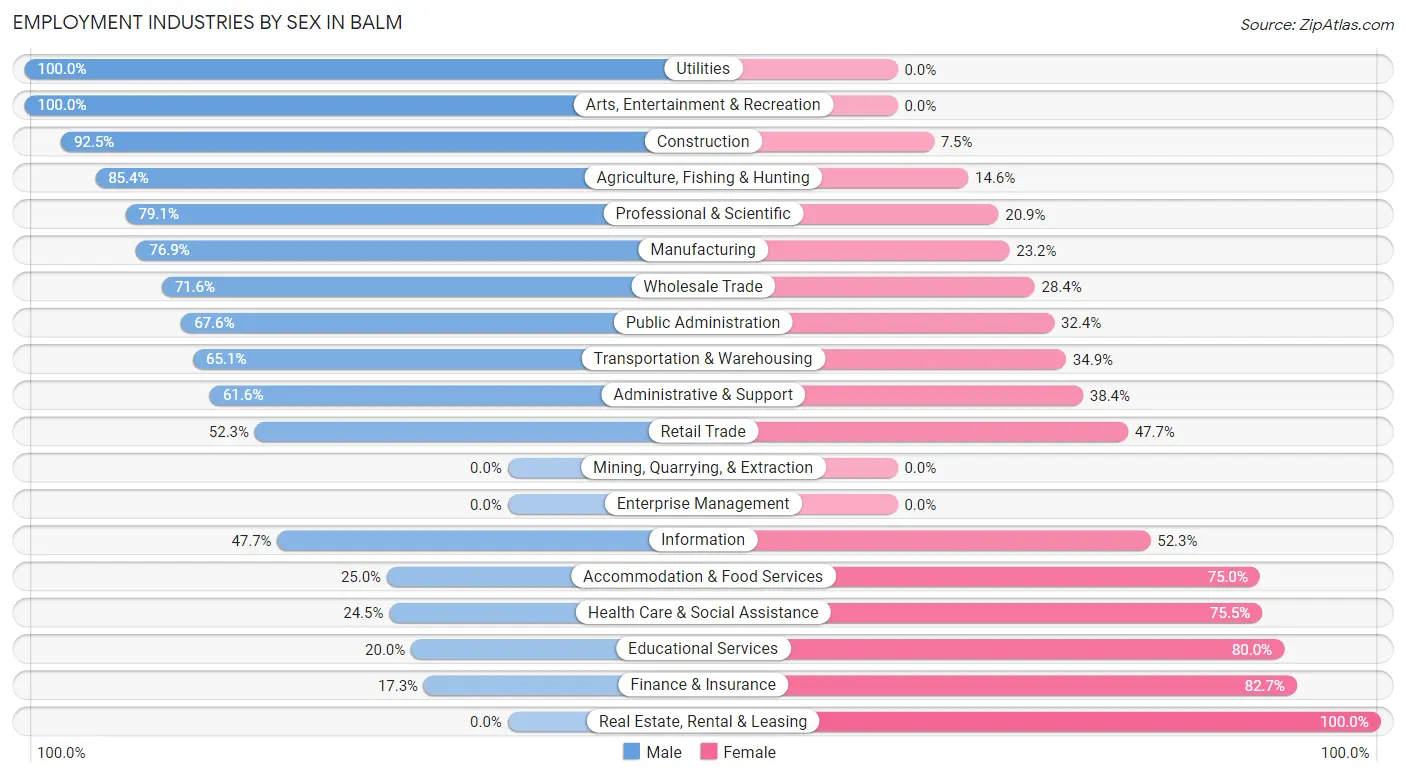
Employment Industries by Sex in Balm
The Balm industries that see more men than women are Utilities (100.0%), Arts, Entertainment & Recreation (100.0%), and Construction (92.5%), whereas the industries that tend to have a higher number of women are Real Estate, Rental & Leasing (100.0%), Finance & Insurance (82.7%), and Educational Services (80.0%).
| Industry | Male | Female |
| Agriculture, Fishing & Hunting | 35 (85.4%) | 6 (14.6%) |
| Mining, Quarrying, & Extraction | 0 (0.0%) | 0 (0.0%) |
| Construction | 258 (92.5%) | 21 (7.5%) |
| Manufacturing | 156 (76.8%) | 47 (23.2%) |
| Wholesale Trade | 53 (71.6%) | 21 (28.4%) |
| Retail Trade | 235 (52.3%) | 214 (47.7%) |
| Transportation & Warehousing | 28 (65.1%) | 15 (34.9%) |
| Utilities | 6 (100.0%) | 0 (0.0%) |
| Information | 51 (47.7%) | 56 (52.3%) |
| Finance & Insurance | 47 (17.3%) | 224 (82.7%) |
| Real Estate, Rental & Leasing | 0 (0.0%) | 15 (100.0%) |
| Professional & Scientific | 125 (79.1%) | 33 (20.9%) |
| Enterprise Management | 0 (0.0%) | 0 (0.0%) |
| Administrative & Support | 61 (61.6%) | 38 (38.4%) |
| Educational Services | 15 (20.0%) | 60 (80.0%) |
| Health Care & Social Assistance | 149 (24.5%) | 459 (75.5%) |
| Arts, Entertainment & Recreation | 20 (100.0%) | 0 (0.0%) |
| Accommodation & Food Services | 46 (25.0%) | 138 (75.0%) |
| Public Administration | 100 (67.6%) | 48 (32.4%) |
| Total | 1,563 (52.3%) | 1,423 (47.7%) |
Education in Balm
School Enrollment in Balm
The most common levels of schooling among the 1,434 students in Balm are elementary school (324 | 22.6%), middle school (320 | 22.3%), and college / undergraduate (297 | 20.7%).
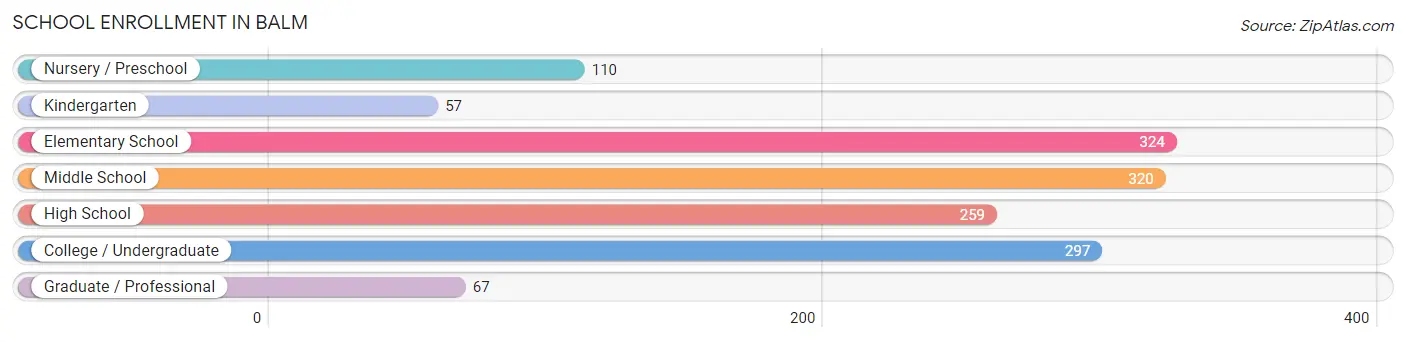
| School Level | # Students | % Students |
| Nursery / Preschool | 110 | 7.7% |
| Kindergarten | 57 | 4.0% |
| Elementary School | 324 | 22.6% |
| Middle School | 320 | 22.3% |
| High School | 259 | 18.1% |
| College / Undergraduate | 297 | 20.7% |
| Graduate / Professional | 67 | 4.7% |
| Total | 1,434 | 100.0% |
School Enrollment by Age by Funding Source in Balm
Out of a total of 1,434 students who are enrolled in schools in Balm, 318 (22.2%) attend a private institution, while the remaining 1,116 (77.8%) are enrolled in public schools. The age group of 3 to 4 year olds has the highest likelihood of being enrolled in private schools, with 50 (58.1% in the age bracket) enrolled. Conversely, the age group of 15 to 17 year olds has the lowest likelihood of being enrolled in a private school, with 279 (100.0% in the age bracket) attending a public institution.
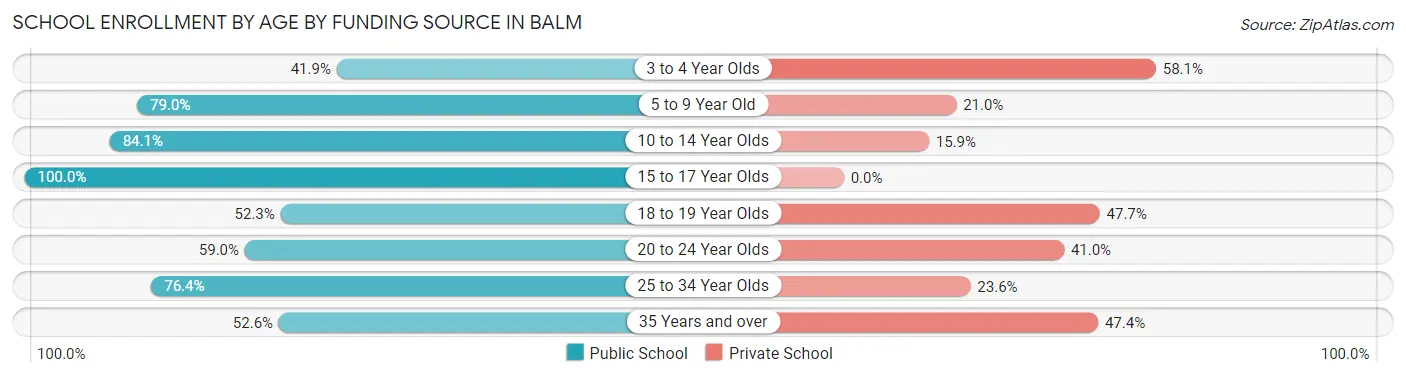
| Age Bracket | Public School | Private School |
| 3 to 4 Year Olds | 36 (41.9%) | 50 (58.1%) |
| 5 to 9 Year Old | 313 (79.0%) | 83 (21.0%) |
| 10 to 14 Year Olds | 260 (84.1%) | 49 (15.9%) |
| 15 to 17 Year Olds | 279 (100.0%) | 0 (0.0%) |
| 18 to 19 Year Olds | 45 (52.3%) | 41 (47.7%) |
| 20 to 24 Year Olds | 23 (59.0%) | 16 (41.0%) |
| 25 to 34 Year Olds | 110 (76.4%) | 34 (23.6%) |
| 35 Years and over | 50 (52.6%) | 45 (47.4%) |
| Total | 1,116 (77.8%) | 318 (22.2%) |
Educational Attainment by Field of Study in Balm
Science & technology (184 | 19.1%), business (173 | 18.0%), social sciences (154 | 16.0%), arts & humanities (103 | 10.7%), and education (74 | 7.7%) are the most common fields of study among 963 individuals in Balm who have obtained a bachelor's degree or higher.
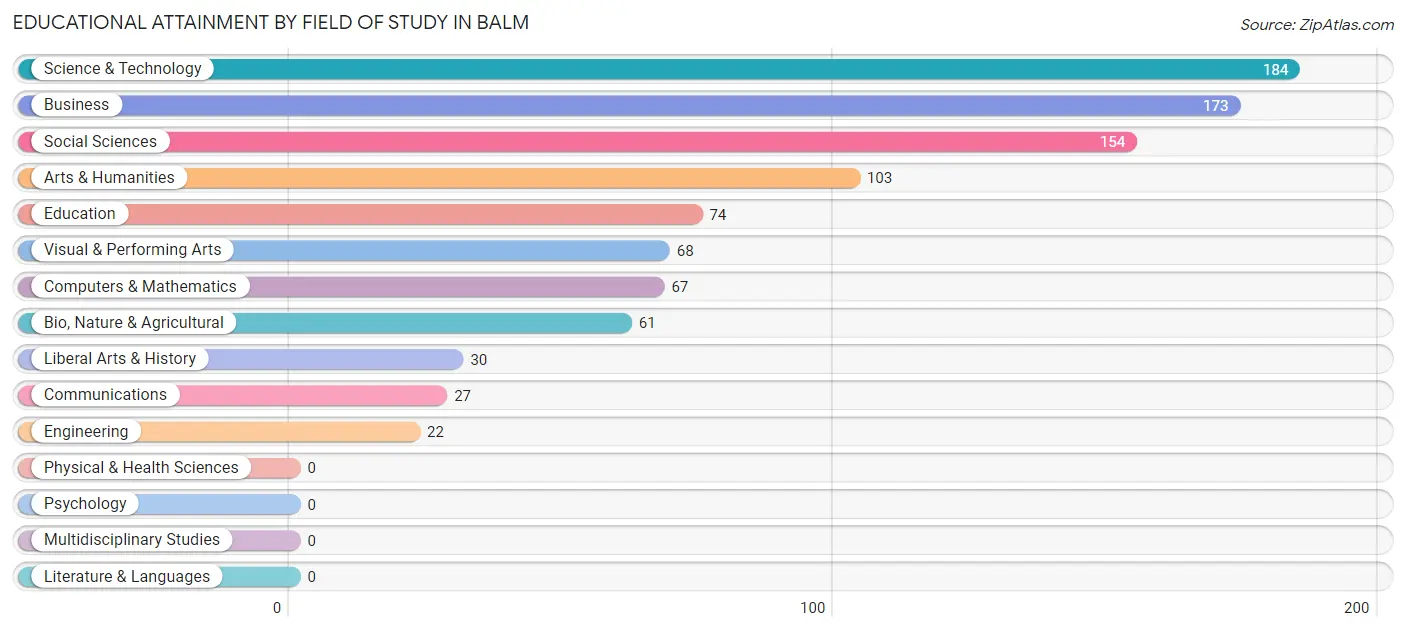
| Field of Study | # Graduates | % Graduates |
| Computers & Mathematics | 67 | 7.0% |
| Bio, Nature & Agricultural | 61 | 6.3% |
| Physical & Health Sciences | 0 | 0.0% |
| Psychology | 0 | 0.0% |
| Social Sciences | 154 | 16.0% |
| Engineering | 22 | 2.3% |
| Multidisciplinary Studies | 0 | 0.0% |
| Science & Technology | 184 | 19.1% |
| Business | 173 | 18.0% |
| Education | 74 | 7.7% |
| Literature & Languages | 0 | 0.0% |
| Liberal Arts & History | 30 | 3.1% |
| Visual & Performing Arts | 68 | 7.1% |
| Communications | 27 | 2.8% |
| Arts & Humanities | 103 | 10.7% |
| Total | 963 | 100.0% |
Transportation & Commute in Balm
Vehicle Availability by Sex in Balm
The most prevalent vehicle ownership categories in Balm are males with 2 vehicles (610, accounting for 38.7%) and females with 2 vehicles (707, making up 42.9%).
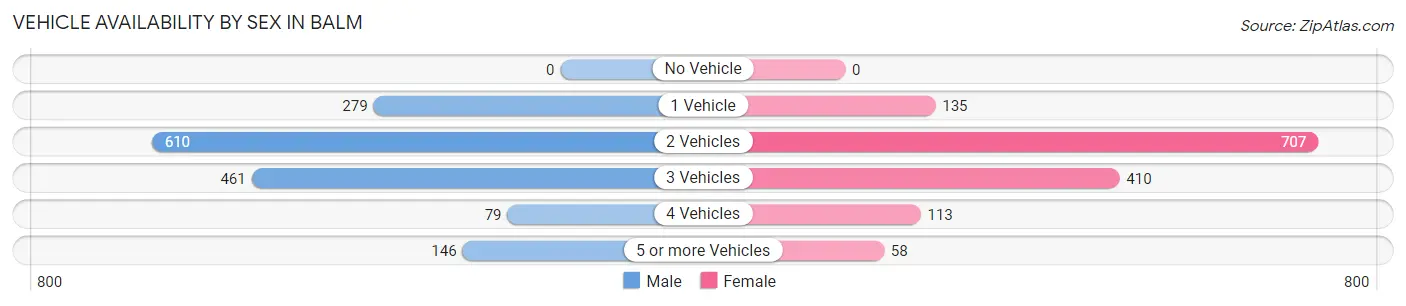
| Vehicles Available | Male | Female |
| No Vehicle | 0 (0.0%) | 0 (0.0%) |
| 1 Vehicle | 279 (17.7%) | 135 (9.5%) |
| 2 Vehicles | 610 (38.7%) | 707 (49.7%) |
| 3 Vehicles | 461 (29.3%) | 410 (28.8%) |
| 4 Vehicles | 79 (5.0%) | 113 (7.9%) |
| 5 or more Vehicles | 146 (9.3%) | 58 (4.1%) |
| Total | 1,575 (100.0%) | 1,423 (100.0%) |
Commute Time in Balm
The most frequently occuring commute durations in Balm are 20 to 24 minutes (484 commuters, 18.0%), 60 to 89 minutes (459 commuters, 17.1%), and 45 to 59 minutes (420 commuters, 15.6%).
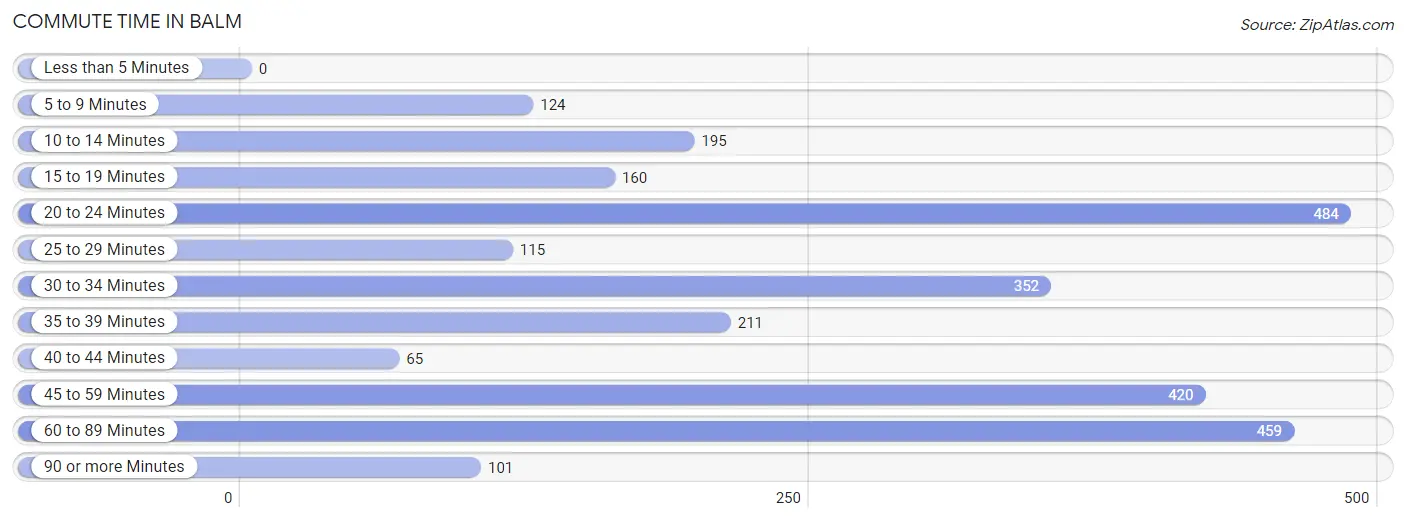
| Commute Time | # Commuters | % Commuters |
| Less than 5 Minutes | 0 | 0.0% |
| 5 to 9 Minutes | 124 | 4.6% |
| 10 to 14 Minutes | 195 | 7.3% |
| 15 to 19 Minutes | 160 | 6.0% |
| 20 to 24 Minutes | 484 | 18.0% |
| 25 to 29 Minutes | 115 | 4.3% |
| 30 to 34 Minutes | 352 | 13.1% |
| 35 to 39 Minutes | 211 | 7.9% |
| 40 to 44 Minutes | 65 | 2.4% |
| 45 to 59 Minutes | 420 | 15.6% |
| 60 to 89 Minutes | 459 | 17.1% |
| 90 or more Minutes | 101 | 3.8% |
Commute Time by Sex in Balm
The most common commute times in Balm are 20 to 24 minutes (411 commuters, 27.6%) for males and 30 to 34 minutes (237 commuters, 19.8%) for females.
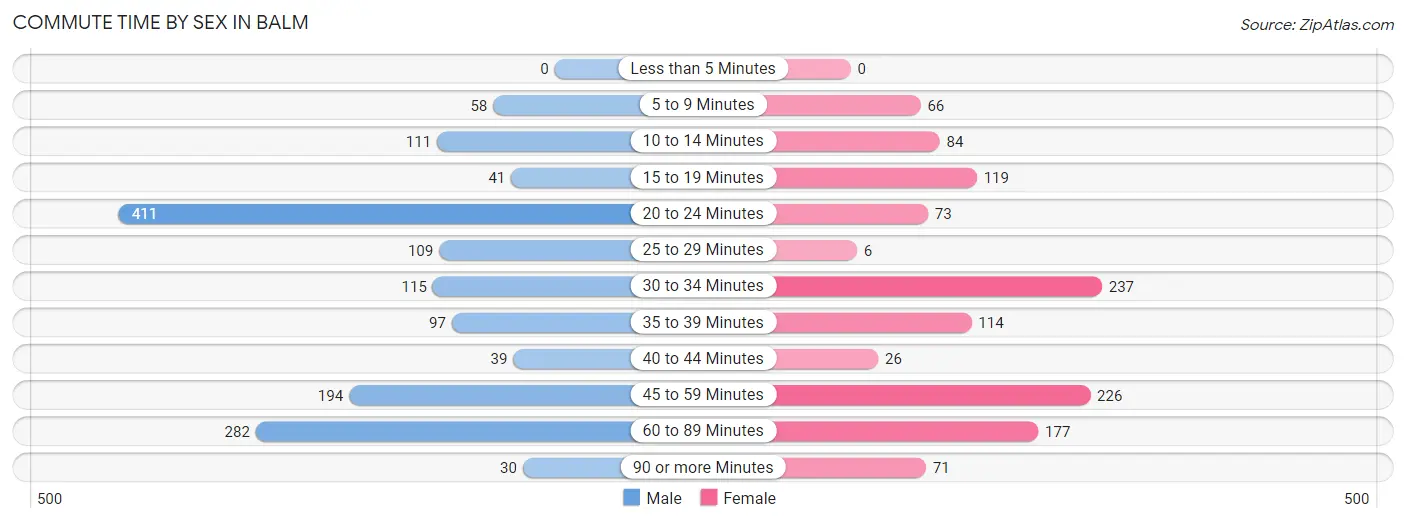
| Commute Time | Male | Female |
| Less than 5 Minutes | 0 (0.0%) | 0 (0.0%) |
| 5 to 9 Minutes | 58 (3.9%) | 66 (5.5%) |
| 10 to 14 Minutes | 111 (7.5%) | 84 (7.0%) |
| 15 to 19 Minutes | 41 (2.8%) | 119 (9.9%) |
| 20 to 24 Minutes | 411 (27.6%) | 73 (6.1%) |
| 25 to 29 Minutes | 109 (7.3%) | 6 (0.5%) |
| 30 to 34 Minutes | 115 (7.7%) | 237 (19.8%) |
| 35 to 39 Minutes | 97 (6.5%) | 114 (9.5%) |
| 40 to 44 Minutes | 39 (2.6%) | 26 (2.2%) |
| 45 to 59 Minutes | 194 (13.1%) | 226 (18.9%) |
| 60 to 89 Minutes | 282 (19.0%) | 177 (14.8%) |
| 90 or more Minutes | 30 (2.0%) | 71 (5.9%) |
Time of Departure to Work by Sex in Balm
The most frequent times of departure to work in Balm are 12:00 AM to 4:59 AM (265, 17.8%) for males and 6:30 AM to 6:59 AM (279, 23.3%) for females.
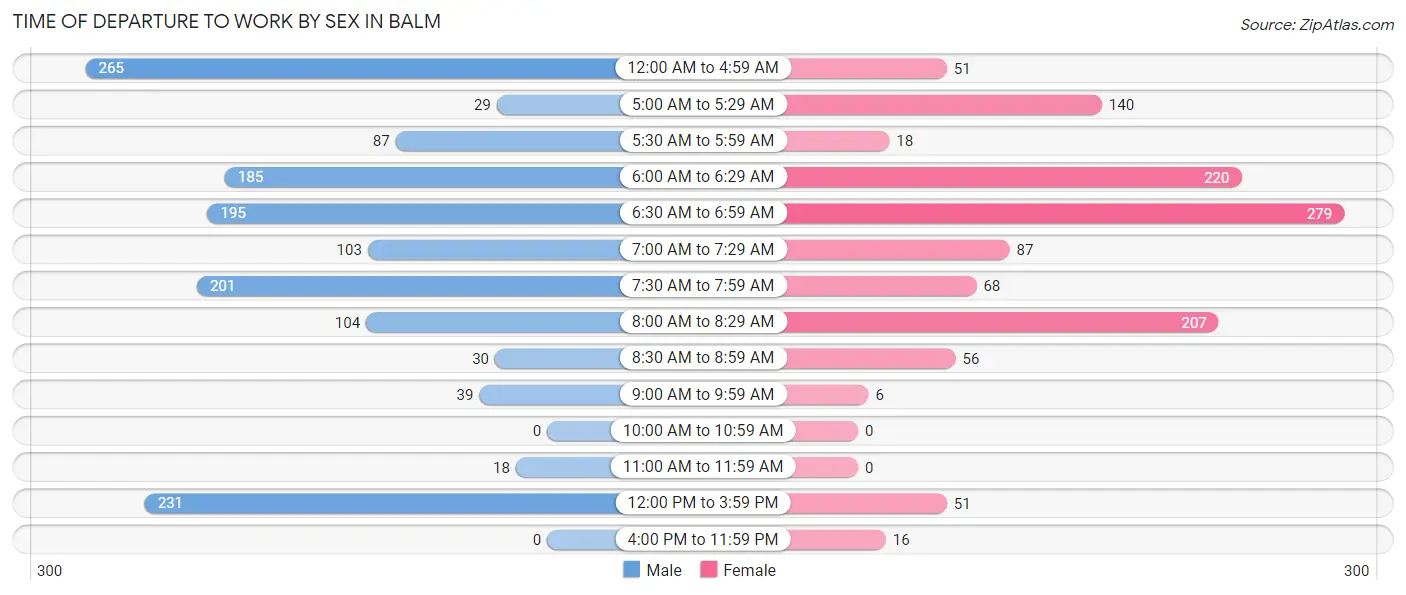
| Time of Departure | Male | Female |
| 12:00 AM to 4:59 AM | 265 (17.8%) | 51 (4.3%) |
| 5:00 AM to 5:29 AM | 29 (1.9%) | 140 (11.7%) |
| 5:30 AM to 5:59 AM | 87 (5.9%) | 18 (1.5%) |
| 6:00 AM to 6:29 AM | 185 (12.4%) | 220 (18.3%) |
| 6:30 AM to 6:59 AM | 195 (13.1%) | 279 (23.3%) |
| 7:00 AM to 7:29 AM | 103 (6.9%) | 87 (7.3%) |
| 7:30 AM to 7:59 AM | 201 (13.5%) | 68 (5.7%) |
| 8:00 AM to 8:29 AM | 104 (7.0%) | 207 (17.3%) |
| 8:30 AM to 8:59 AM | 30 (2.0%) | 56 (4.7%) |
| 9:00 AM to 9:59 AM | 39 (2.6%) | 6 (0.5%) |
| 10:00 AM to 10:59 AM | 0 (0.0%) | 0 (0.0%) |
| 11:00 AM to 11:59 AM | 18 (1.2%) | 0 (0.0%) |
| 12:00 PM to 3:59 PM | 231 (15.5%) | 51 (4.3%) |
| 4:00 PM to 11:59 PM | 0 (0.0%) | 16 (1.3%) |
| Total | 1,487 (100.0%) | 1,199 (100.0%) |
Housing Occupancy in Balm
Occupancy by Ownership in Balm
Of the total 1,704 dwellings in Balm, owner-occupied units account for 1,479 (86.8%), while renter-occupied units make up 225 (13.2%).
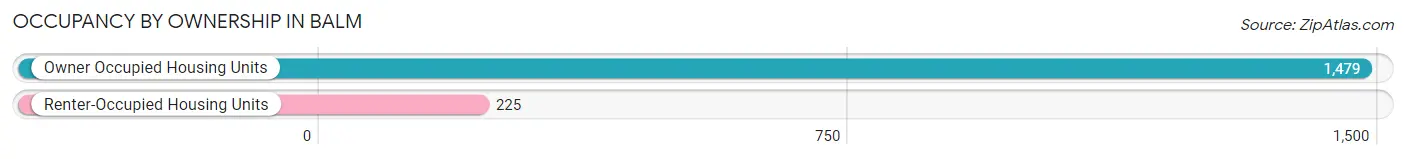
| Occupancy | # Housing Units | % Housing Units |
| Owner Occupied Housing Units | 1,479 | 86.8% |
| Renter-Occupied Housing Units | 225 | 13.2% |
| Total Occupied Housing Units | 1,704 | 100.0% |
Occupancy by Household Size in Balm
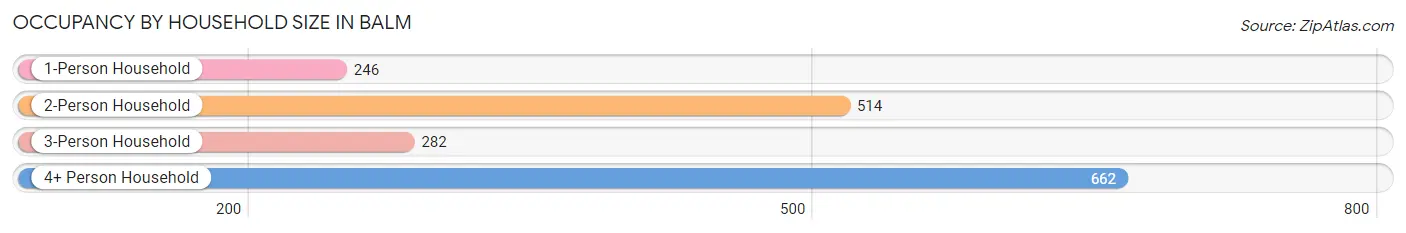
| Household Size | # Housing Units | % Housing Units |
| 1-Person Household | 246 | 14.4% |
| 2-Person Household | 514 | 30.2% |
| 3-Person Household | 282 | 16.6% |
| 4+ Person Household | 662 | 38.9% |
| Total Housing Units | 1,704 | 100.0% |
Occupancy by Ownership by Household Size in Balm
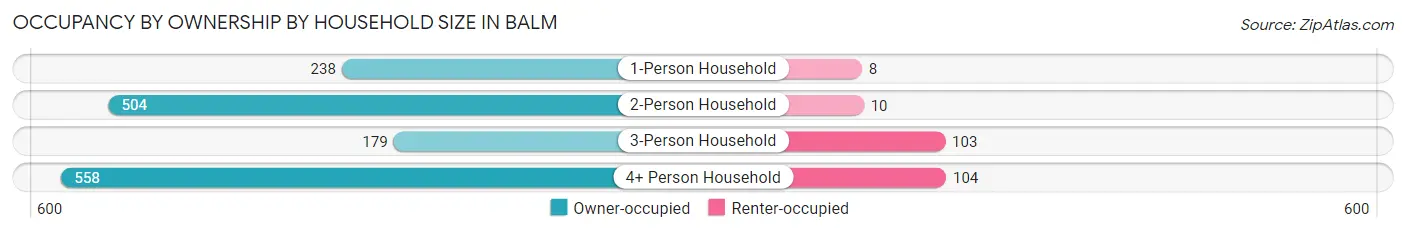
| Household Size | Owner-occupied | Renter-occupied |
| 1-Person Household | 238 (96.8%) | 8 (3.3%) |
| 2-Person Household | 504 (98.1%) | 10 (1.9%) |
| 3-Person Household | 179 (63.5%) | 103 (36.5%) |
| 4+ Person Household | 558 (84.3%) | 104 (15.7%) |
| Total Housing Units | 1,479 (86.8%) | 225 (13.2%) |
Occupancy by Educational Attainment in Balm
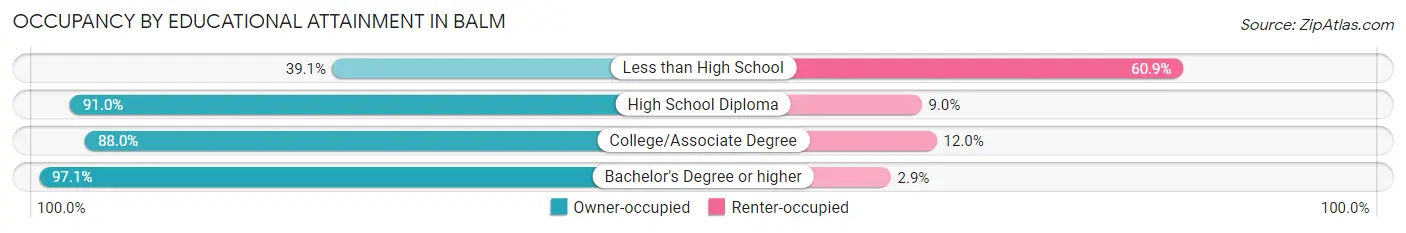
| Household Size | Owner-occupied | Renter-occupied |
| Less than High School | 61 (39.1%) | 95 (60.9%) |
| High School Diploma | 324 (91.0%) | 32 (9.0%) |
| College/Associate Degree | 618 (88.0%) | 84 (12.0%) |
| Bachelor's Degree or higher | 476 (97.1%) | 14 (2.9%) |
Occupancy by Age of Householder in Balm
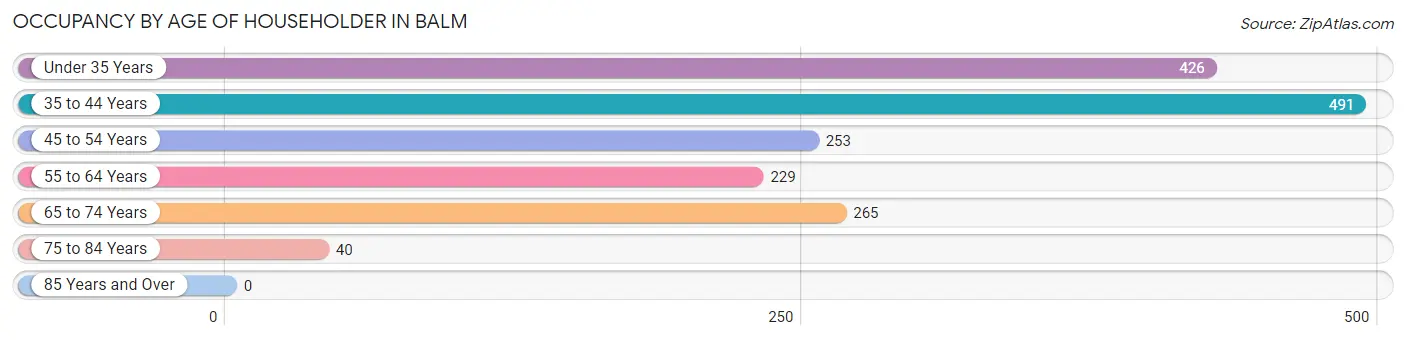
| Age Bracket | # Households | % Households |
| Under 35 Years | 426 | 25.0% |
| 35 to 44 Years | 491 | 28.8% |
| 45 to 54 Years | 253 | 14.8% |
| 55 to 64 Years | 229 | 13.4% |
| 65 to 74 Years | 265 | 15.5% |
| 75 to 84 Years | 40 | 2.4% |
| 85 Years and Over | 0 | 0.0% |
| Total | 1,704 | 100.0% |
Housing Finances in Balm
Median Income by Occupancy in Balm
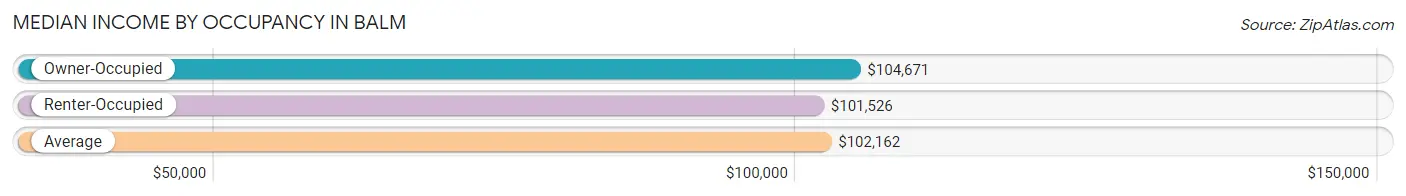
| Occupancy Type | # Households | Median Income |
| Owner-Occupied | 1,479 (86.8%) | $104,671 |
| Renter-Occupied | 225 (13.2%) | $101,526 |
| Average | 1,704 (100.0%) | $102,162 |
Occupancy by Householder Income Bracket in Balm
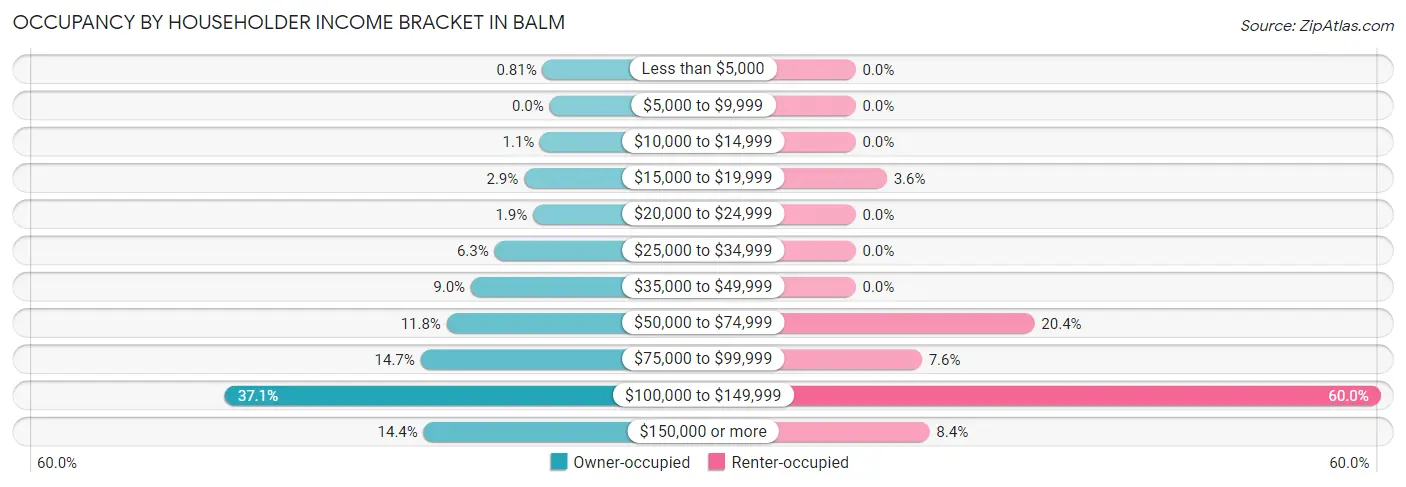
| Income Bracket | Owner-occupied | Renter-occupied |
| Less than $5,000 | 12 (0.8%) | 0 (0.0%) |
| $5,000 to $9,999 | 0 (0.0%) | 0 (0.0%) |
| $10,000 to $14,999 | 16 (1.1%) | 0 (0.0%) |
| $15,000 to $19,999 | 43 (2.9%) | 8 (3.6%) |
| $20,000 to $24,999 | 28 (1.9%) | 0 (0.0%) |
| $25,000 to $34,999 | 93 (6.3%) | 0 (0.0%) |
| $35,000 to $49,999 | 133 (9.0%) | 0 (0.0%) |
| $50,000 to $74,999 | 174 (11.8%) | 46 (20.4%) |
| $75,000 to $99,999 | 218 (14.7%) | 17 (7.6%) |
| $100,000 to $149,999 | 549 (37.1%) | 135 (60.0%) |
| $150,000 or more | 213 (14.4%) | 19 (8.4%) |
| Total | 1,479 (100.0%) | 225 (100.0%) |
Monthly Housing Cost Tiers in Balm
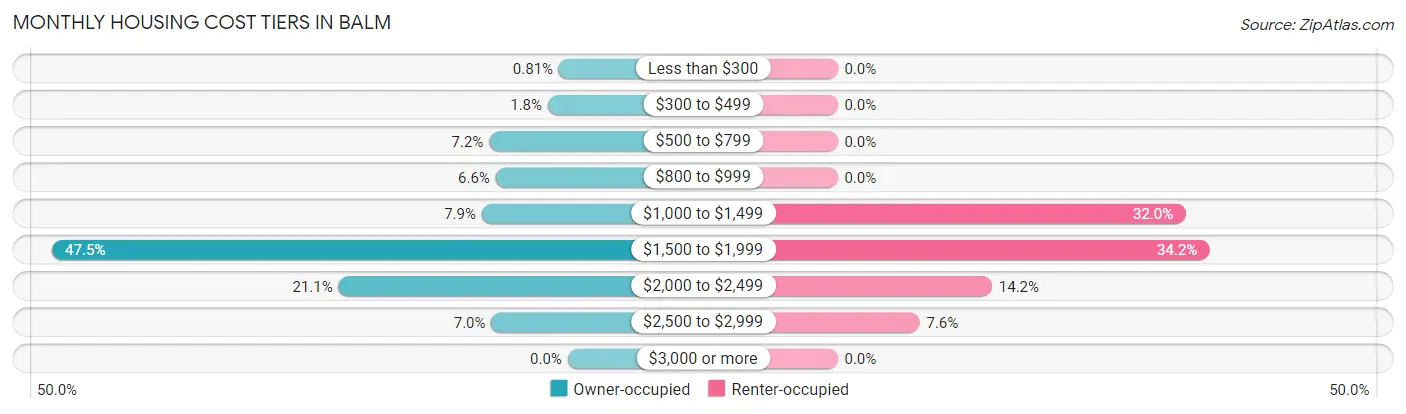
| Monthly Cost | Owner-occupied | Renter-occupied |
| Less than $300 | 12 (0.8%) | 0 (0.0%) |
| $300 to $499 | 27 (1.8%) | 0 (0.0%) |
| $500 to $799 | 107 (7.2%) | 0 (0.0%) |
| $800 to $999 | 98 (6.6%) | 0 (0.0%) |
| $1,000 to $1,499 | 117 (7.9%) | 72 (32.0%) |
| $1,500 to $1,999 | 702 (47.5%) | 77 (34.2%) |
| $2,000 to $2,499 | 312 (21.1%) | 32 (14.2%) |
| $2,500 to $2,999 | 104 (7.0%) | 17 (7.6%) |
| $3,000 or more | 0 (0.0%) | 0 (0.0%) |
| Total | 1,479 (100.0%) | 225 (100.0%) |
Physical Housing Characteristics in Balm
Housing Structures in Balm
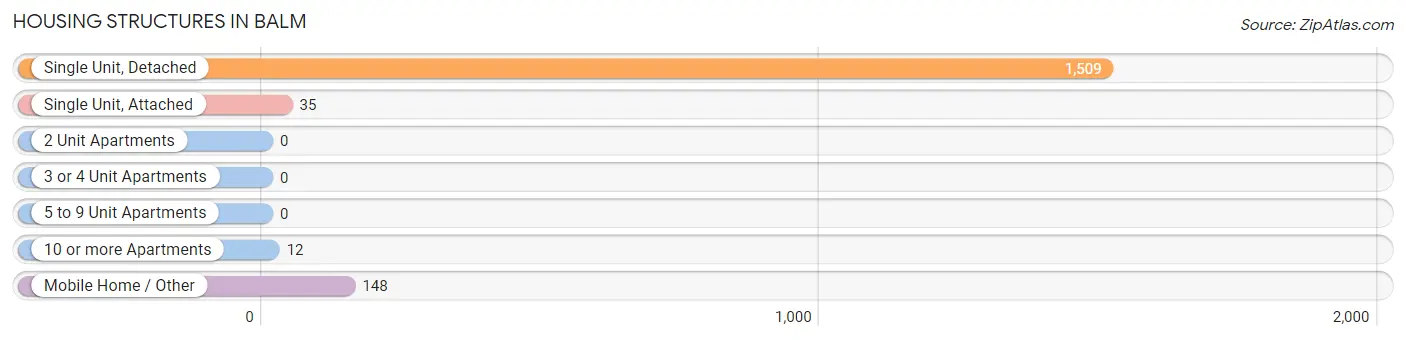
| Structure Type | # Housing Units | % Housing Units |
| Single Unit, Detached | 1,509 | 88.6% |
| Single Unit, Attached | 35 | 2.1% |
| 2 Unit Apartments | 0 | 0.0% |
| 3 or 4 Unit Apartments | 0 | 0.0% |
| 5 to 9 Unit Apartments | 0 | 0.0% |
| 10 or more Apartments | 12 | 0.7% |
| Mobile Home / Other | 148 | 8.7% |
| Total | 1,704 | 100.0% |
Housing Structures by Occupancy in Balm
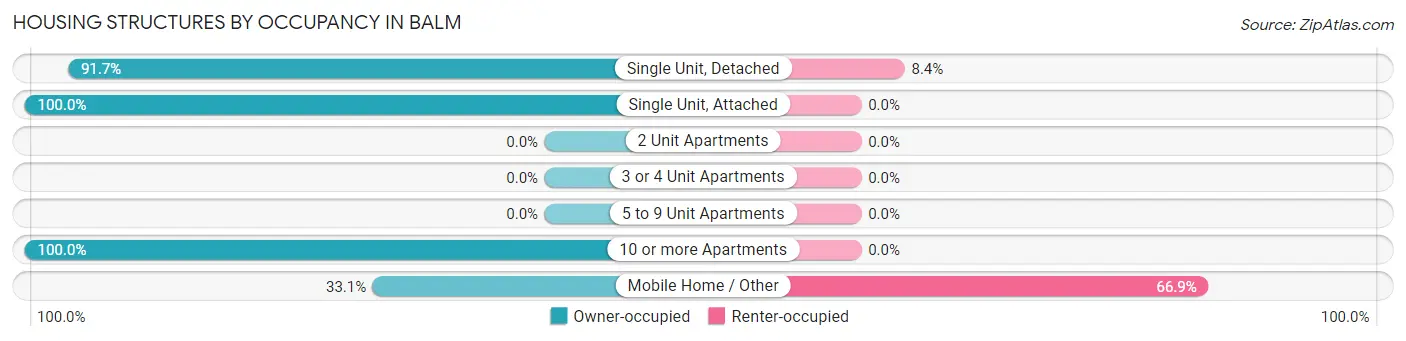
| Structure Type | Owner-occupied | Renter-occupied |
| Single Unit, Detached | 1,383 (91.6%) | 126 (8.4%) |
| Single Unit, Attached | 35 (100.0%) | 0 (0.0%) |
| 2 Unit Apartments | 0 (0.0%) | 0 (0.0%) |
| 3 or 4 Unit Apartments | 0 (0.0%) | 0 (0.0%) |
| 5 to 9 Unit Apartments | 0 (0.0%) | 0 (0.0%) |
| 10 or more Apartments | 12 (100.0%) | 0 (0.0%) |
| Mobile Home / Other | 49 (33.1%) | 99 (66.9%) |
| Total | 1,479 (86.8%) | 225 (13.2%) |
Housing Structures by Number of Rooms in Balm
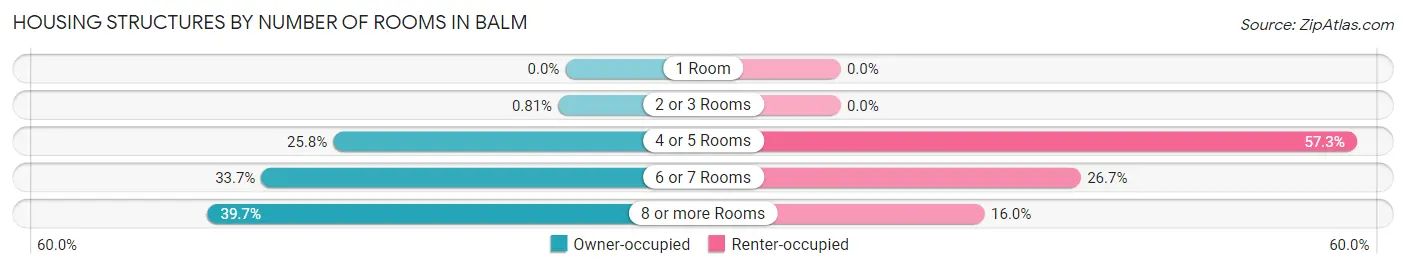
| Number of Rooms | Owner-occupied | Renter-occupied |
| 1 Room | 0 (0.0%) | 0 (0.0%) |
| 2 or 3 Rooms | 12 (0.8%) | 0 (0.0%) |
| 4 or 5 Rooms | 381 (25.8%) | 129 (57.3%) |
| 6 or 7 Rooms | 499 (33.7%) | 60 (26.7%) |
| 8 or more Rooms | 587 (39.7%) | 36 (16.0%) |
| Total | 1,479 (100.0%) | 225 (100.0%) |
Housing Structure by Heating Type in Balm
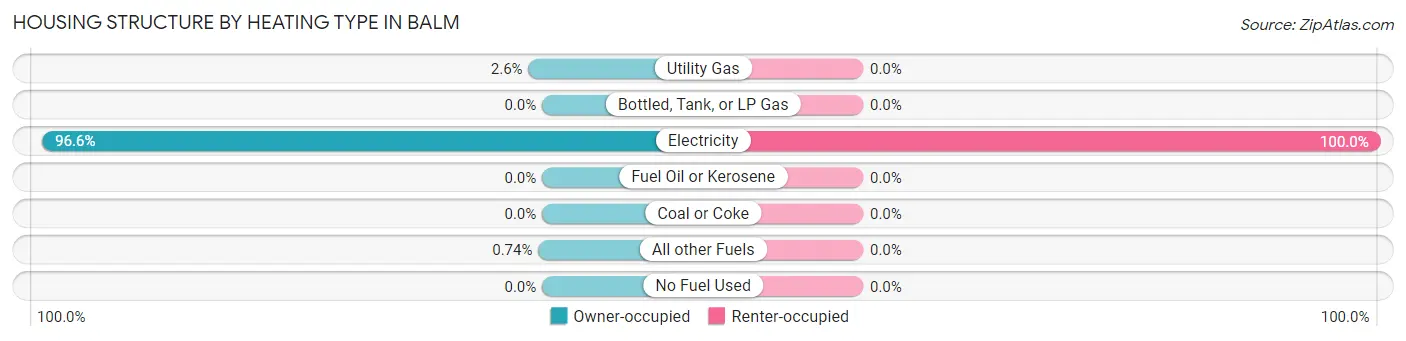
| Heating Type | Owner-occupied | Renter-occupied |
| Utility Gas | 39 (2.6%) | 0 (0.0%) |
| Bottled, Tank, or LP Gas | 0 (0.0%) | 0 (0.0%) |
| Electricity | 1,429 (96.6%) | 225 (100.0%) |
| Fuel Oil or Kerosene | 0 (0.0%) | 0 (0.0%) |
| Coal or Coke | 0 (0.0%) | 0 (0.0%) |
| All other Fuels | 11 (0.7%) | 0 (0.0%) |
| No Fuel Used | 0 (0.0%) | 0 (0.0%) |
| Total | 1,479 (100.0%) | 225 (100.0%) |
Household Vehicle Usage in Balm
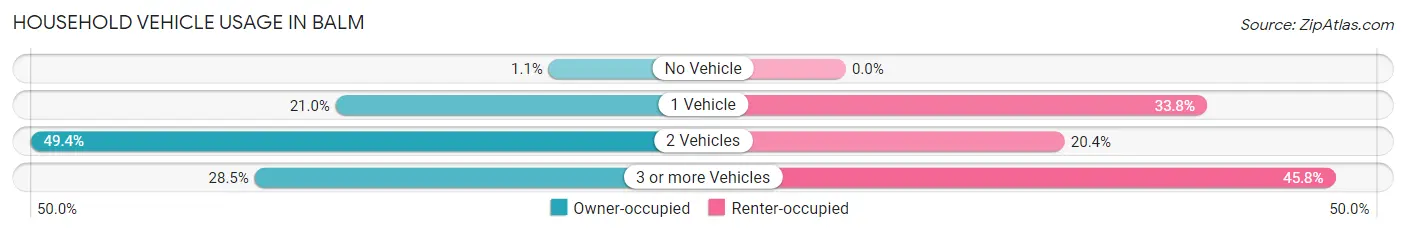
| Vehicles per Household | Owner-occupied | Renter-occupied |
| No Vehicle | 16 (1.1%) | 0 (0.0%) |
| 1 Vehicle | 310 (21.0%) | 76 (33.8%) |
| 2 Vehicles | 731 (49.4%) | 46 (20.4%) |
| 3 or more Vehicles | 422 (28.5%) | 103 (45.8%) |
| Total | 1,479 (100.0%) | 225 (100.0%) |
Real Estate & Mortgages in Balm
Real Estate and Mortgage Overview in Balm
| Characteristic | Without Mortgage | With Mortgage |
| Housing Units | 201 | 1,278 |
| Median Property Value | $337,900 | $292,500 |
| Median Household Income | $88,565 | $211 |
| Monthly Housing Costs | $658 | $0 |
| Real Estate Taxes | $3,600 | $36 |
Property Value by Mortgage Status in Balm
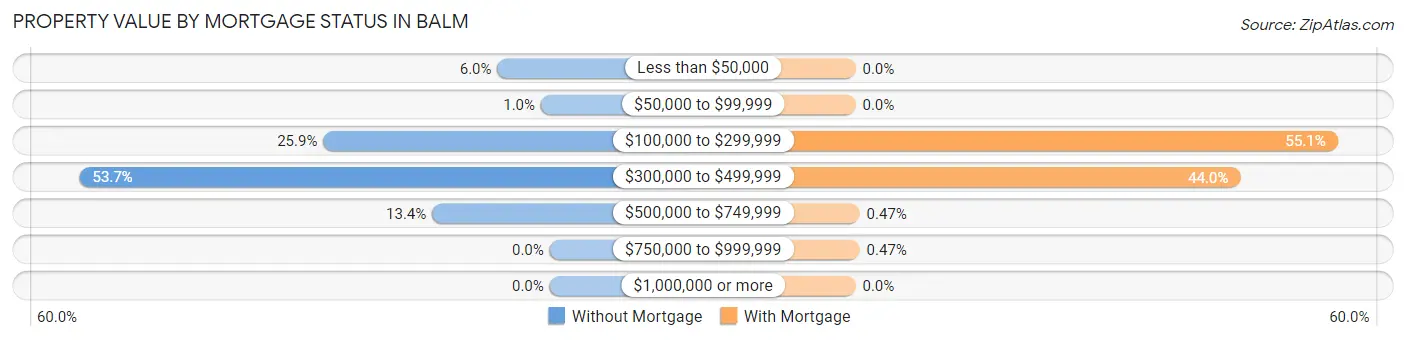
| Property Value | Without Mortgage | With Mortgage |
| Less than $50,000 | 12 (6.0%) | 0 (0.0%) |
| $50,000 to $99,999 | 2 (1.0%) | 0 (0.0%) |
| $100,000 to $299,999 | 52 (25.9%) | 704 (55.1%) |
| $300,000 to $499,999 | 108 (53.7%) | 562 (44.0%) |
| $500,000 to $749,999 | 27 (13.4%) | 6 (0.5%) |
| $750,000 to $999,999 | 0 (0.0%) | 6 (0.5%) |
| $1,000,000 or more | 0 (0.0%) | 0 (0.0%) |
| Total | 201 (100.0%) | 1,278 (100.0%) |
Household Income by Mortgage Status in Balm
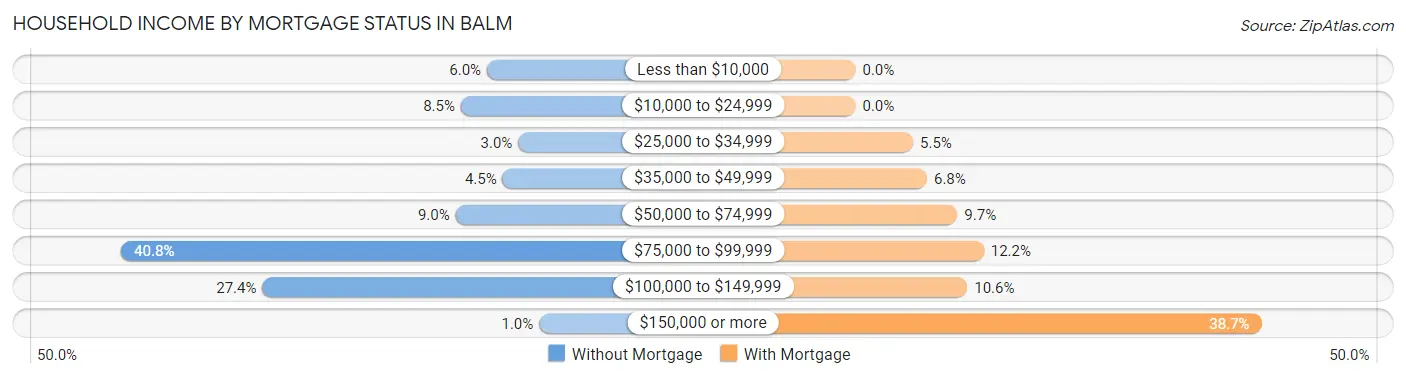
| Household Income | Without Mortgage | With Mortgage |
| Less than $10,000 | 12 (6.0%) | 0 (0.0%) |
| $10,000 to $24,999 | 17 (8.5%) | 0 (0.0%) |
| $25,000 to $34,999 | 6 (3.0%) | 70 (5.5%) |
| $35,000 to $49,999 | 9 (4.5%) | 87 (6.8%) |
| $50,000 to $74,999 | 18 (9.0%) | 124 (9.7%) |
| $75,000 to $99,999 | 82 (40.8%) | 156 (12.2%) |
| $100,000 to $149,999 | 55 (27.4%) | 136 (10.6%) |
| $150,000 or more | 2 (1.0%) | 494 (38.7%) |
| Total | 201 (100.0%) | 1,278 (100.0%) |
Property Value to Household Income Ratio in Balm
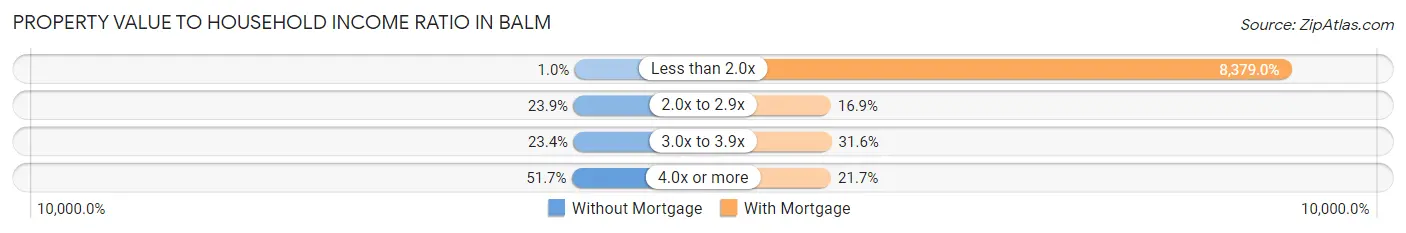
| Value-to-Income Ratio | Without Mortgage | With Mortgage |
| Less than 2.0x | 2 (1.0%) | 107,083 (8,379.0%) |
| 2.0x to 2.9x | 48 (23.9%) | 216 (16.9%) |
| 3.0x to 3.9x | 47 (23.4%) | 404 (31.6%) |
| 4.0x or more | 104 (51.7%) | 277 (21.7%) |
| Total | 201 (100.0%) | 1,278 (100.0%) |
Real Estate Taxes by Mortgage Status in Balm
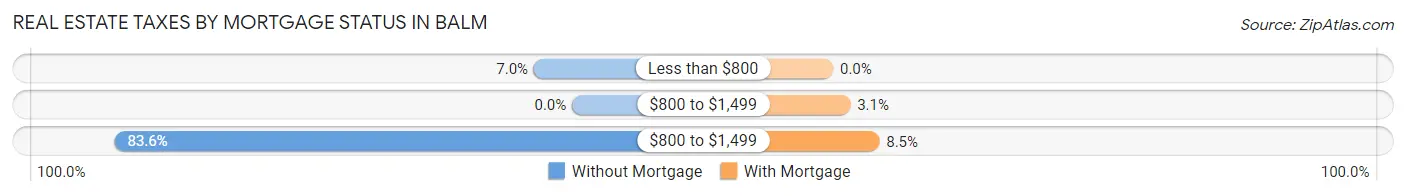
| Property Taxes | Without Mortgage | With Mortgage |
| Less than $800 | 14 (7.0%) | 0 (0.0%) |
| $800 to $1,499 | 0 (0.0%) | 40 (3.1%) |
| $800 to $1,499 | 168 (83.6%) | 108 (8.5%) |
| Total | 201 (100.0%) | 1,278 (100.0%) |
Health & Disability in Balm
Health Insurance Coverage by Age in Balm
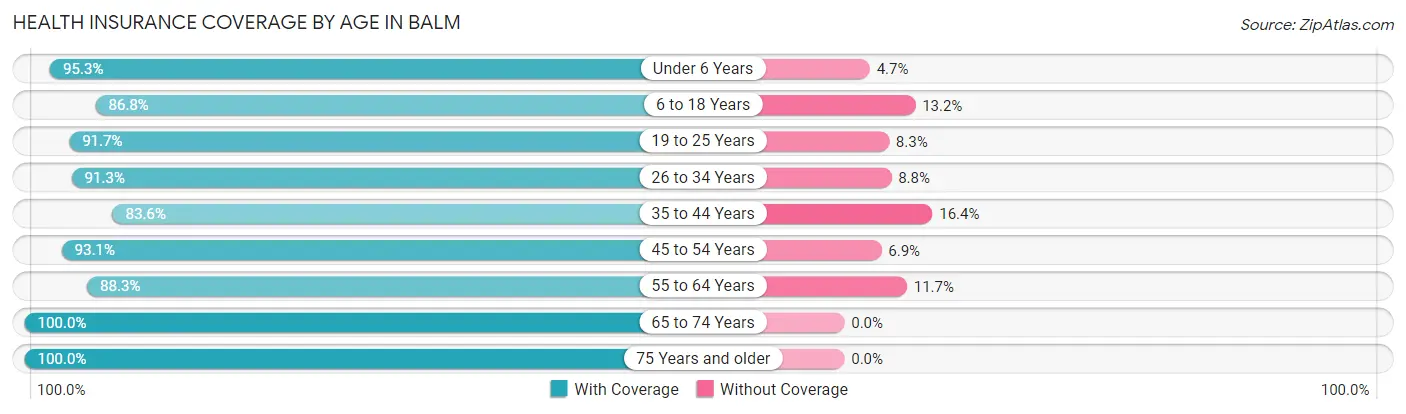
| Age Bracket | With Coverage | Without Coverage |
| Under 6 Years | 462 (95.3%) | 23 (4.7%) |
| 6 to 18 Years | 827 (86.8%) | 126 (13.2%) |
| 19 to 25 Years | 430 (91.7%) | 39 (8.3%) |
| 26 to 34 Years | 959 (91.2%) | 92 (8.7%) |
| 35 to 44 Years | 759 (83.6%) | 149 (16.4%) |
| 45 to 54 Years | 525 (93.1%) | 39 (6.9%) |
| 55 to 64 Years | 341 (88.3%) | 45 (11.7%) |
| 65 to 74 Years | 419 (100.0%) | 0 (0.0%) |
| 75 Years and older | 135 (100.0%) | 0 (0.0%) |
| Total | 4,857 (90.4%) | 513 (9.6%) |
Health Insurance Coverage by Citizenship Status in Balm
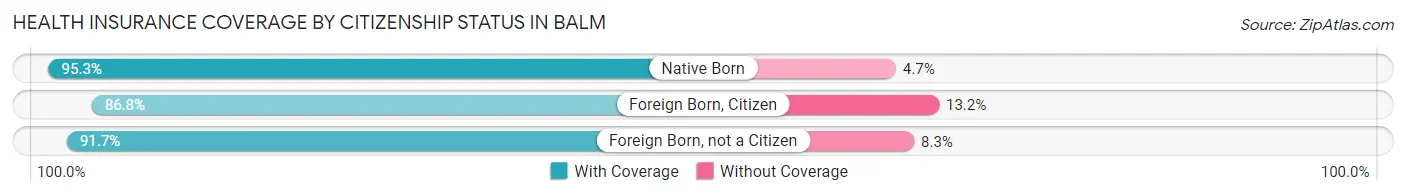
| Citizenship Status | With Coverage | Without Coverage |
| Native Born | 462 (95.3%) | 23 (4.7%) |
| Foreign Born, Citizen | 827 (86.8%) | 126 (13.2%) |
| Foreign Born, not a Citizen | 430 (91.7%) | 39 (8.3%) |
Health Insurance Coverage by Household Income in Balm
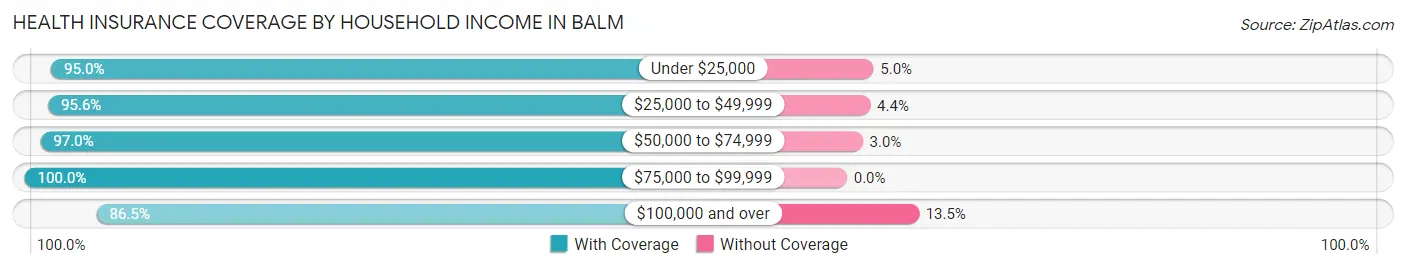
| Household Income | With Coverage | Without Coverage |
| Under $25,000 | 229 (95.0%) | 12 (5.0%) |
| $25,000 to $49,999 | 437 (95.6%) | 20 (4.4%) |
| $50,000 to $74,999 | 623 (97.0%) | 19 (3.0%) |
| $75,000 to $99,999 | 600 (100.0%) | 0 (0.0%) |
| $100,000 and over | 2,968 (86.5%) | 462 (13.5%) |
Public vs Private Health Insurance Coverage by Age in Balm
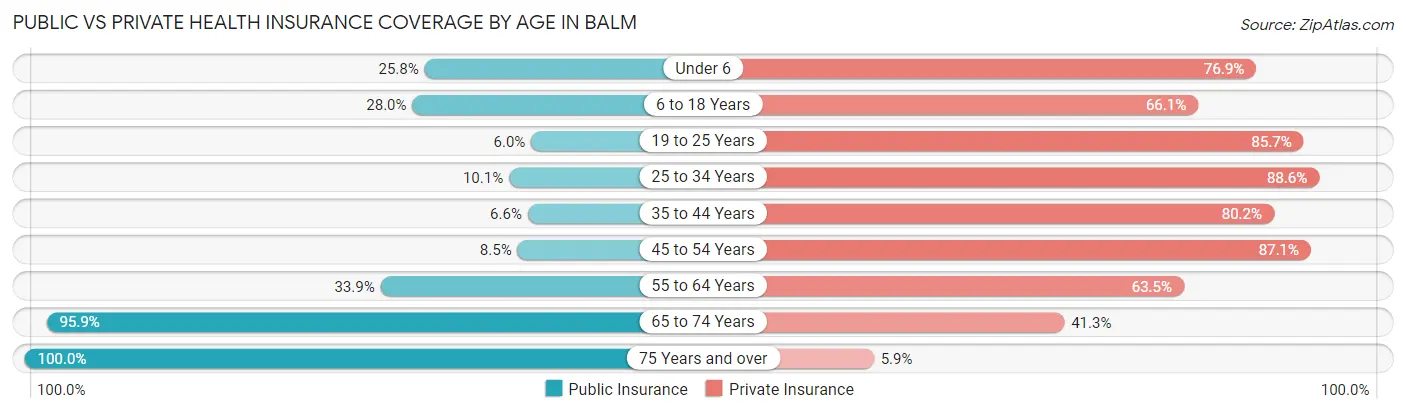
| Age Bracket | Public Insurance | Private Insurance |
| Under 6 | 125 (25.8%) | 373 (76.9%) |
| 6 to 18 Years | 267 (28.0%) | 630 (66.1%) |
| 19 to 25 Years | 28 (6.0%) | 402 (85.7%) |
| 25 to 34 Years | 106 (10.1%) | 931 (88.6%) |
| 35 to 44 Years | 60 (6.6%) | 728 (80.2%) |
| 45 to 54 Years | 48 (8.5%) | 491 (87.1%) |
| 55 to 64 Years | 131 (33.9%) | 245 (63.5%) |
| 65 to 74 Years | 402 (95.9%) | 173 (41.3%) |
| 75 Years and over | 135 (100.0%) | 8 (5.9%) |
| Total | 1,302 (24.2%) | 3,981 (74.1%) |
Disability Status by Sex by Age in Balm
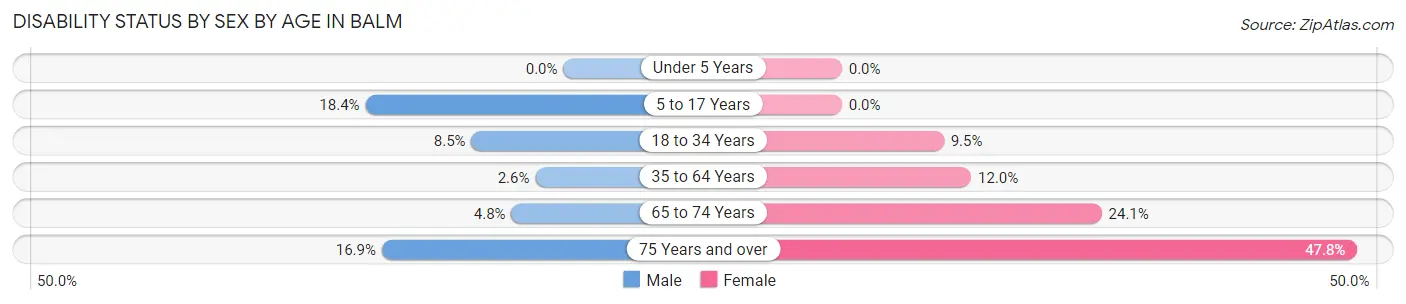
| Age Bracket | Male | Female |
| Under 5 Years | 0 (0.0%) | 0 (0.0%) |
| 5 to 17 Years | 72 (18.4%) | 0 (0.0%) |
| 18 to 34 Years | 72 (8.5%) | 66 (9.5%) |
| 35 to 64 Years | 23 (2.6%) | 117 (12.0%) |
| 65 to 74 Years | 8 (4.8%) | 61 (24.1%) |
| 75 Years and over | 15 (16.9%) | 22 (47.8%) |
Disability Class by Sex by Age in Balm
Disability Class: Hearing Difficulty
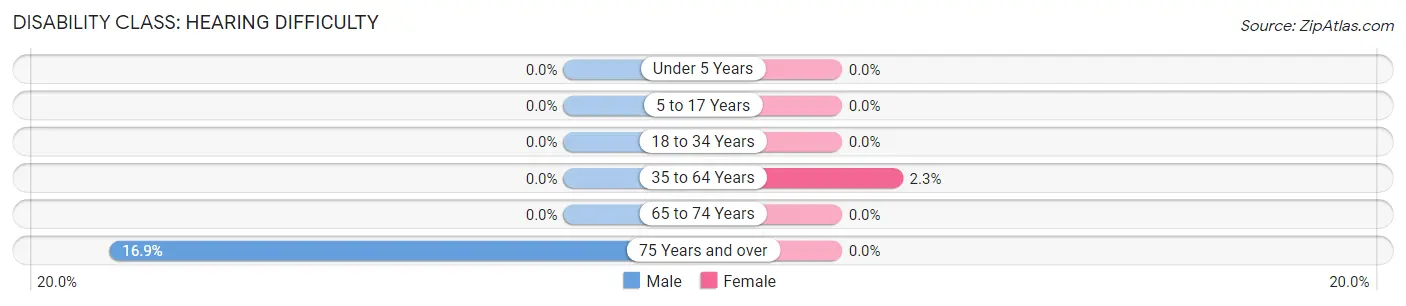
| Age Bracket | Male | Female |
| Under 5 Years | 0 (0.0%) | 0 (0.0%) |
| 5 to 17 Years | 0 (0.0%) | 0 (0.0%) |
| 18 to 34 Years | 0 (0.0%) | 0 (0.0%) |
| 35 to 64 Years | 0 (0.0%) | 22 (2.3%) |
| 65 to 74 Years | 0 (0.0%) | 0 (0.0%) |
| 75 Years and over | 15 (16.9%) | 0 (0.0%) |
Disability Class: Vision Difficulty
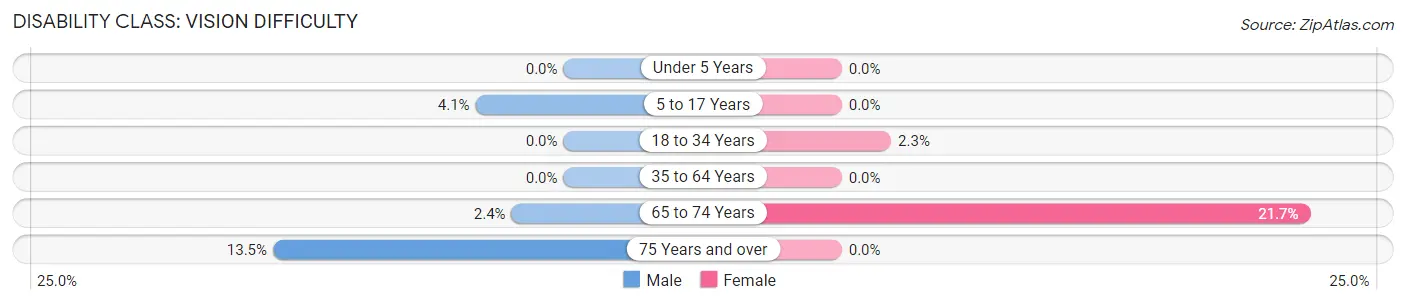
| Age Bracket | Male | Female |
| Under 5 Years | 0 (0.0%) | 0 (0.0%) |
| 5 to 17 Years | 16 (4.1%) | 0 (0.0%) |
| 18 to 34 Years | 0 (0.0%) | 16 (2.3%) |
| 35 to 64 Years | 0 (0.0%) | 0 (0.0%) |
| 65 to 74 Years | 4 (2.4%) | 55 (21.7%) |
| 75 Years and over | 12 (13.5%) | 0 (0.0%) |
Disability Class: Cognitive Difficulty
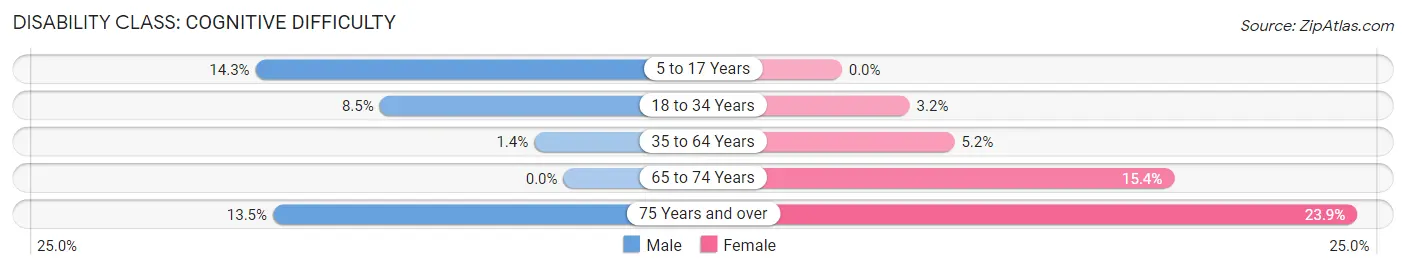
| Age Bracket | Male | Female |
| 5 to 17 Years | 56 (14.3%) | 0 (0.0%) |
| 18 to 34 Years | 72 (8.5%) | 22 (3.2%) |
| 35 to 64 Years | 12 (1.4%) | 51 (5.2%) |
| 65 to 74 Years | 0 (0.0%) | 39 (15.4%) |
| 75 Years and over | 12 (13.5%) | 11 (23.9%) |
Disability Class: Ambulatory Difficulty
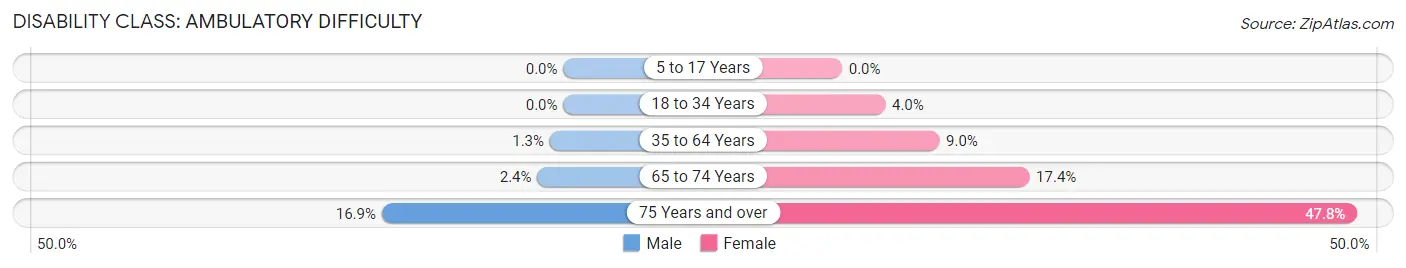
| Age Bracket | Male | Female |
| 5 to 17 Years | 0 (0.0%) | 0 (0.0%) |
| 18 to 34 Years | 0 (0.0%) | 28 (4.0%) |
| 35 to 64 Years | 11 (1.3%) | 88 (9.0%) |
| 65 to 74 Years | 4 (2.4%) | 44 (17.4%) |
| 75 Years and over | 15 (16.9%) | 22 (47.8%) |
Disability Class: Self-Care Difficulty
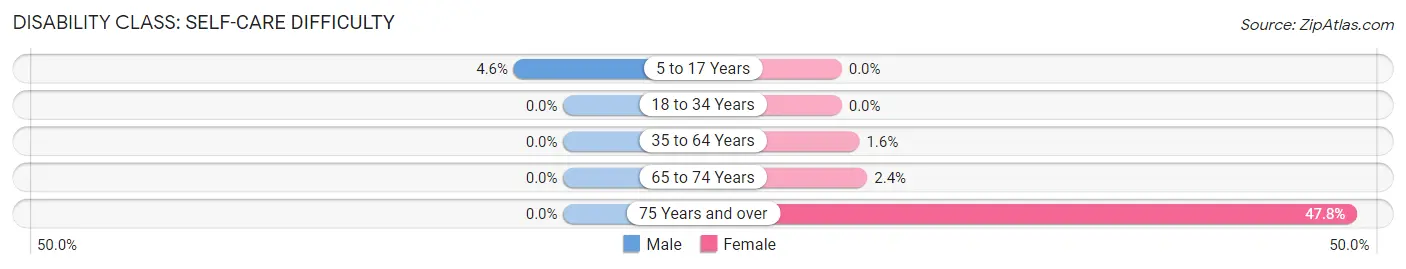
| Age Bracket | Male | Female |
| 5 to 17 Years | 18 (4.6%) | 0 (0.0%) |
| 18 to 34 Years | 0 (0.0%) | 0 (0.0%) |
| 35 to 64 Years | 0 (0.0%) | 16 (1.6%) |
| 65 to 74 Years | 0 (0.0%) | 6 (2.4%) |
| 75 Years and over | 0 (0.0%) | 22 (47.8%) |
Technology Access in Balm
Computing Device Access in Balm
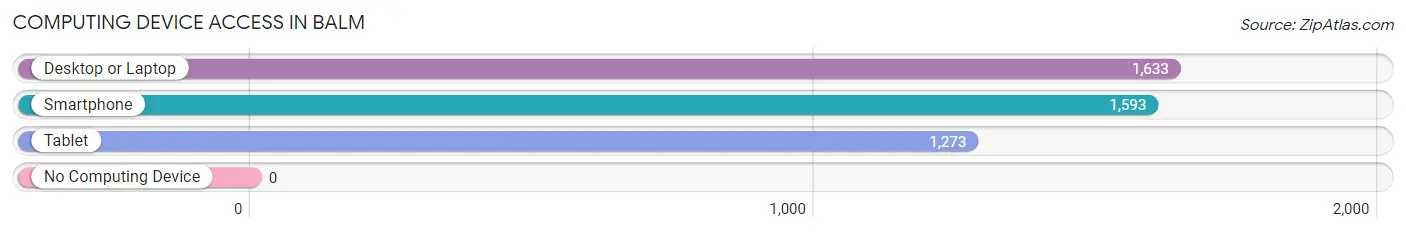
| Device Type | # Households | % Households |
| Desktop or Laptop | 1,633 | 95.8% |
| Smartphone | 1,593 | 93.5% |
| Tablet | 1,273 | 74.7% |
| No Computing Device | 0 | 0.0% |
| Total | 1,704 | 100.0% |
Internet Access in Balm
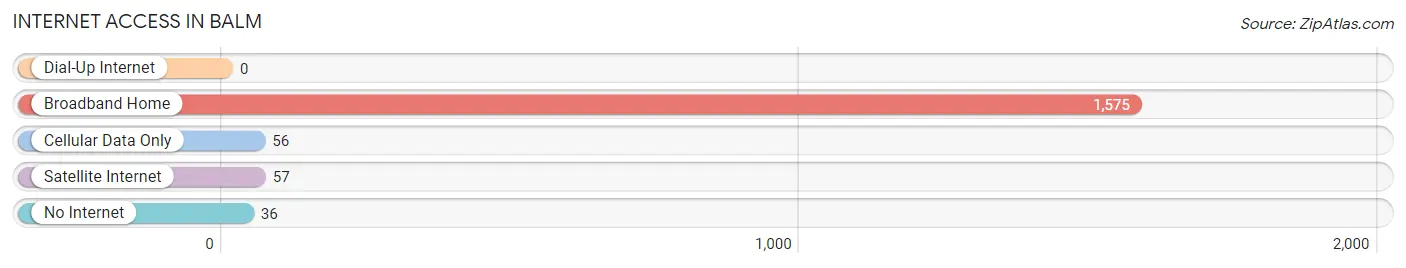
| Internet Type | # Households | % Households |
| Dial-Up Internet | 0 | 0.0% |
| Broadband Home | 1,575 | 92.4% |
| Cellular Data Only | 56 | 3.3% |
| Satellite Internet | 57 | 3.4% |
| No Internet | 36 | 2.1% |
| Total | 1,704 | 100.0% |
Balm Summary
Balm is an unincorporated community located in Hillsborough County, Florida, United States. It is located about 25 miles east of Tampa and is part of the Tampa-St. Petersburg-Clearwater Metropolitan Statistical Area. The population of Balm was estimated to be 1,845 in 2019.
History
The area now known as Balm was originally inhabited by the Seminole Indians. The first settlers in the area were farmers who arrived in the late 1800s. The community was named after the Balm family, who were among the first settlers in the area. The Balm family owned a large amount of land in the area and operated a general store.
In the early 1900s, the area began to grow as more settlers moved to the area. The community was officially incorporated in 1925. The town was home to a post office, a school, a church, and several businesses.
Geography
Balm is located in Hillsborough County, Florida, about 25 miles east of Tampa. The town is situated on the banks of the Alafia River. The town is surrounded by a variety of natural features, including wetlands, forests, and lakes. The town is located in a humid subtropical climate zone, with hot, humid summers and mild winters.
Economy
The economy of Balm is largely based on agriculture and tourism. The town is home to several farms, which produce a variety of crops, including citrus fruits, vegetables, and hay. The town is also home to several tourist attractions, including the Balm-Boyette Scrub Nature Preserve, which is a popular destination for hikers and birdwatchers.
Demographics
As of 2019, the population of Balm was estimated to be 1,845. The population is largely white (90.2%), with a small percentage of African Americans (4.2%), Hispanics (3.2%), and Asians (1.2%). The median household income in Balm is $50,945, and the median home value is $179,400. The town has a poverty rate of 11.2%.
Conclusion
Balm is a small unincorporated community located in Hillsborough County, Florida. The town has a long history, dating back to the late 1800s when the first settlers arrived in the area. The economy of Balm is largely based on agriculture and tourism, and the town is home to a variety of natural features, including wetlands, forests, and lakes. The population of Balm is largely white, with a small percentage of African Americans, Hispanics, and Asians. The median household income in Balm is $50,945, and the median home value is $179,400.
Common Questions
What is Per Capita Income in Balm?
Per Capita income in Balm is $33,489.
What is the Median Family Income in Balm?
Median Family Income in Balm is $101,841.
What is the Median Household income in Balm?
Median Household Income in Balm is $102,162.
What is Income or Wage Gap in Balm?
Income or Wage Gap in Balm is 20.0%.
Women in Balm earn 80.0 cents for every dollar earned by a man.
What is Inequality or Gini Index in Balm?
Inequality or Gini Index in Balm is 0.30.
What is the Total Population of Balm?
Total Population of Balm is 5,397.
What is the Total Male Population of Balm?
Total Male Population of Balm is 2,579.
What is the Total Female Population of Balm?
Total Female Population of Balm is 2,818.
What is the Ratio of Males per 100 Females in Balm?
There are 91.52 Males per 100 Females in Balm.
What is the Ratio of Females per 100 Males in Balm?
There are 109.27 Females per 100 Males in Balm.
What is the Median Population Age in Balm?
Median Population Age in Balm is 32.8 Years.
What is the Average Family Size in Balm
Average Family Size in Balm is 3.5 People.
What is the Average Household Size in Balm
Average Household Size in Balm is 3.2 People.
How Large is the Labor Force in Balm?
There are 3,093 People in the Labor Forcein in Balm.
What is the Percentage of People in the Labor Force in Balm?
72.6% of People are in the Labor Force in Balm.
What is the Unemployment Rate in Balm?
Unemployment Rate in Balm is 2.6%.