Azalea Park, FL Map & Demographics
Azalea Park Map
Azalea Park Overview
$27,132
PER CAPITA INCOME
$61,393
AVG FAMILY INCOME
$59,231
AVG HOUSEHOLD INCOME
16.6%
WAGE / INCOME GAP [ % ]
83.4¢/ $1
WAGE / INCOME GAP [ $ ]
$9,962
FAMILY INCOME DEFICIT
0.40
INEQUALITY / GINI INDEX
16,024
TOTAL POPULATION
8,208
MALE POPULATION
7,816
FEMALE POPULATION
105.02
MALES / 100 FEMALES
95.22
FEMALES / 100 MALES
35.7
MEDIAN AGE
3.3
AVG FAMILY SIZE
2.9
AVG HOUSEHOLD SIZE
8,785
LABOR FORCE [ PEOPLE ]
66.9%
PERCENT IN LABOR FORCE
6.7%
UNEMPLOYMENT RATE
Income in Azalea Park
Income Overview in Azalea Park
Per Capita Income in Azalea Park is $27,132, while median incomes of families and households are $61,393 and $59,231 respectively.
| Characteristic | Number | Measure |
| Per Capita Income | 16,024 | $27,132 |
| Median Family Income | 3,958 | $61,393 |
| Mean Family Income | 3,958 | $77,174 |
| Median Household Income | 5,521 | $59,231 |
| Mean Household Income | 5,521 | $73,577 |
| Income Deficit | 3,958 | $9,962 |
| Wage / Income Gap (%) | 16,024 | 16.60% |
| Wage / Income Gap ($) | 16,024 | 83.40¢ per $1 |
| Gini / Inequality Index | 16,024 | 0.40 |
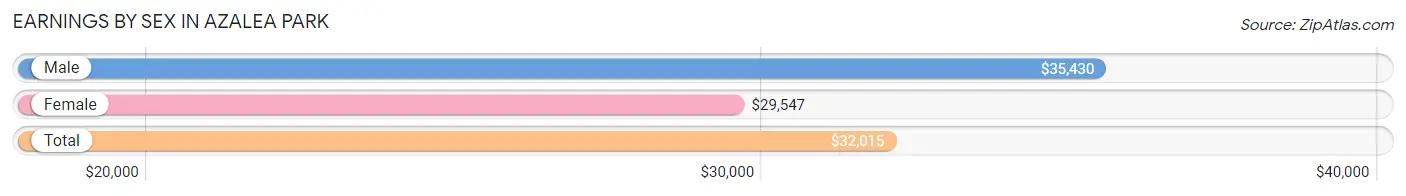
Earnings by Sex in Azalea Park
Average Earnings in Azalea Park are $32,015, $35,430 for men and $29,547 for women, a difference of 16.6%.
| Sex | Number | Average Earnings |
| Male | 4,844 (54.6%) | $35,430 |
| Female | 4,026 (45.4%) | $29,547 |
| Total | 8,870 (100.0%) | $32,015 |
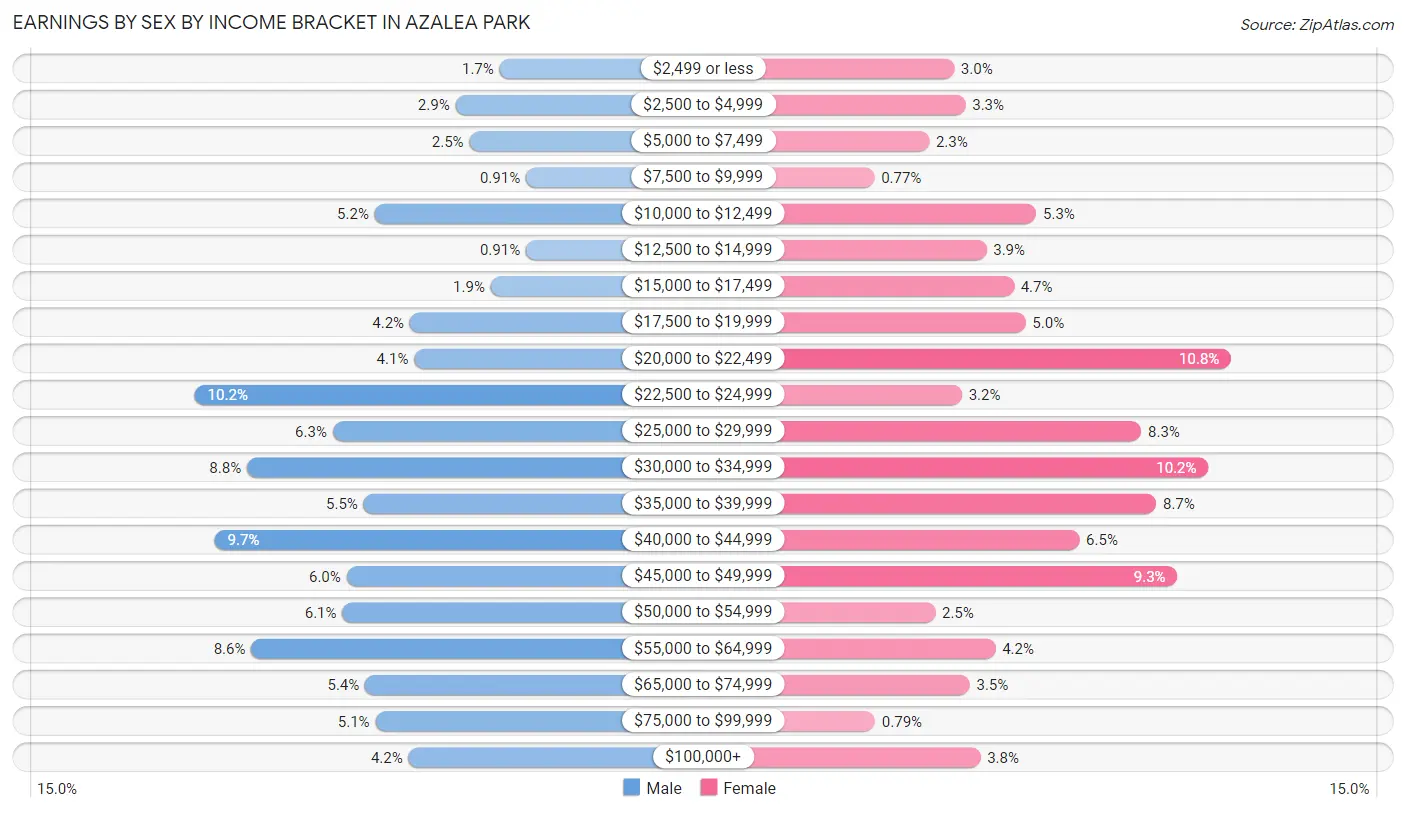
Earnings by Sex by Income Bracket in Azalea Park
The most common earnings brackets in Azalea Park are $22,500 to $24,999 for men (495 | 10.2%) and $20,000 to $22,499 for women (435 | 10.8%).
| Income | Male | Female |
| $2,499 or less | 80 (1.7%) | 121 (3.0%) |
| $2,500 to $4,999 | 140 (2.9%) | 134 (3.3%) |
| $5,000 to $7,499 | 121 (2.5%) | 93 (2.3%) |
| $7,500 to $9,999 | 44 (0.9%) | 31 (0.8%) |
| $10,000 to $12,499 | 250 (5.2%) | 214 (5.3%) |
| $12,500 to $14,999 | 44 (0.9%) | 158 (3.9%) |
| $15,000 to $17,499 | 92 (1.9%) | 189 (4.7%) |
| $17,500 to $19,999 | 202 (4.2%) | 202 (5.0%) |
| $20,000 to $22,499 | 196 (4.1%) | 435 (10.8%) |
| $22,500 to $24,999 | 495 (10.2%) | 130 (3.2%) |
| $25,000 to $29,999 | 307 (6.3%) | 333 (8.3%) |
| $30,000 to $34,999 | 424 (8.7%) | 409 (10.2%) |
| $35,000 to $39,999 | 265 (5.5%) | 350 (8.7%) |
| $40,000 to $44,999 | 468 (9.7%) | 263 (6.5%) |
| $45,000 to $49,999 | 288 (5.9%) | 374 (9.3%) |
| $50,000 to $54,999 | 294 (6.1%) | 100 (2.5%) |
| $55,000 to $64,999 | 418 (8.6%) | 168 (4.2%) |
| $65,000 to $74,999 | 263 (5.4%) | 139 (3.5%) |
| $75,000 to $99,999 | 249 (5.1%) | 32 (0.8%) |
| $100,000+ | 204 (4.2%) | 151 (3.7%) |
| Total | 4,844 (100.0%) | 4,026 (100.0%) |
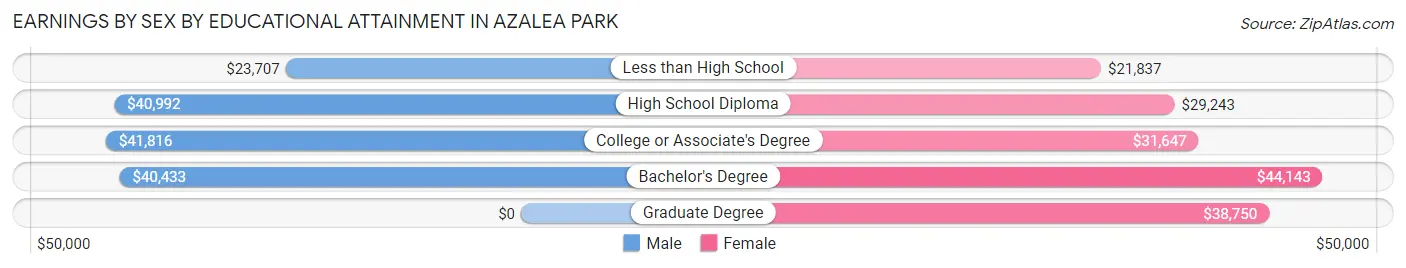
Earnings by Sex by Educational Attainment in Azalea Park
Average earnings in Azalea Park are $39,884 for men and $31,372 for women, a difference of 21.3%. Men with an educational attainment of college or associate's degree enjoy the highest average annual earnings of $41,816, while those with less than high school education earn the least with $23,707. Women with an educational attainment of bachelor's degree earn the most with the average annual earnings of $44,143, while those with less than high school education have the smallest earnings of $21,837.
| Educational Attainment | Male Income | Female Income |
| Less than High School | $23,707 | $21,837 |
| High School Diploma | $40,992 | $29,243 |
| College or Associate's Degree | $41,816 | $31,647 |
| Bachelor's Degree | $40,433 | $44,143 |
| Graduate Degree | - | - |
| Total | $39,884 | $31,372 |
Family Income in Azalea Park
Family Income Brackets in Azalea Park
According to the Azalea Park family income data, there are 1,069 families falling into the $50,000 to $74,999 income range, which is the most common income bracket and makes up 27.0% of all families. Conversely, the less than $10,000 income bracket is the least frequent group with only 91 families (2.3%) belonging to this category.
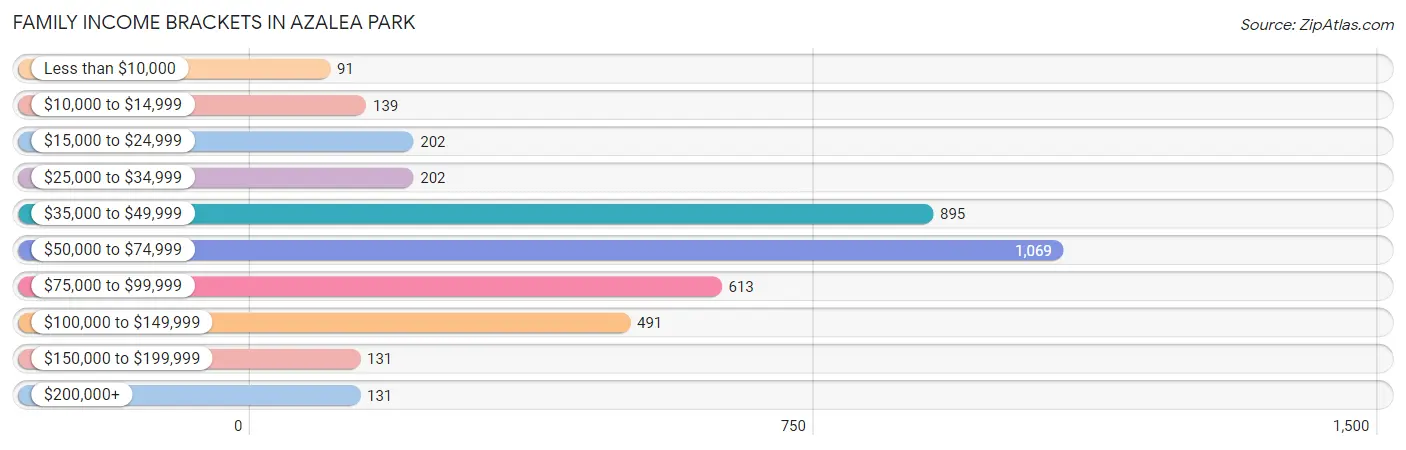
| Income Bracket | # Families | % Families |
| Less than $10,000 | 91 | 2.3% |
| $10,000 to $14,999 | 139 | 3.5% |
| $15,000 to $24,999 | 202 | 5.1% |
| $25,000 to $34,999 | 202 | 5.1% |
| $35,000 to $49,999 | 895 | 22.6% |
| $50,000 to $74,999 | 1,069 | 27.0% |
| $75,000 to $99,999 | 613 | 15.5% |
| $100,000 to $149,999 | 491 | 12.4% |
| $150,000 to $199,999 | 131 | 3.3% |
| $200,000+ | 131 | 3.3% |
Family Income by Famaliy Size in Azalea Park
6-person families (76 | 1.9%) account for the highest median family income in Azalea Park with $85,714 per family, while 2-person families (1,812 | 45.8%) have the highest median income of $31,244 per family member.
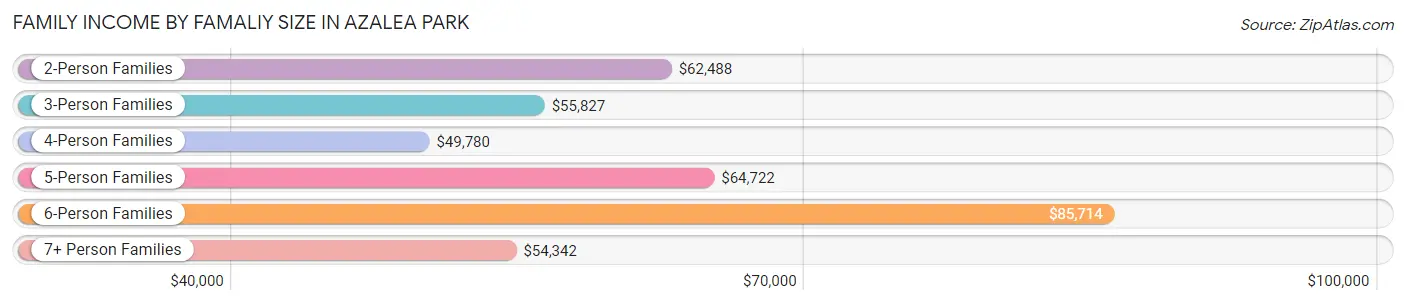
| Income Bracket | # Families | Median Income |
| 2-Person Families | 1,812 (45.8%) | $62,488 |
| 3-Person Families | 939 (23.7%) | $55,827 |
| 4-Person Families | 691 (17.5%) | $49,780 |
| 5-Person Families | 318 (8.0%) | $64,722 |
| 6-Person Families | 76 (1.9%) | $85,714 |
| 7+ Person Families | 122 (3.1%) | $54,342 |
| Total | 3,958 (100.0%) | $61,393 |
Family Income by Number of Earners in Azalea Park
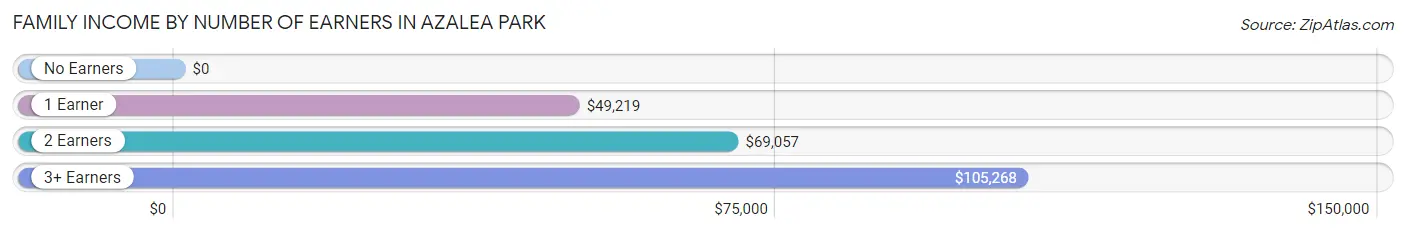
| Number of Earners | # Families | Median Income |
| No Earners | 482 (12.2%) | $0 |
| 1 Earner | 1,351 (34.1%) | $49,219 |
| 2 Earners | 1,628 (41.1%) | $69,057 |
| 3+ Earners | 497 (12.6%) | $105,268 |
| Total | 3,958 (100.0%) | $61,393 |
Household Income in Azalea Park
Household Income Brackets in Azalea Park
With 1,529 households falling in the category, the $50,000 to $74,999 income range is the most frequent in Azalea Park, accounting for 27.7% of all households. In contrast, only 133 households (2.4%) fall into the $150,000 to $199,999 income bracket, making it the least populous group.
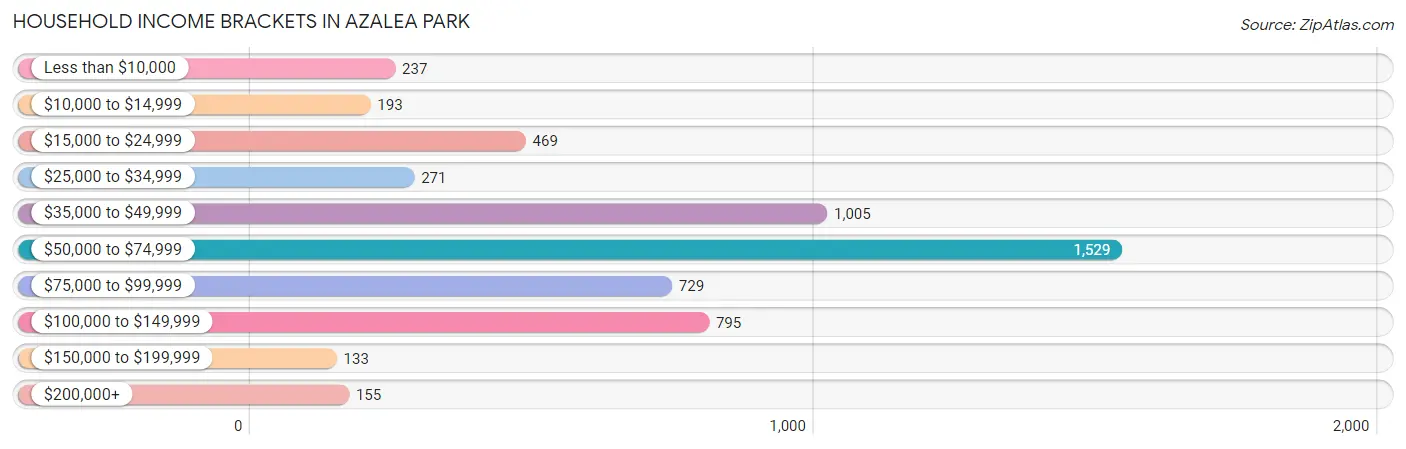
| Income Bracket | # Households | % Households |
| Less than $10,000 | 237 | 4.3% |
| $10,000 to $14,999 | 193 | 3.5% |
| $15,000 to $24,999 | 469 | 8.5% |
| $25,000 to $34,999 | 271 | 4.9% |
| $35,000 to $49,999 | 1,005 | 18.2% |
| $50,000 to $74,999 | 1,529 | 27.7% |
| $75,000 to $99,999 | 729 | 13.2% |
| $100,000 to $149,999 | 795 | 14.4% |
| $150,000 to $199,999 | 133 | 2.4% |
| $200,000+ | 155 | 2.8% |
Household Income by Householder Age in Azalea Park
The median household income in Azalea Park is $59,231, with the highest median household income of $66,386 found in the 45 to 64 years age bracket for the primary householder. A total of 1,925 households (34.9%) fall into this category. Meanwhile, the 15 to 24 years age bracket for the primary householder has the lowest median household income of $50,114, with 126 households (2.3%) in this group.
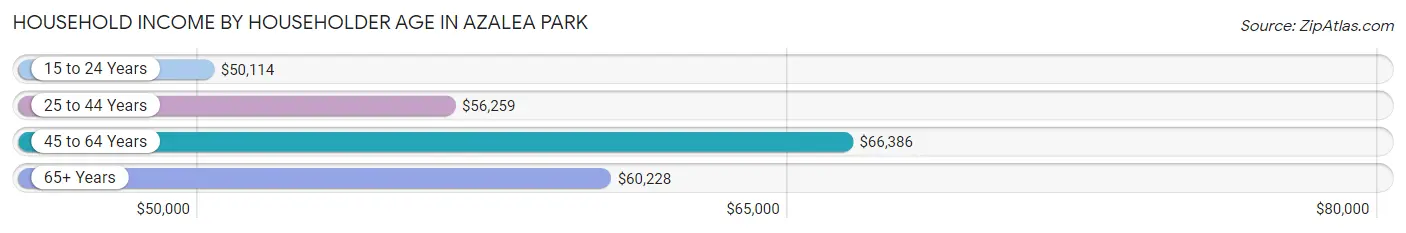
| Income Bracket | # Households | Median Income |
| 15 to 24 Years | 126 (2.3%) | $50,114 |
| 25 to 44 Years | 2,320 (42.0%) | $56,259 |
| 45 to 64 Years | 1,925 (34.9%) | $66,386 |
| 65+ Years | 1,150 (20.8%) | $60,228 |
| Total | 5,521 (100.0%) | $59,231 |
Poverty in Azalea Park
Income Below Poverty by Sex and Age in Azalea Park
With 13.5% poverty level for males and 15.9% for females among the residents of Azalea Park, 12 to 14 year old males and 12 to 14 year old females are the most vulnerable to poverty, with 131 males (50.4%) and 127 females (44.7%) in their respective age groups living below the poverty level.
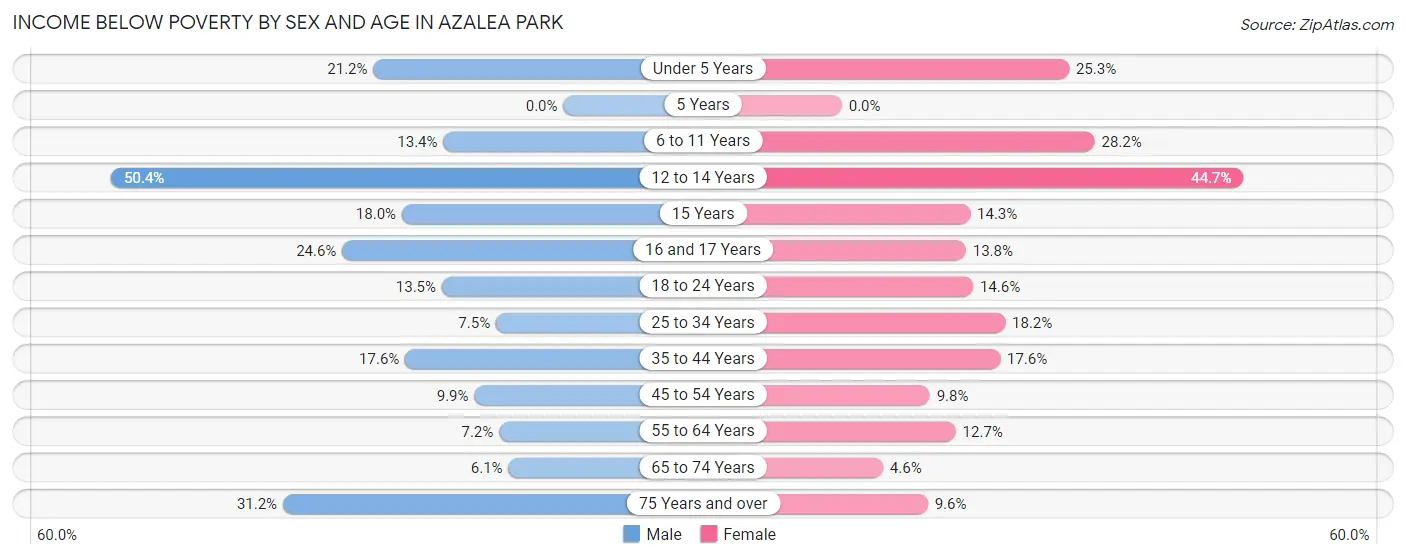
| Age Bracket | Male | Female |
| Under 5 Years | 95 (21.2%) | 85 (25.3%) |
| 5 Years | 0 (0.0%) | 0 (0.0%) |
| 6 to 11 Years | 80 (13.4%) | 143 (28.1%) |
| 12 to 14 Years | 131 (50.4%) | 127 (44.7%) |
| 15 Years | 16 (18.0%) | 29 (14.3%) |
| 16 and 17 Years | 50 (24.6%) | 25 (13.8%) |
| 18 to 24 Years | 100 (13.5%) | 78 (14.6%) |
| 25 to 34 Years | 145 (7.5%) | 245 (18.2%) |
| 35 to 44 Years | 207 (17.6%) | 179 (17.6%) |
| 45 to 54 Years | 96 (9.9%) | 84 (9.8%) |
| 55 to 64 Years | 55 (7.1%) | 141 (12.7%) |
| 65 to 74 Years | 35 (6.1%) | 27 (4.6%) |
| 75 Years and over | 94 (31.2%) | 78 (9.6%) |
| Total | 1,104 (13.5%) | 1,241 (15.9%) |
Income Above Poverty by Sex and Age in Azalea Park
According to the poverty statistics in Azalea Park, males aged 5 years and females aged 5 years are the age groups that are most secure financially, with 100.0% of males and 100.0% of females in these age groups living above the poverty line.
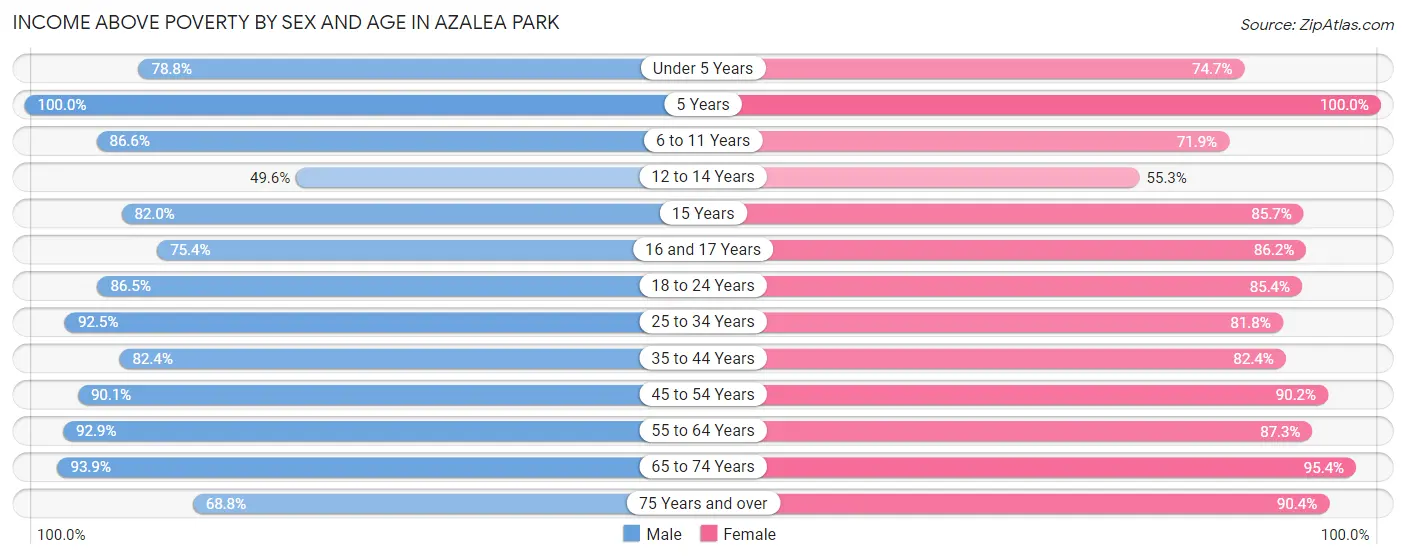
| Age Bracket | Male | Female |
| Under 5 Years | 354 (78.8%) | 251 (74.7%) |
| 5 Years | 132 (100.0%) | 9 (100.0%) |
| 6 to 11 Years | 519 (86.6%) | 365 (71.9%) |
| 12 to 14 Years | 129 (49.6%) | 157 (55.3%) |
| 15 Years | 73 (82.0%) | 174 (85.7%) |
| 16 and 17 Years | 153 (75.4%) | 156 (86.2%) |
| 18 to 24 Years | 639 (86.5%) | 456 (85.4%) |
| 25 to 34 Years | 1,788 (92.5%) | 1,102 (81.8%) |
| 35 to 44 Years | 968 (82.4%) | 837 (82.4%) |
| 45 to 54 Years | 873 (90.1%) | 774 (90.2%) |
| 55 to 64 Years | 714 (92.8%) | 971 (87.3%) |
| 65 to 74 Years | 537 (93.9%) | 563 (95.4%) |
| 75 Years and over | 207 (68.8%) | 737 (90.4%) |
| Total | 7,086 (86.5%) | 6,552 (84.1%) |
Income Below Poverty Among Married-Couple Families in Azalea Park
The poverty statistics for married-couple families in Azalea Park show that 7.8% or 173 of the total 2,211 families live below the poverty line. Families with 5 or more children have the highest poverty rate of 100.0%, comprising of 13 families. On the other hand, families with 3 or 4 children have the lowest poverty rate of 0.0%, which includes 0 families.
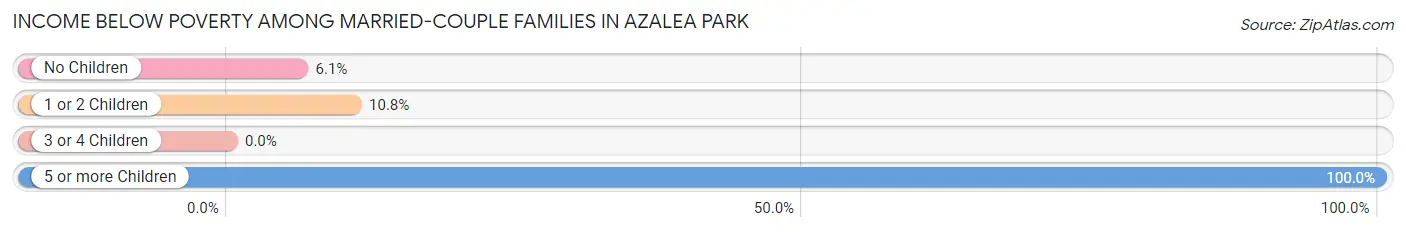
| Children | Above Poverty | Below Poverty |
| No Children | 1,283 (93.9%) | 84 (6.1%) |
| 1 or 2 Children | 628 (89.2%) | 76 (10.8%) |
| 3 or 4 Children | 127 (100.0%) | 0 (0.0%) |
| 5 or more Children | 0 (0.0%) | 13 (100.0%) |
| Total | 2,038 (92.2%) | 173 (7.8%) |
Income Below Poverty Among Single-Parent Households in Azalea Park
According to the poverty data in Azalea Park, 16.1% or 72 single-father households and 12.5% or 163 single-mother households are living below the poverty line. Among single-father households, those with 1 or 2 children have the highest poverty rate, with 49 households (24.0%) experiencing poverty. Likewise, among single-mother households, those with 3 or 4 children have the highest poverty rate, with 103 households (100.0%) falling below the poverty line.
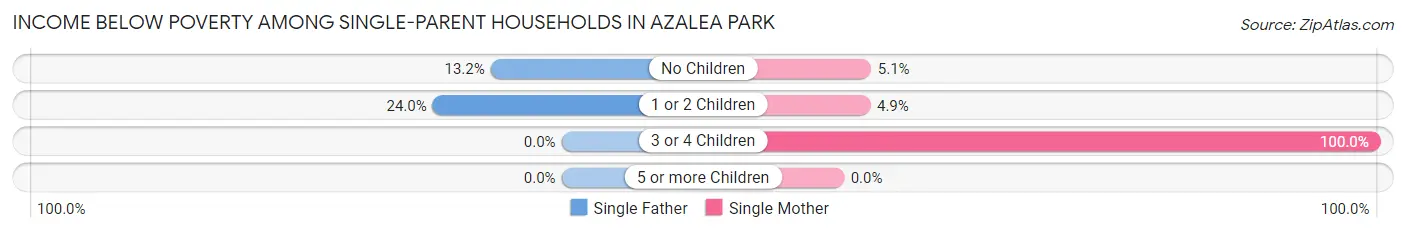
| Children | Single Father | Single Mother |
| No Children | 23 (13.2%) | 40 (5.1%) |
| 1 or 2 Children | 49 (24.0%) | 20 (4.9%) |
| 3 or 4 Children | 0 (0.0%) | 103 (100.0%) |
| 5 or more Children | 0 (0.0%) | 0 (0.0%) |
| Total | 72 (16.1%) | 163 (12.5%) |
Income Below Poverty Among Married-Couple vs Single-Parent Households in Azalea Park
The poverty data for Azalea Park shows that 173 of the married-couple family households (7.8%) and 235 of the single-parent households (13.5%) are living below the poverty level. Within the married-couple family households, those with 5 or more children have the highest poverty rate, with 13 households (100.0%) falling below the poverty line. Among the single-parent households, those with 3 or 4 children have the highest poverty rate, with 103 household (60.2%) living below poverty.
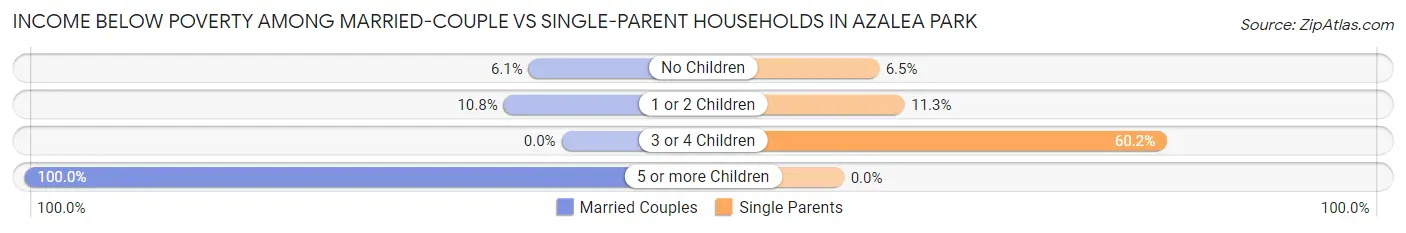
| Children | Married-Couple Families | Single-Parent Households |
| No Children | 84 (6.1%) | 63 (6.5%) |
| 1 or 2 Children | 76 (10.8%) | 69 (11.3%) |
| 3 or 4 Children | 0 (0.0%) | 103 (60.2%) |
| 5 or more Children | 13 (100.0%) | 0 (0.0%) |
| Total | 173 (7.8%) | 235 (13.5%) |
Race in Azalea Park
The most populous races in Azalea Park are Hispanic or Latino (11,175 | 69.7%), White / Caucasian (7,118 | 44.4%), and Two or more Races (3,901 | 24.3%).
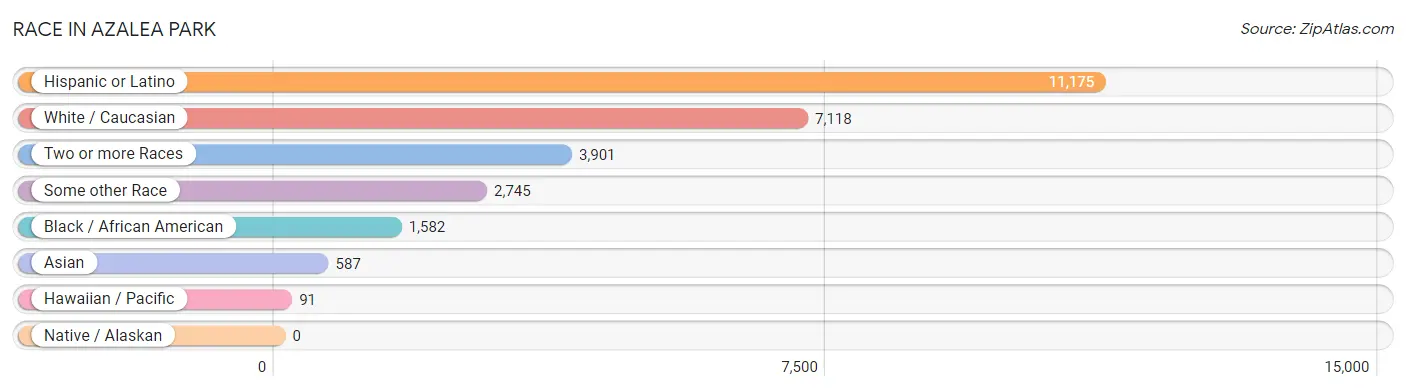
| Race | # Population | % Population |
| Asian | 587 | 3.7% |
| Black / African American | 1,582 | 9.9% |
| Hawaiian / Pacific | 91 | 0.6% |
| Hispanic or Latino | 11,175 | 69.7% |
| Native / Alaskan | 0 | 0.0% |
| White / Caucasian | 7,118 | 44.4% |
| Two or more Races | 3,901 | 24.3% |
| Some other Race | 2,745 | 17.1% |
| Total | 16,024 | 100.0% |
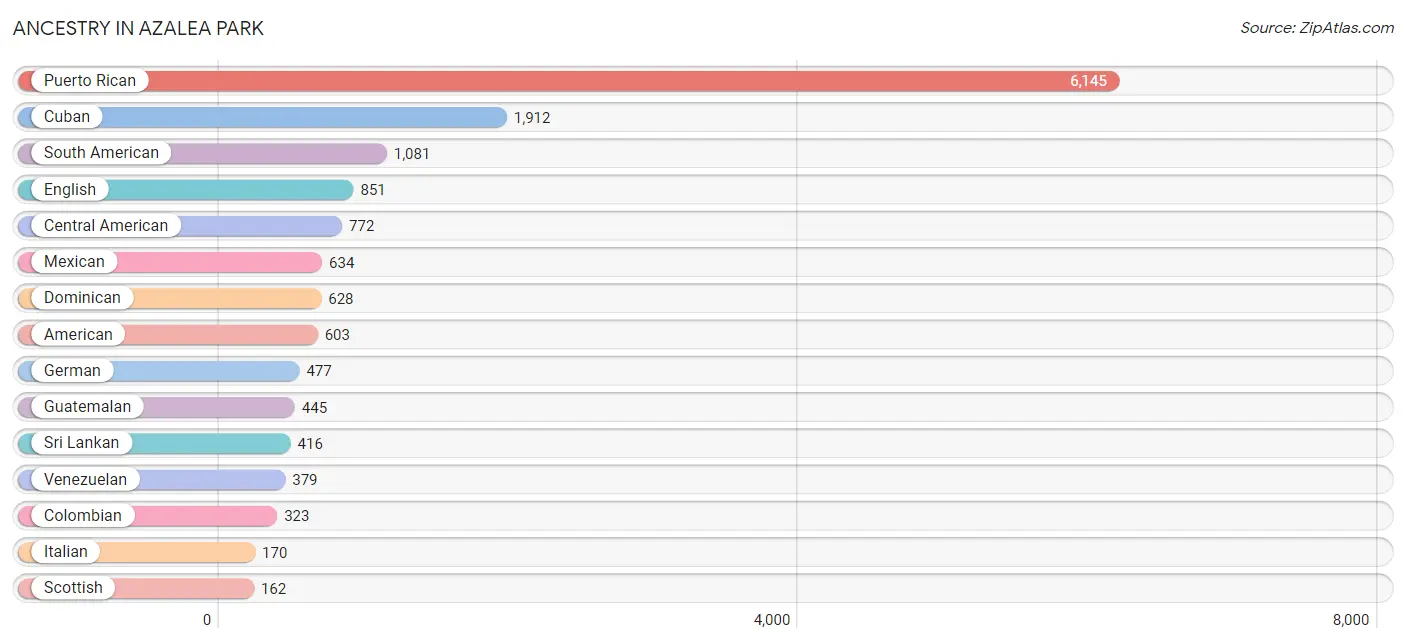
Ancestry in Azalea Park
The most populous ancestries reported in Azalea Park are Puerto Rican (6,145 | 38.4%), Cuban (1,912 | 11.9%), South American (1,081 | 6.8%), English (851 | 5.3%), and Central American (772 | 4.8%), together accounting for 67.2% of all Azalea Park residents.
| Ancestry | # Population | % Population |
| African | 39 | 0.2% |
| Albanian | 32 | 0.2% |
| American | 603 | 3.8% |
| Arab | 38 | 0.2% |
| Argentinean | 34 | 0.2% |
| Bolivian | 43 | 0.3% |
| Brazilian | 65 | 0.4% |
| British | 22 | 0.1% |
| Burmese | 33 | 0.2% |
| Central American | 772 | 4.8% |
| Central American Indian | 76 | 0.5% |
| Chilean | 134 | 0.8% |
| Colombian | 323 | 2.0% |
| Costa Rican | 9 | 0.1% |
| Cuban | 1,912 | 11.9% |
| Czech | 11 | 0.1% |
| Dominican | 628 | 3.9% |
| Dutch | 24 | 0.2% |
| Ecuadorian | 118 | 0.7% |
| English | 851 | 5.3% |
| European | 117 | 0.7% |
| French | 74 | 0.5% |
| German | 477 | 3.0% |
| Guamanian / Chamorro | 75 | 0.5% |
| Guatemalan | 445 | 2.8% |
| Guyanese | 45 | 0.3% |
| Haitian | 87 | 0.5% |
| Honduran | 146 | 0.9% |
| Hungarian | 18 | 0.1% |
| Indian (Asian) | 48 | 0.3% |
| Irish | 139 | 0.9% |
| Italian | 170 | 1.1% |
| Jamaican | 31 | 0.2% |
| Japanese | 48 | 0.3% |
| Korean | 101 | 0.6% |
| Malaysian | 27 | 0.2% |
| Mexican | 634 | 4.0% |
| Moroccan | 38 | 0.2% |
| Native Hawaiian | 16 | 0.1% |
| Nicaraguan | 25 | 0.2% |
| Nigerian | 28 | 0.2% |
| Norwegian | 8 | 0.1% |
| Pakistani | 31 | 0.2% |
| Peruvian | 50 | 0.3% |
| Polish | 93 | 0.6% |
| Portuguese | 42 | 0.3% |
| Puerto Rican | 6,145 | 38.4% |
| Russian | 22 | 0.1% |
| Salvadoran | 147 | 0.9% |
| Scotch-Irish | 21 | 0.1% |
| Scottish | 162 | 1.0% |
| Slovak | 23 | 0.1% |
| South American | 1,081 | 6.8% |
| Sri Lankan | 416 | 2.6% |
| Subsaharan African | 67 | 0.4% |
| Swedish | 18 | 0.1% |
| Swiss | 69 | 0.4% |
| Thai | 13 | 0.1% |
| Ukrainian | 9 | 0.1% |
| Venezuelan | 379 | 2.4% |
| Welsh | 27 | 0.2% | View All 61 Rows |
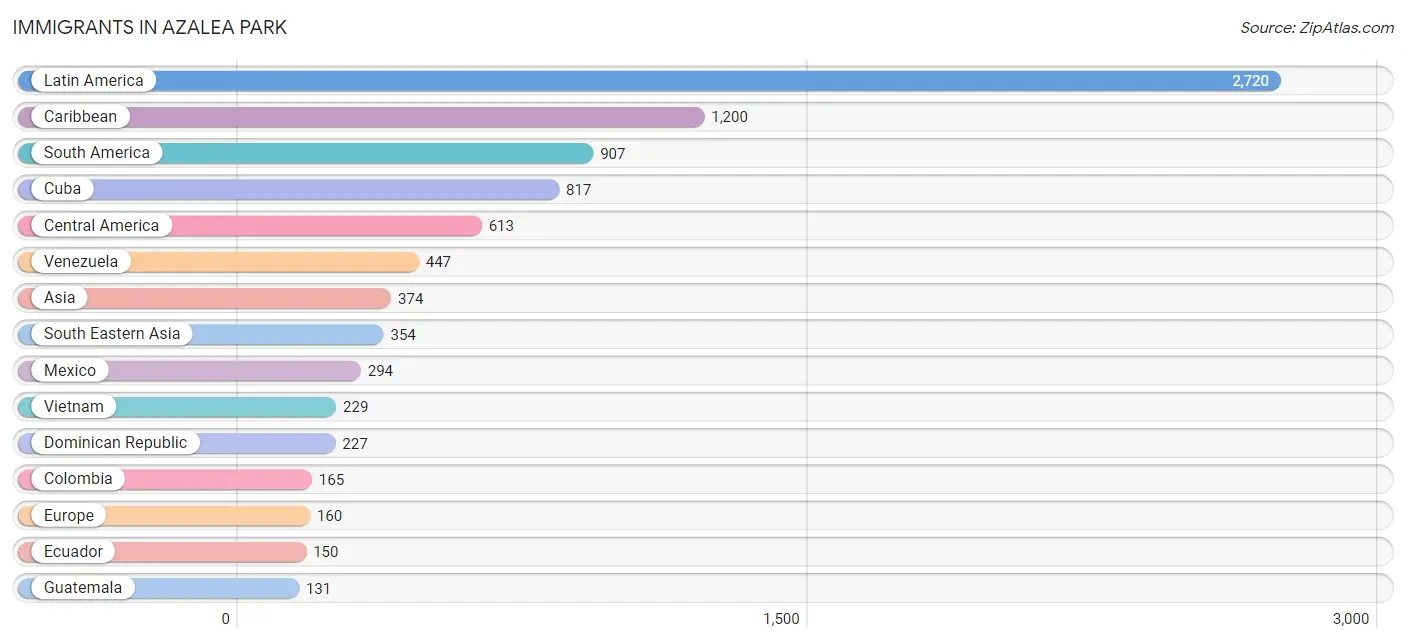
Immigrants in Azalea Park
The most numerous immigrant groups reported in Azalea Park came from Latin America (2,720 | 17.0%), Caribbean (1,200 | 7.5%), South America (907 | 5.7%), Cuba (817 | 5.1%), and Central America (613 | 3.8%), together accounting for 39.0% of all Azalea Park residents.
| Immigration Origin | # Population | % Population |
| Africa | 40 | 0.3% |
| Asia | 374 | 2.3% |
| Brazil | 51 | 0.3% |
| Cambodia | 18 | 0.1% |
| Canada | 40 | 0.3% |
| Caribbean | 1,200 | 7.5% |
| Central America | 613 | 3.8% |
| Chile | 44 | 0.3% |
| China | 10 | 0.1% |
| Colombia | 165 | 1.0% |
| Costa Rica | 72 | 0.4% |
| Cuba | 817 | 5.1% |
| Dominican Republic | 227 | 1.4% |
| Eastern Africa | 3 | 0.0% |
| Eastern Asia | 10 | 0.1% |
| Eastern Europe | 9 | 0.1% |
| Ecuador | 150 | 0.9% |
| El Salvador | 31 | 0.2% |
| England | 22 | 0.1% |
| Europe | 160 | 1.0% |
| Germany | 22 | 0.1% |
| Guatemala | 131 | 0.8% |
| Guyana | 25 | 0.2% |
| Haiti | 44 | 0.3% |
| Honduras | 60 | 0.4% |
| India | 7 | 0.0% |
| Italy | 21 | 0.1% |
| Jamaica | 41 | 0.3% |
| Laos | 15 | 0.1% |
| Latin America | 2,720 | 17.0% |
| Mexico | 294 | 1.8% |
| Morocco | 9 | 0.1% |
| Nicaragua | 25 | 0.2% |
| Nigeria | 28 | 0.2% |
| Northern Africa | 9 | 0.1% |
| Northern Europe | 47 | 0.3% |
| Pakistan | 3 | 0.0% |
| Peru | 25 | 0.2% |
| Philippines | 50 | 0.3% |
| Portugal | 16 | 0.1% |
| Singapore | 3 | 0.0% |
| South America | 907 | 5.7% |
| South Central Asia | 10 | 0.1% |
| South Eastern Asia | 354 | 2.2% |
| Southern Europe | 82 | 0.5% |
| Spain | 45 | 0.3% |
| Thailand | 39 | 0.2% |
| Trinidad and Tobago | 11 | 0.1% |
| Ukraine | 9 | 0.1% |
| Venezuela | 447 | 2.8% |
| Vietnam | 229 | 1.4% |
| West Indies | 42 | 0.3% |
| Western Africa | 28 | 0.2% |
| Western Europe | 22 | 0.1% | View All 54 Rows |
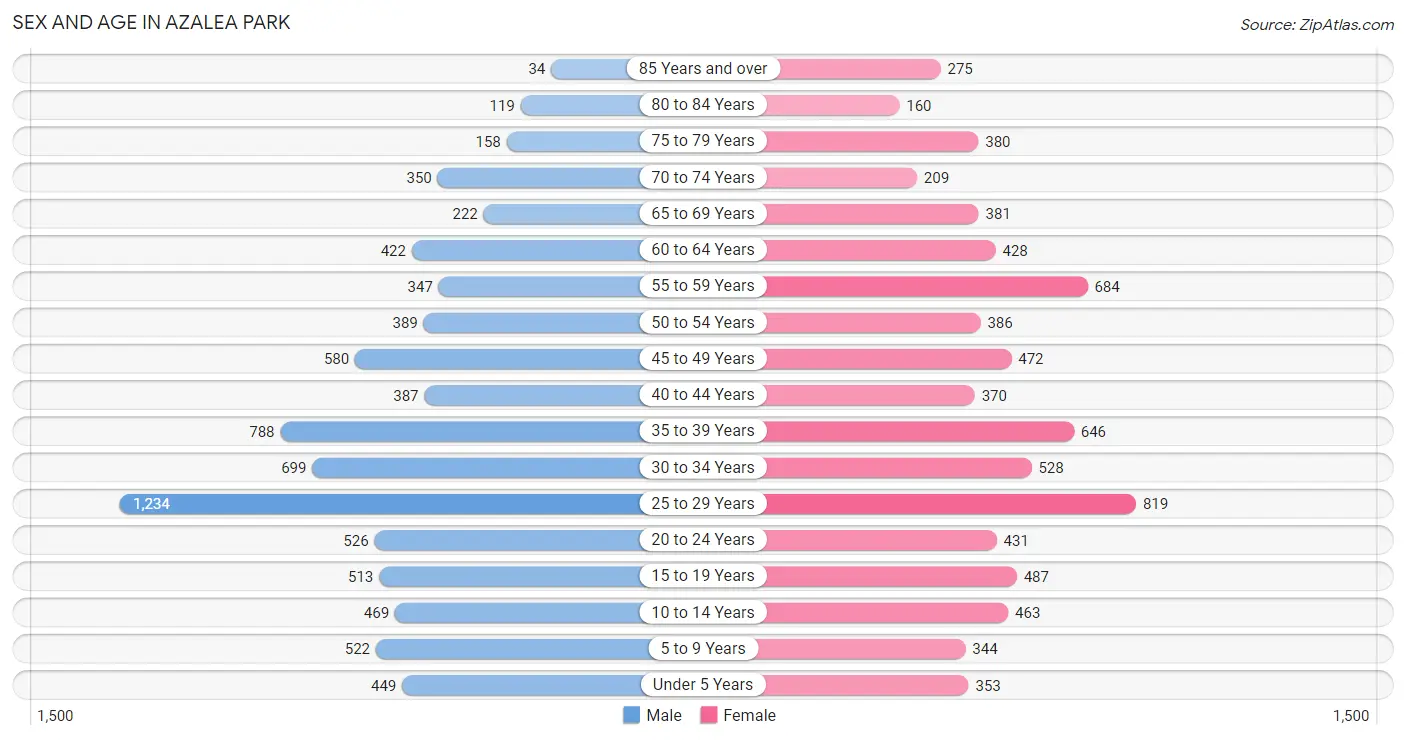
Sex and Age in Azalea Park
Sex and Age in Azalea Park
The most populous age groups in Azalea Park are 25 to 29 Years (1,234 | 15.0%) for men and 25 to 29 Years (819 | 10.5%) for women.
| Age Bracket | Male | Female |
| Under 5 Years | 449 (5.5%) | 353 (4.5%) |
| 5 to 9 Years | 522 (6.4%) | 344 (4.4%) |
| 10 to 14 Years | 469 (5.7%) | 463 (5.9%) |
| 15 to 19 Years | 513 (6.2%) | 487 (6.2%) |
| 20 to 24 Years | 526 (6.4%) | 431 (5.5%) |
| 25 to 29 Years | 1,234 (15.0%) | 819 (10.5%) |
| 30 to 34 Years | 699 (8.5%) | 528 (6.8%) |
| 35 to 39 Years | 788 (9.6%) | 646 (8.3%) |
| 40 to 44 Years | 387 (4.7%) | 370 (4.7%) |
| 45 to 49 Years | 580 (7.1%) | 472 (6.0%) |
| 50 to 54 Years | 389 (4.7%) | 386 (4.9%) |
| 55 to 59 Years | 347 (4.2%) | 684 (8.7%) |
| 60 to 64 Years | 422 (5.1%) | 428 (5.5%) |
| 65 to 69 Years | 222 (2.7%) | 381 (4.9%) |
| 70 to 74 Years | 350 (4.3%) | 209 (2.7%) |
| 75 to 79 Years | 158 (1.9%) | 380 (4.9%) |
| 80 to 84 Years | 119 (1.5%) | 160 (2.1%) |
| 85 Years and over | 34 (0.4%) | 275 (3.5%) |
| Total | 8,208 (100.0%) | 7,816 (100.0%) |
Families and Households in Azalea Park
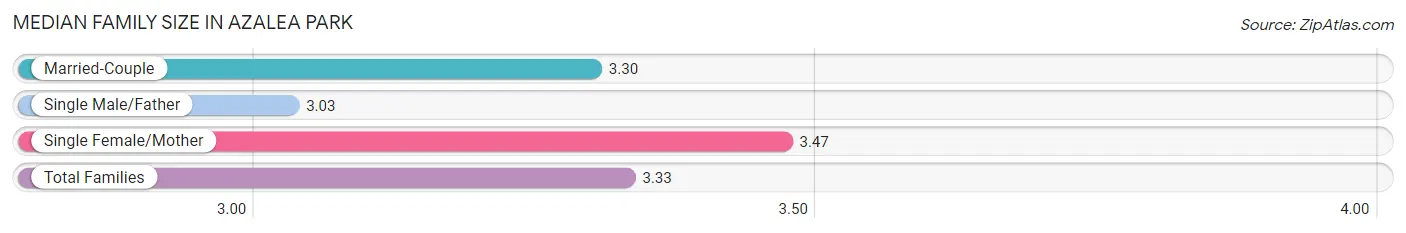
Median Family Size in Azalea Park
The median family size in Azalea Park is 3.33 persons per family, with single female/mother families (1,301 | 32.9%) accounting for the largest median family size of 3.47 persons per family. On the other hand, single male/father families (446 | 11.3%) represent the smallest median family size with 3.03 persons per family.
| Family Type | # Families | Family Size |
| Married-Couple | 2,211 (55.9%) | 3.30 |
| Single Male/Father | 446 (11.3%) | 3.03 |
| Single Female/Mother | 1,301 (32.9%) | 3.47 |
| Total Families | 3,958 (100.0%) | 3.33 |
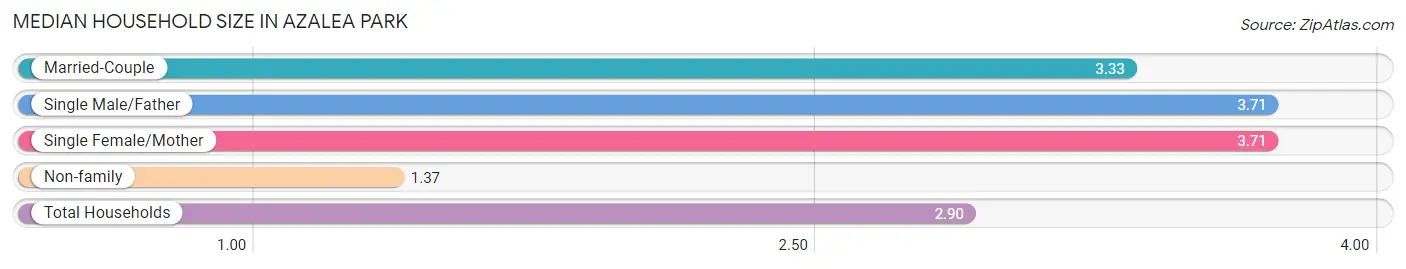
Median Household Size in Azalea Park
The median household size in Azalea Park is 2.90 persons per household, with single male/father households (446 | 8.1%) accounting for the largest median household size of 3.71 persons per household. non-family households (1,563 | 28.3%) represent the smallest median household size with 1.37 persons per household.
| Household Type | # Households | Household Size |
| Married-Couple | 2,211 (40.1%) | 3.33 |
| Single Male/Father | 446 (8.1%) | 3.71 |
| Single Female/Mother | 1,301 (23.6%) | 3.71 |
| Non-family | 1,563 (28.3%) | 1.37 |
| Total Households | 5,521 (100.0%) | 2.90 |
Household Size by Marriage Status in Azalea Park
Out of a total of 5,521 households in Azalea Park, 3,958 (71.7%) are family households, while 1,563 (28.3%) are nonfamily households. The most numerous type of family households are 2-person households, comprising 1,641, and the most common type of nonfamily households are 1-person households, comprising 1,185.
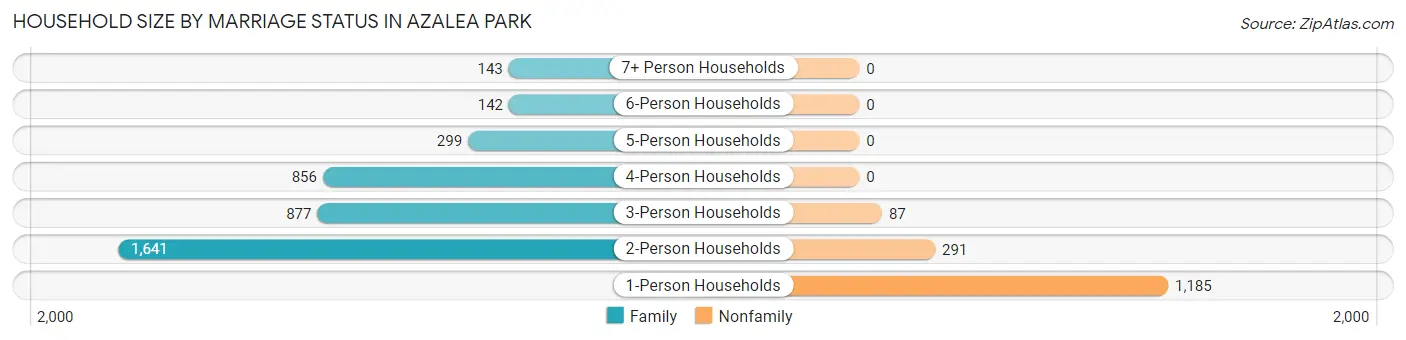
| Household Size | Family Households | Nonfamily Households |
| 1-Person Households | - | 1,185 (21.5%) |
| 2-Person Households | 1,641 (29.7%) | 291 (5.3%) |
| 3-Person Households | 877 (15.9%) | 87 (1.6%) |
| 4-Person Households | 856 (15.5%) | 0 (0.0%) |
| 5-Person Households | 299 (5.4%) | 0 (0.0%) |
| 6-Person Households | 142 (2.6%) | 0 (0.0%) |
| 7+ Person Households | 143 (2.6%) | 0 (0.0%) |
| Total | 3,958 (71.7%) | 1,563 (28.3%) |
Female Fertility in Azalea Park
Fertility by Age in Azalea Park
Average fertility rate in Azalea Park is 59.0 births per 1,000 women. Women in the age bracket of 20 to 34 years have the highest fertility rate with 125.0 births per 1,000 women. Women in the age bracket of 20 to 34 years acount for 100.0% of all women with births.
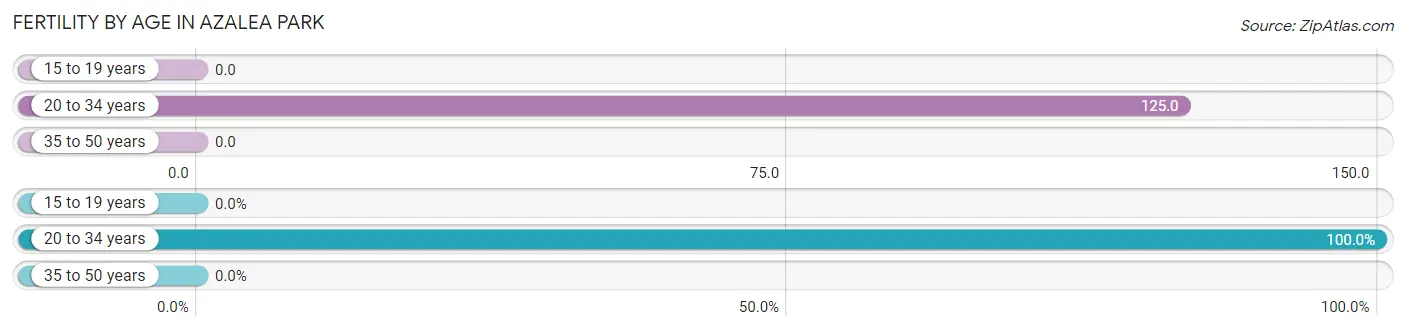
| Age Bracket | Women with Births | Births / 1,000 Women |
| 15 to 19 years | 0 (0.0%) | 0.0 |
| 20 to 34 years | 223 (100.0%) | 125.0 |
| 35 to 50 years | 0 (0.0%) | 0.0 |
| Total | 223 (100.0%) | 59.0 |
Fertility by Age by Marriage Status in Azalea Park
58.3% of women with births (223) in Azalea Park are married. The highest percentage of unmarried women with births falls into 20 to 34 years age bracket with 41.7% of them unmarried at the time of birth, while the lowest percentage of unmarried women with births belong to 20 to 34 years age bracket with 41.7% of them unmarried.
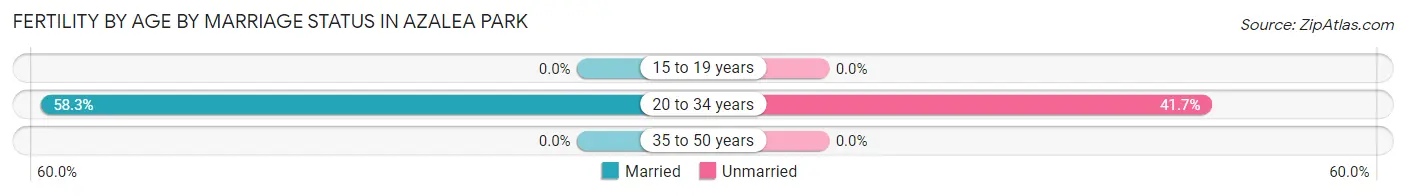
| Age Bracket | Married | Unmarried |
| 15 to 19 years | 0 (0.0%) | 0 (0.0%) |
| 20 to 34 years | 130 (58.3%) | 93 (41.7%) |
| 35 to 50 years | 0 (0.0%) | 0 (0.0%) |
| Total | 130 (58.3%) | 93 (41.7%) |
Fertility by Education in Azalea Park
Average fertility rate in Azalea Park is 59.0 births per 1,000 women. Women with the education attainment of bachelor's degree have the highest fertility rate of 169.0 births per 1,000 women, while women with the education attainment of college or associate's degree have the lowest fertility at 16.0 births per 1,000 women. Women with the education attainment of bachelor's degree represent 45.3% of all women with births.
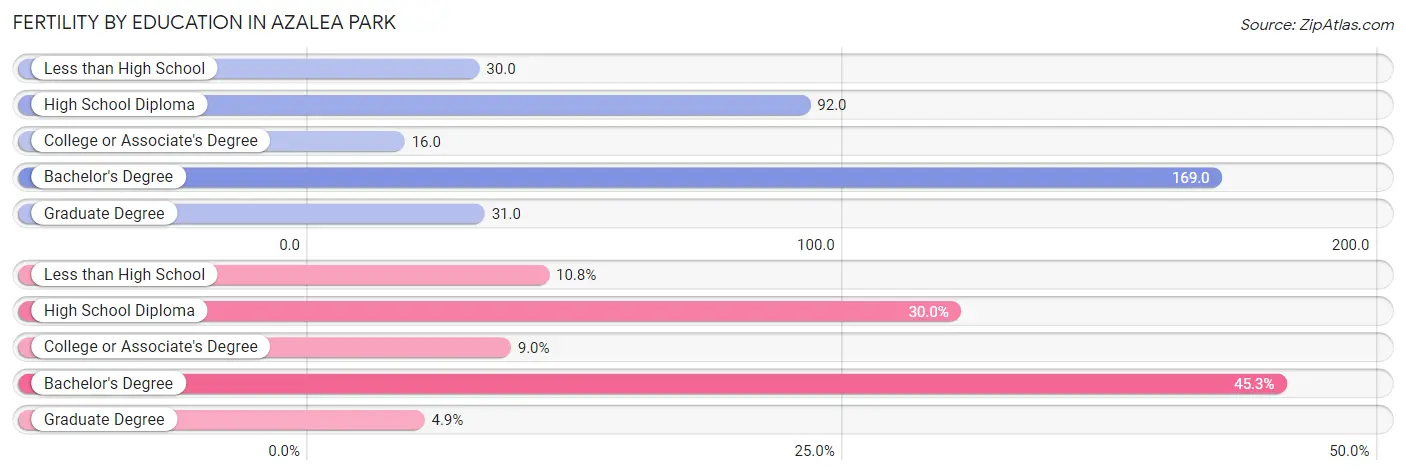
| Educational Attainment | Women with Births | Births / 1,000 Women |
| Less than High School | 24 (10.8%) | 30.0 |
| High School Diploma | 67 (30.0%) | 92.0 |
| College or Associate's Degree | 20 (9.0%) | 16.0 |
| Bachelor's Degree | 101 (45.3%) | 169.0 |
| Graduate Degree | 11 (4.9%) | 31.0 |
| Total | 223 (100.0%) | 59.0 |
Fertility by Education by Marriage Status in Azalea Park
41.7% of women with births in Azalea Park are unmarried. Women with the educational attainment of college or associate's degree are most likely to be married with 100.0% of them married at childbirth, while women with the educational attainment of less than high school are least likely to be married with 100.0% of them unmarried at childbirth.
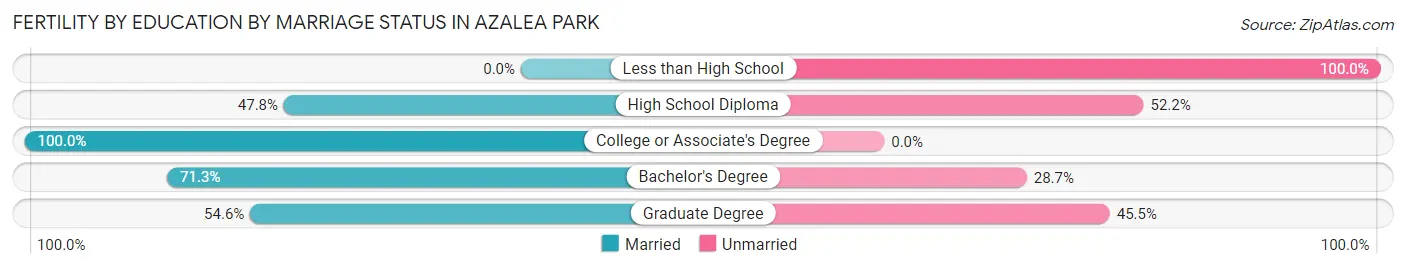
| Educational Attainment | Married | Unmarried |
| Less than High School | 0 (0.0%) | 24 (100.0%) |
| High School Diploma | 32 (47.8%) | 35 (52.2%) |
| College or Associate's Degree | 20 (100.0%) | 0 (0.0%) |
| Bachelor's Degree | 72 (71.3%) | 29 (28.7%) |
| Graduate Degree | 6 (54.5%) | 5 (45.5%) |
| Total | 130 (58.3%) | 93 (41.7%) |
Employment Characteristics in Azalea Park
Employment by Class of Employer in Azalea Park
Among the 8,050 employed individuals in Azalea Park, private company employees (5,991 | 74.4%), local government employees (475 | 5.9%), and not-for-profit organizations (470 | 5.8%) make up the most common classes of employment.
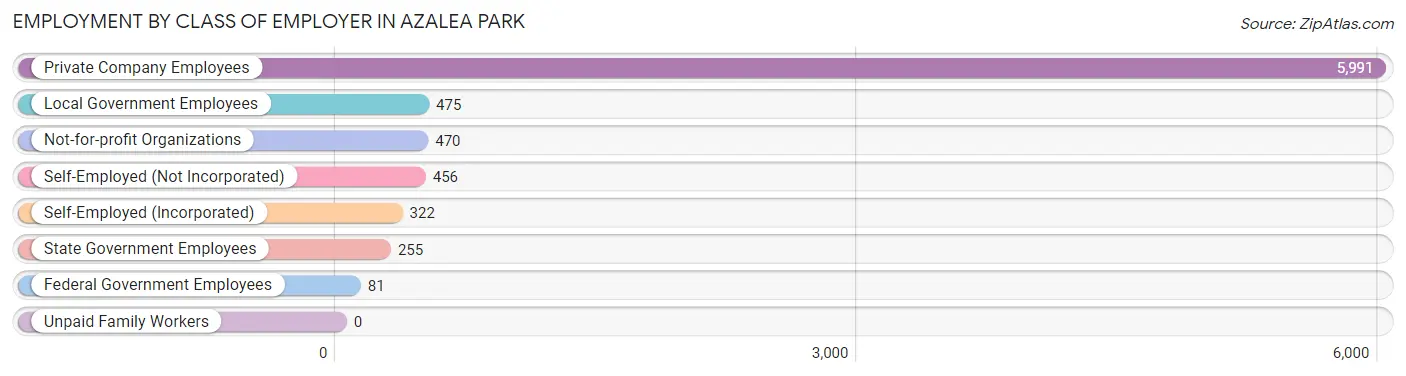
| Employer Class | # Employees | % Employees |
| Private Company Employees | 5,991 | 74.4% |
| Self-Employed (Incorporated) | 322 | 4.0% |
| Self-Employed (Not Incorporated) | 456 | 5.7% |
| Not-for-profit Organizations | 470 | 5.8% |
| Local Government Employees | 475 | 5.9% |
| State Government Employees | 255 | 3.2% |
| Federal Government Employees | 81 | 1.0% |
| Unpaid Family Workers | 0 | 0.0% |
| Total | 8,050 | 100.0% |
Employment Status by Age in Azalea Park
According to the labor force statistics for Azalea Park, out of the total population over 16 years of age (13,132), 66.9% or 8,785 individuals are in the labor force, with 6.7% or 589 of them unemployed. The age group with the highest labor force participation rate is 30 to 34 years, with 89.8% or 1,102 individuals in the labor force. Within the labor force, the 16 to 19 years age range has the highest percentage of unemployed individuals, with 38.3% or 118 of them being unemployed.
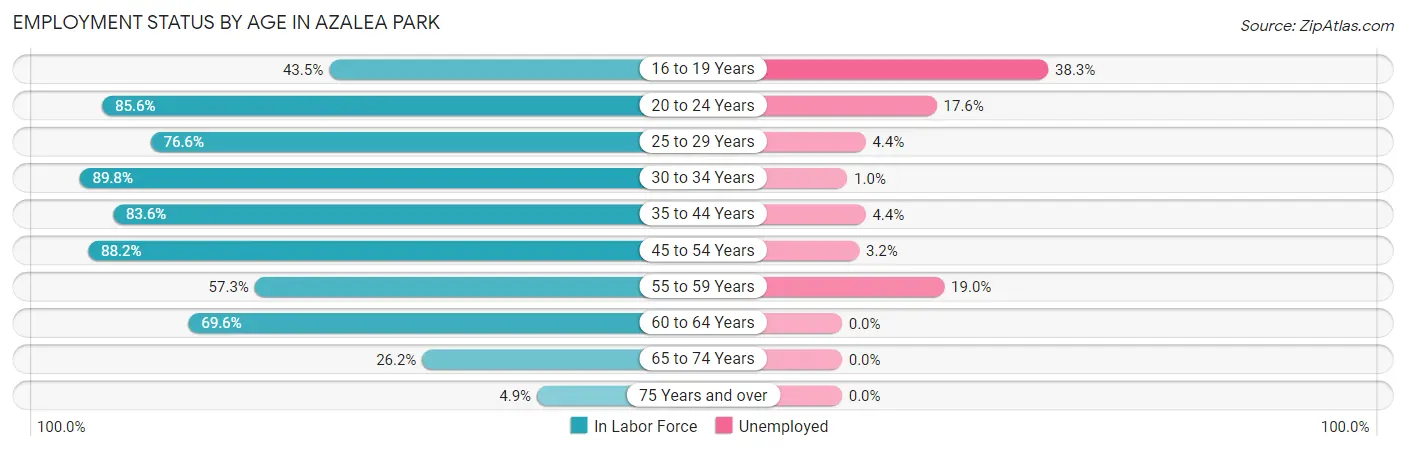
| Age Bracket | In Labor Force | Unemployed |
| 16 to 19 Years | 308 (43.5%) | 118 (38.3%) |
| 20 to 24 Years | 819 (85.6%) | 144 (17.6%) |
| 25 to 29 Years | 1,573 (76.6%) | 69 (4.4%) |
| 30 to 34 Years | 1,102 (89.8%) | 11 (1.0%) |
| 35 to 44 Years | 1,832 (83.6%) | 81 (4.4%) |
| 45 to 54 Years | 1,611 (88.2%) | 52 (3.2%) |
| 55 to 59 Years | 591 (57.3%) | 112 (19.0%) |
| 60 to 64 Years | 592 (69.6%) | 0 (0.0%) |
| 65 to 74 Years | 304 (26.2%) | 0 (0.0%) |
| 75 Years and over | 55 (4.9%) | 0 (0.0%) |
| Total | 8,785 (66.9%) | 589 (6.7%) |
Employment Status by Educational Attainment in Azalea Park
According to labor force statistics for Azalea Park, 79.5% of individuals (7,297) out of the total population between 25 and 64 years of age (9,179) are in the labor force, with 4.4% or 321 of them being unemployed. The group with the highest labor force participation rate are those with the educational attainment of bachelor's degree or higher, with 86.0% or 1,857 individuals in the labor force. Within the labor force, individuals with bachelor's degree or higher education have the highest percentage of unemployment, with 5.2% or 97 of them being unemployed.
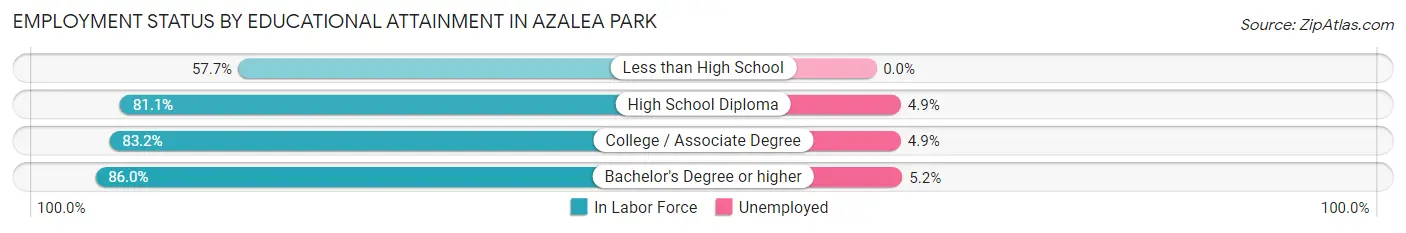
| Educational Attainment | In Labor Force | Unemployed |
| Less than High School | 767 (57.7%) | 0 (0.0%) |
| High School Diploma | 2,341 (81.1%) | 141 (4.9%) |
| College / Associate Degree | 2,333 (83.2%) | 137 (4.9%) |
| Bachelor's Degree or higher | 1,857 (86.0%) | 112 (5.2%) |
| Total | 7,297 (79.5%) | 404 (4.4%) |
Employment Occupations by Sex in Azalea Park
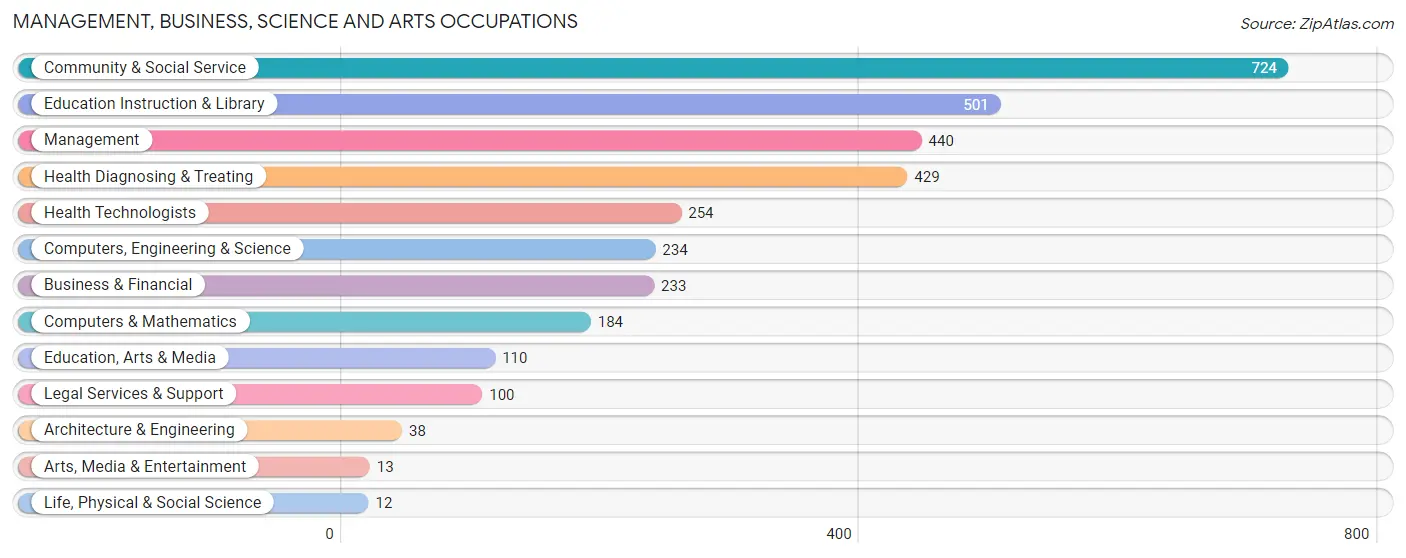
Management, Business, Science and Arts Occupations
The most common Management, Business, Science and Arts occupations in Azalea Park are Community & Social Service (724 | 8.8%), Education Instruction & Library (501 | 6.1%), Management (440 | 5.4%), Health Diagnosing & Treating (429 | 5.2%), and Health Technologists (254 | 3.1%).
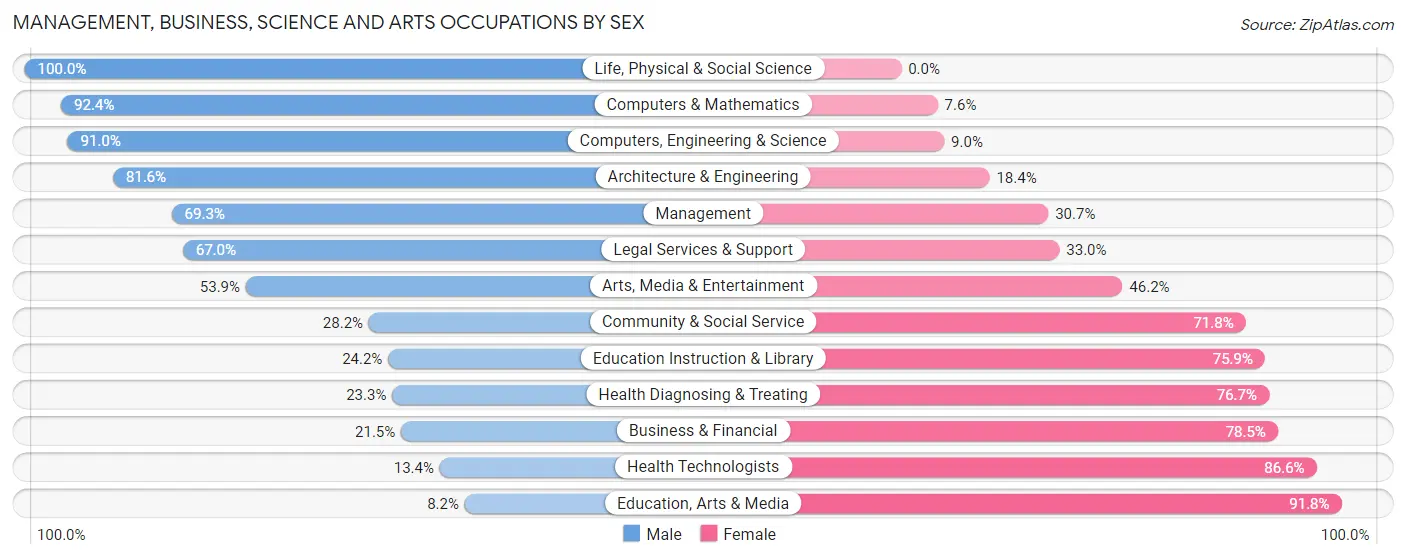
Management, Business, Science and Arts Occupations by Sex
Within the Management, Business, Science and Arts occupations in Azalea Park, the most male-oriented occupations are Life, Physical & Social Science (100.0%), Computers & Mathematics (92.4%), and Computers, Engineering & Science (91.0%), while the most female-oriented occupations are Education, Arts & Media (91.8%), Health Technologists (86.6%), and Business & Financial (78.5%).
| Occupation | Male | Female |
| Management | 305 (69.3%) | 135 (30.7%) |
| Business & Financial | 50 (21.5%) | 183 (78.5%) |
| Computers, Engineering & Science | 213 (91.0%) | 21 (9.0%) |
| Computers & Mathematics | 170 (92.4%) | 14 (7.6%) |
| Architecture & Engineering | 31 (81.6%) | 7 (18.4%) |
| Life, Physical & Social Science | 12 (100.0%) | 0 (0.0%) |
| Community & Social Service | 204 (28.2%) | 520 (71.8%) |
| Education, Arts & Media | 9 (8.2%) | 101 (91.8%) |
| Legal Services & Support | 67 (67.0%) | 33 (33.0%) |
| Education Instruction & Library | 121 (24.1%) | 380 (75.8%) |
| Arts, Media & Entertainment | 7 (53.8%) | 6 (46.2%) |
| Health Diagnosing & Treating | 100 (23.3%) | 329 (76.7%) |
| Health Technologists | 34 (13.4%) | 220 (86.6%) |
| Total (Category) | 872 (42.3%) | 1,188 (57.7%) |
| Total (Overall) | 4,649 (56.8%) | 3,533 (43.2%) |
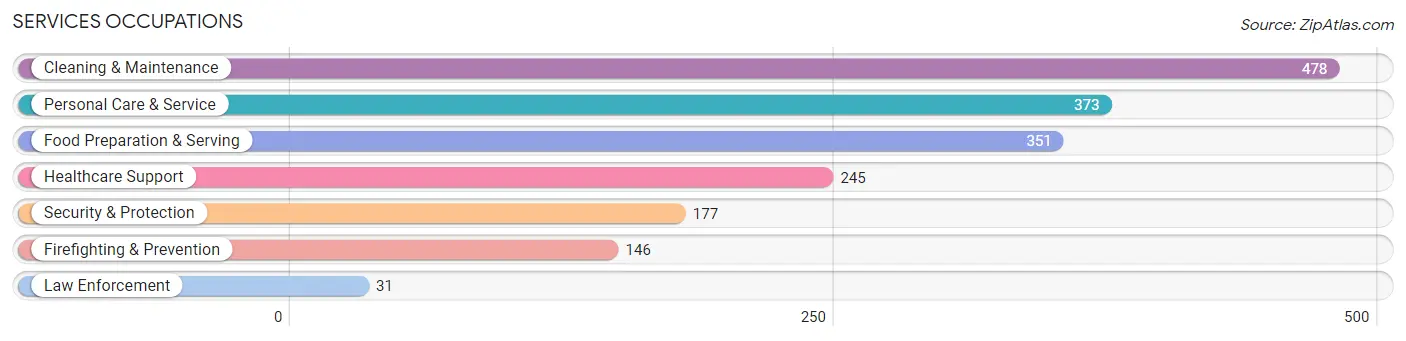
Services Occupations
The most common Services occupations in Azalea Park are Cleaning & Maintenance (478 | 5.8%), Personal Care & Service (373 | 4.6%), Food Preparation & Serving (351 | 4.3%), Healthcare Support (245 | 3.0%), and Security & Protection (177 | 2.2%).
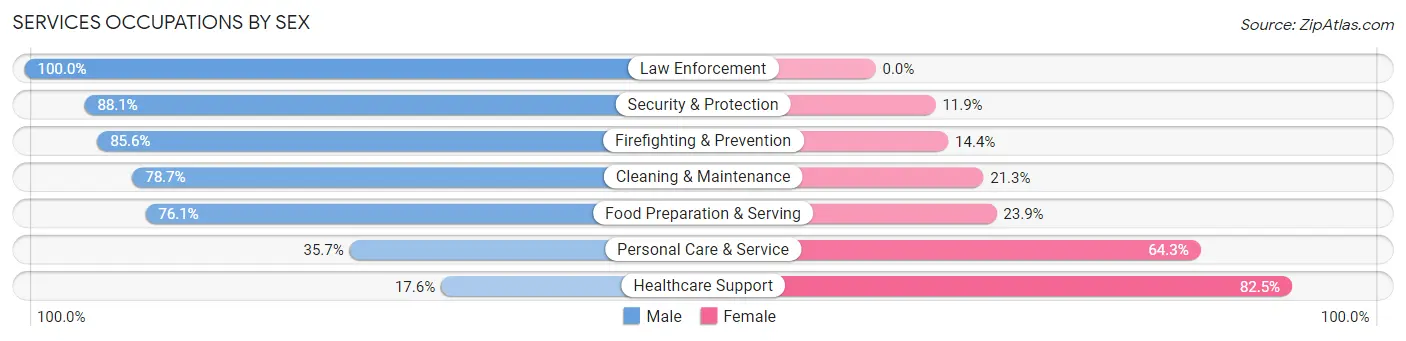
Services Occupations by Sex
Within the Services occupations in Azalea Park, the most male-oriented occupations are Law Enforcement (100.0%), Security & Protection (88.1%), and Firefighting & Prevention (85.6%), while the most female-oriented occupations are Healthcare Support (82.5%), Personal Care & Service (64.3%), and Food Preparation & Serving (23.9%).
| Occupation | Male | Female |
| Healthcare Support | 43 (17.5%) | 202 (82.5%) |
| Security & Protection | 156 (88.1%) | 21 (11.9%) |
| Firefighting & Prevention | 125 (85.6%) | 21 (14.4%) |
| Law Enforcement | 31 (100.0%) | 0 (0.0%) |
| Food Preparation & Serving | 267 (76.1%) | 84 (23.9%) |
| Cleaning & Maintenance | 376 (78.7%) | 102 (21.3%) |
| Personal Care & Service | 133 (35.7%) | 240 (64.3%) |
| Total (Category) | 975 (60.0%) | 649 (40.0%) |
| Total (Overall) | 4,649 (56.8%) | 3,533 (43.2%) |
Sales and Office Occupations
The most common Sales and Office occupations in Azalea Park are Office & Administration (1,515 | 18.5%), and Sales & Related (627 | 7.7%).
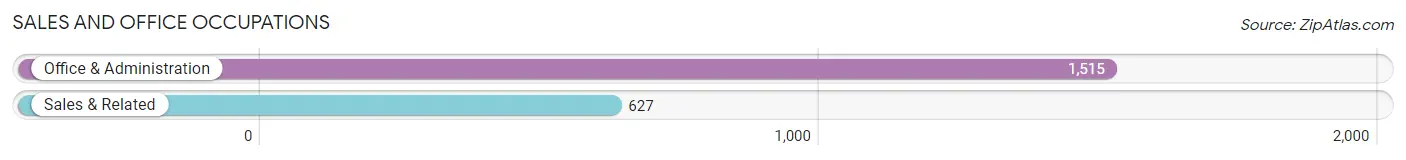
Sales and Office Occupations by Sex
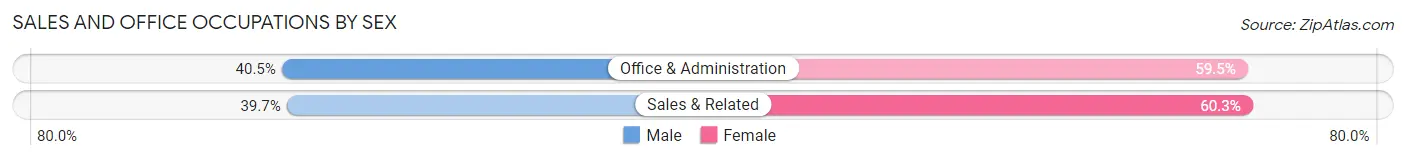
| Occupation | Male | Female |
| Sales & Related | 249 (39.7%) | 378 (60.3%) |
| Office & Administration | 613 (40.5%) | 902 (59.5%) |
| Total (Category) | 862 (40.2%) | 1,280 (59.8%) |
| Total (Overall) | 4,649 (56.8%) | 3,533 (43.2%) |
Natural Resources, Construction and Maintenance Occupations
The most common Natural Resources, Construction and Maintenance occupations in Azalea Park are Construction & Extraction (626 | 7.6%), and Installation, Maintenance & Repair (278 | 3.4%).
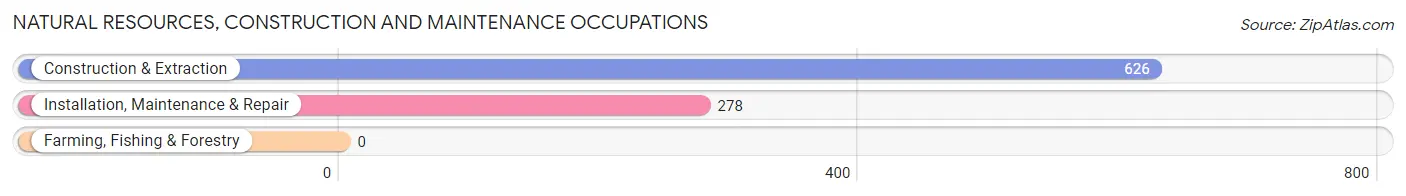
Natural Resources, Construction and Maintenance Occupations by Sex
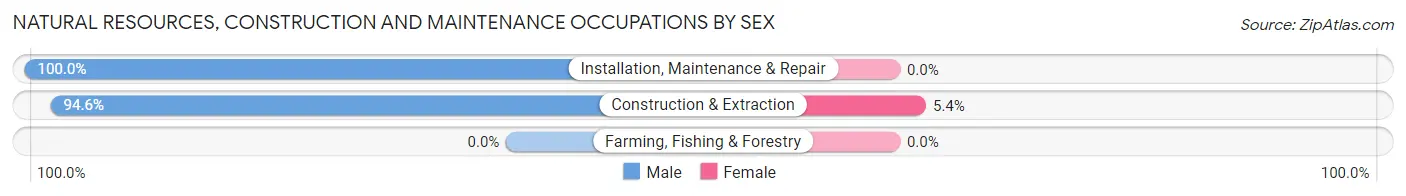
| Occupation | Male | Female |
| Farming, Fishing & Forestry | 0 (0.0%) | 0 (0.0%) |
| Construction & Extraction | 592 (94.6%) | 34 (5.4%) |
| Installation, Maintenance & Repair | 278 (100.0%) | 0 (0.0%) |
| Total (Category) | 870 (96.2%) | 34 (3.8%) |
| Total (Overall) | 4,649 (56.8%) | 3,533 (43.2%) |
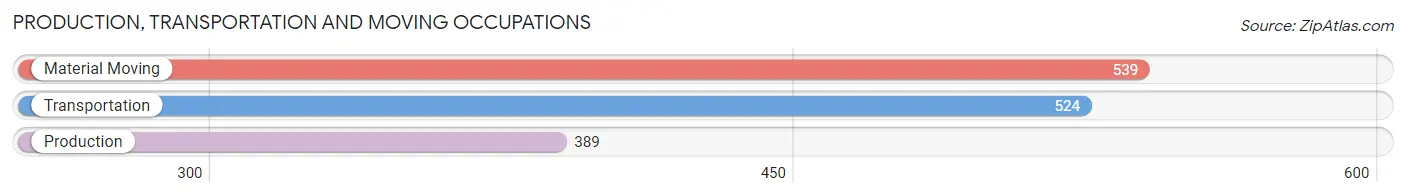
Production, Transportation and Moving Occupations
The most common Production, Transportation and Moving occupations in Azalea Park are Material Moving (539 | 6.6%), Transportation (524 | 6.4%), and Production (389 | 4.8%).
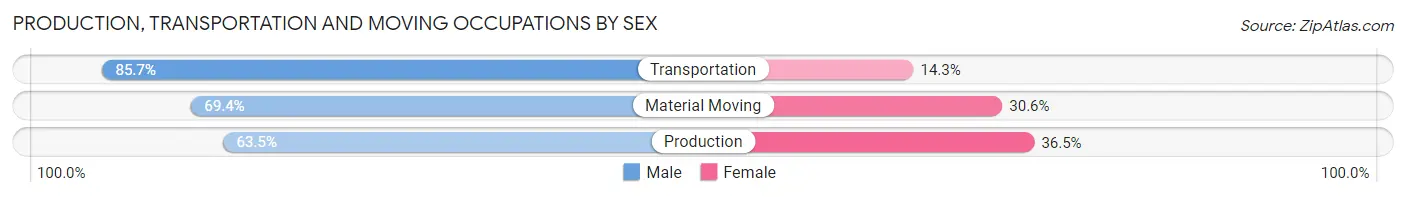
Production, Transportation and Moving Occupations by Sex
| Occupation | Male | Female |
| Production | 247 (63.5%) | 142 (36.5%) |
| Transportation | 449 (85.7%) | 75 (14.3%) |
| Material Moving | 374 (69.4%) | 165 (30.6%) |
| Total (Category) | 1,070 (73.7%) | 382 (26.3%) |
| Total (Overall) | 4,649 (56.8%) | 3,533 (43.2%) |
Employment Industries by Sex in Azalea Park
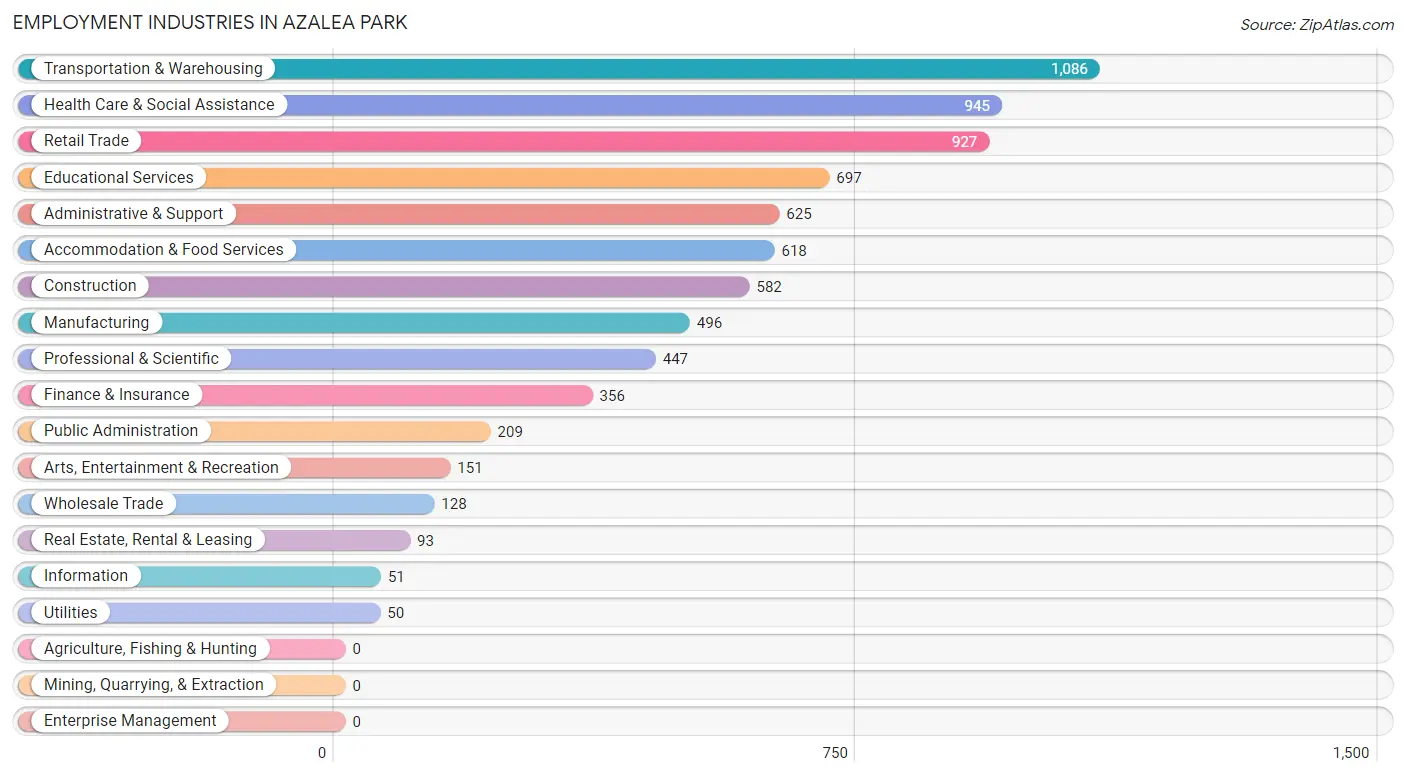
Employment Industries in Azalea Park
The major employment industries in Azalea Park include Transportation & Warehousing (1,086 | 13.3%), Health Care & Social Assistance (945 | 11.6%), Retail Trade (927 | 11.3%), Educational Services (697 | 8.5%), and Administrative & Support (625 | 7.6%).
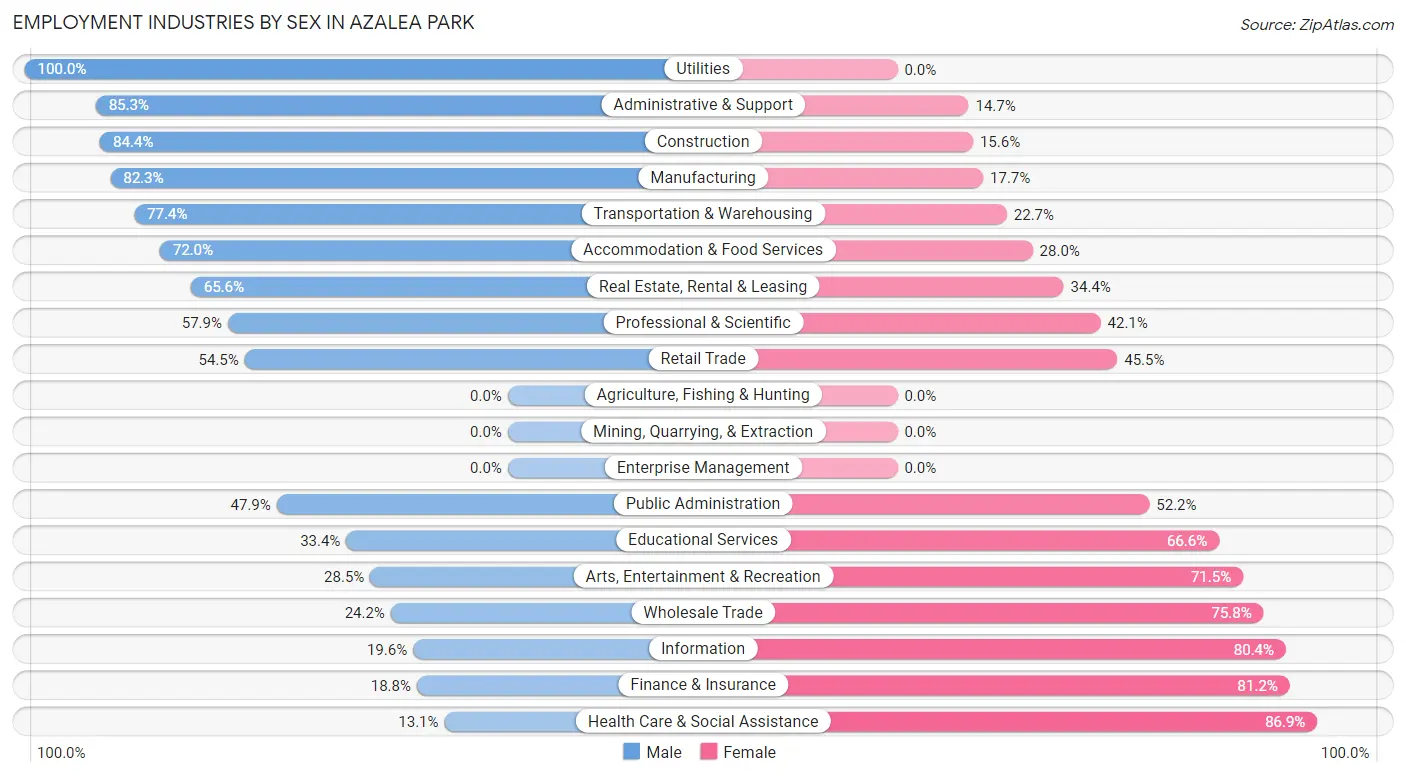
Employment Industries by Sex in Azalea Park
The Azalea Park industries that see more men than women are Utilities (100.0%), Administrative & Support (85.3%), and Construction (84.4%), whereas the industries that tend to have a higher number of women are Health Care & Social Assistance (86.9%), Finance & Insurance (81.2%), and Information (80.4%).
| Industry | Male | Female |
| Agriculture, Fishing & Hunting | 0 (0.0%) | 0 (0.0%) |
| Mining, Quarrying, & Extraction | 0 (0.0%) | 0 (0.0%) |
| Construction | 491 (84.4%) | 91 (15.6%) |
| Manufacturing | 408 (82.3%) | 88 (17.7%) |
| Wholesale Trade | 31 (24.2%) | 97 (75.8%) |
| Retail Trade | 505 (54.5%) | 422 (45.5%) |
| Transportation & Warehousing | 840 (77.3%) | 246 (22.7%) |
| Utilities | 50 (100.0%) | 0 (0.0%) |
| Information | 10 (19.6%) | 41 (80.4%) |
| Finance & Insurance | 67 (18.8%) | 289 (81.2%) |
| Real Estate, Rental & Leasing | 61 (65.6%) | 32 (34.4%) |
| Professional & Scientific | 259 (57.9%) | 188 (42.1%) |
| Enterprise Management | 0 (0.0%) | 0 (0.0%) |
| Administrative & Support | 533 (85.3%) | 92 (14.7%) |
| Educational Services | 233 (33.4%) | 464 (66.6%) |
| Health Care & Social Assistance | 124 (13.1%) | 821 (86.9%) |
| Arts, Entertainment & Recreation | 43 (28.5%) | 108 (71.5%) |
| Accommodation & Food Services | 445 (72.0%) | 173 (28.0%) |
| Public Administration | 100 (47.8%) | 109 (52.1%) |
| Total | 4,649 (56.8%) | 3,533 (43.2%) |
Education in Azalea Park
School Enrollment in Azalea Park
The most common levels of schooling among the 3,414 students in Azalea Park are elementary school (862 | 25.3%), high school (794 | 23.3%), and middle school (678 | 19.9%).
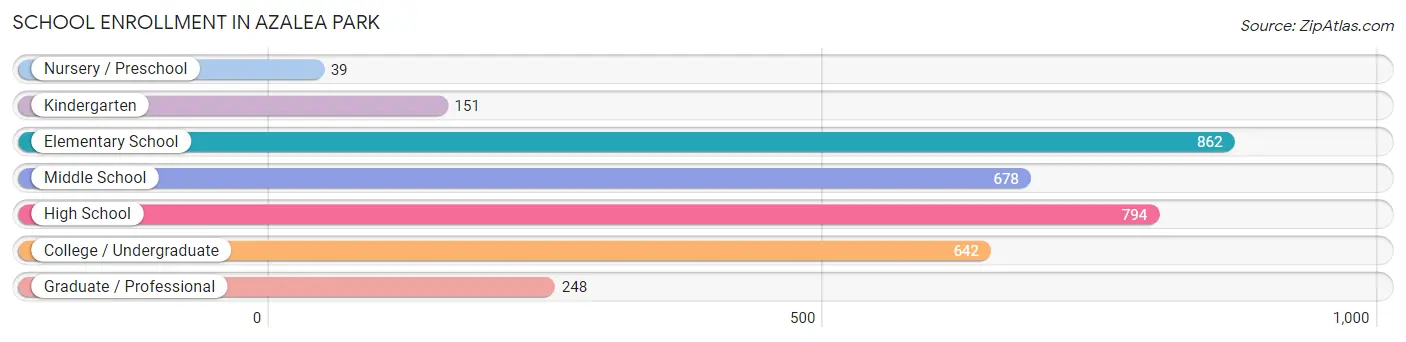
| School Level | # Students | % Students |
| Nursery / Preschool | 39 | 1.1% |
| Kindergarten | 151 | 4.4% |
| Elementary School | 862 | 25.3% |
| Middle School | 678 | 19.9% |
| High School | 794 | 23.3% |
| College / Undergraduate | 642 | 18.8% |
| Graduate / Professional | 248 | 7.3% |
| Total | 3,414 | 100.0% |
School Enrollment by Age by Funding Source in Azalea Park
Out of a total of 3,414 students who are enrolled in schools in Azalea Park, 536 (15.7%) attend a private institution, while the remaining 2,878 (84.3%) are enrolled in public schools. The age group of 18 to 19 year olds has the highest likelihood of being enrolled in private schools, with 61 (33.5% in the age bracket) enrolled. Conversely, the age group of 3 to 4 year olds has the lowest likelihood of being enrolled in a private school, with 6 (100.0% in the age bracket) attending a public institution.
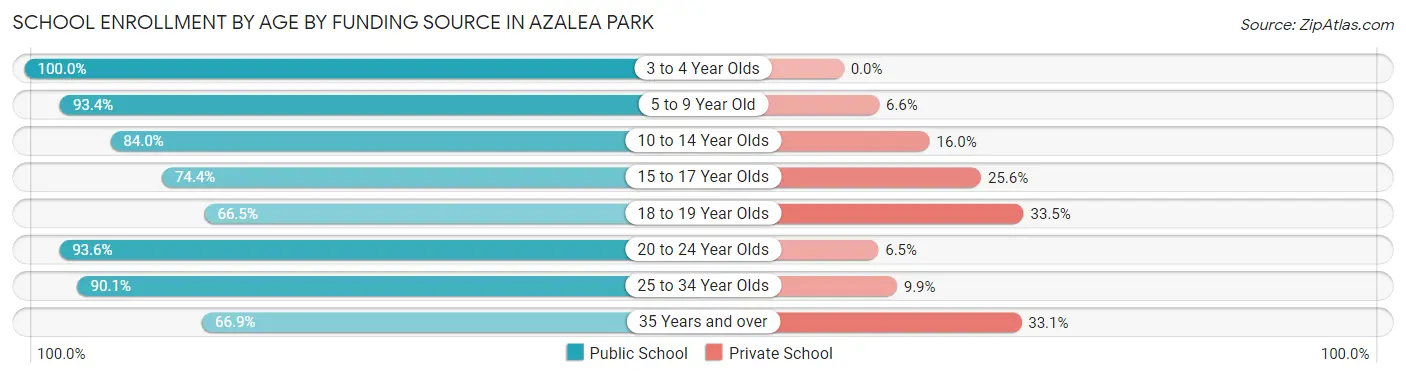
| Age Bracket | Public School | Private School |
| 3 to 4 Year Olds | 6 (100.0%) | 0 (0.0%) |
| 5 to 9 Year Old | 780 (93.4%) | 55 (6.6%) |
| 10 to 14 Year Olds | 783 (84.0%) | 149 (16.0%) |
| 15 to 17 Year Olds | 503 (74.4%) | 173 (25.6%) |
| 18 to 19 Year Olds | 121 (66.5%) | 61 (33.5%) |
| 20 to 24 Year Olds | 261 (93.5%) | 18 (6.5%) |
| 25 to 34 Year Olds | 337 (90.1%) | 37 (9.9%) |
| 35 Years and over | 87 (66.9%) | 43 (33.1%) |
| Total | 2,878 (84.3%) | 536 (15.7%) |
Educational Attainment by Field of Study in Azalea Park
Business (599 | 21.3%), education (281 | 10.0%), science & technology (262 | 9.3%), social sciences (257 | 9.1%), and psychology (219 | 7.8%) are the most common fields of study among 2,815 individuals in Azalea Park who have obtained a bachelor's degree or higher.
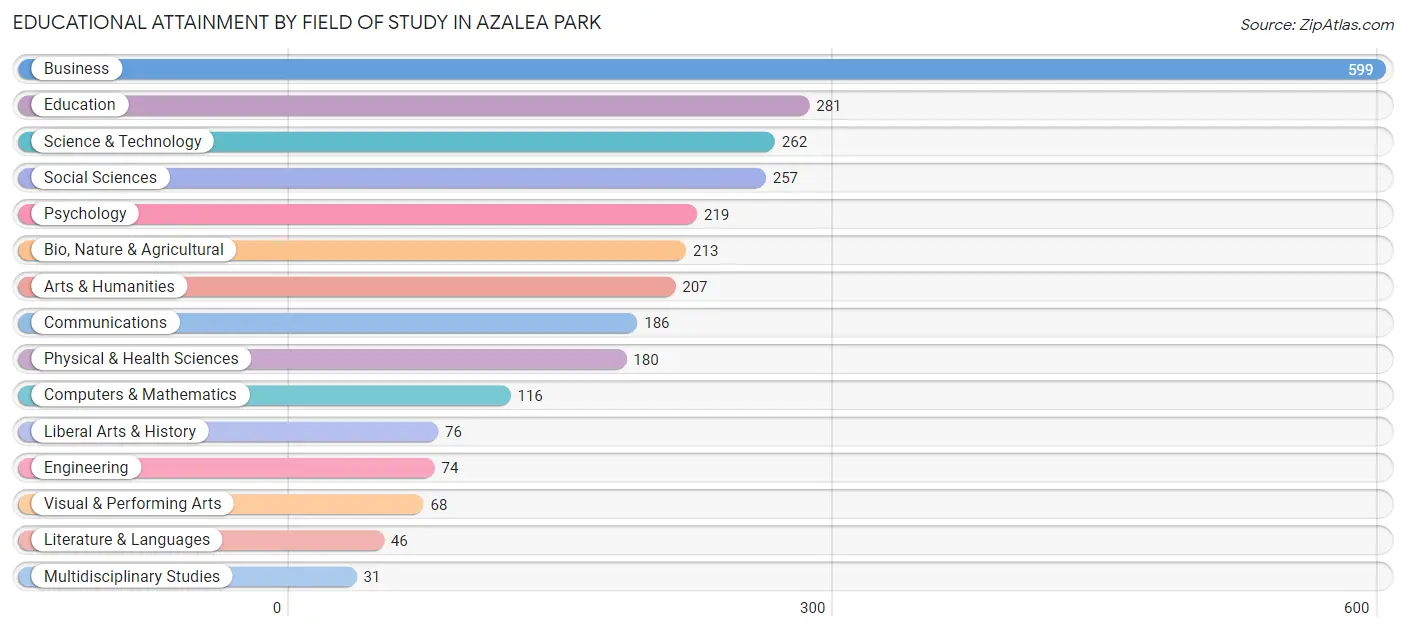
| Field of Study | # Graduates | % Graduates |
| Computers & Mathematics | 116 | 4.1% |
| Bio, Nature & Agricultural | 213 | 7.6% |
| Physical & Health Sciences | 180 | 6.4% |
| Psychology | 219 | 7.8% |
| Social Sciences | 257 | 9.1% |
| Engineering | 74 | 2.6% |
| Multidisciplinary Studies | 31 | 1.1% |
| Science & Technology | 262 | 9.3% |
| Business | 599 | 21.3% |
| Education | 281 | 10.0% |
| Literature & Languages | 46 | 1.6% |
| Liberal Arts & History | 76 | 2.7% |
| Visual & Performing Arts | 68 | 2.4% |
| Communications | 186 | 6.6% |
| Arts & Humanities | 207 | 7.3% |
| Total | 2,815 | 100.0% |
Transportation & Commute in Azalea Park
Vehicle Availability by Sex in Azalea Park
The most prevalent vehicle ownership categories in Azalea Park are males with 2 vehicles (2,322, accounting for 50.0%) and females with 2 vehicles (1,472, making up 68.1%).
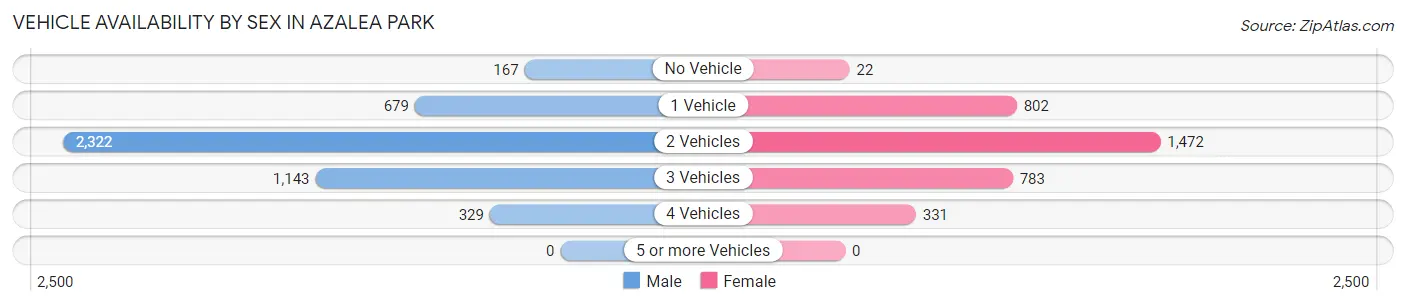
| Vehicles Available | Male | Female |
| No Vehicle | 167 (3.6%) | 22 (0.6%) |
| 1 Vehicle | 679 (14.6%) | 802 (23.5%) |
| 2 Vehicles | 2,322 (50.0%) | 1,472 (43.2%) |
| 3 Vehicles | 1,143 (24.6%) | 783 (23.0%) |
| 4 Vehicles | 329 (7.1%) | 331 (9.7%) |
| 5 or more Vehicles | 0 (0.0%) | 0 (0.0%) |
| Total | 4,640 (100.0%) | 3,410 (100.0%) |
Commute Time in Azalea Park
The most frequently occuring commute durations in Azalea Park are 20 to 24 minutes (1,678 commuters, 22.8%), 30 to 34 minutes (1,465 commuters, 19.9%), and 15 to 19 minutes (1,076 commuters, 14.6%).
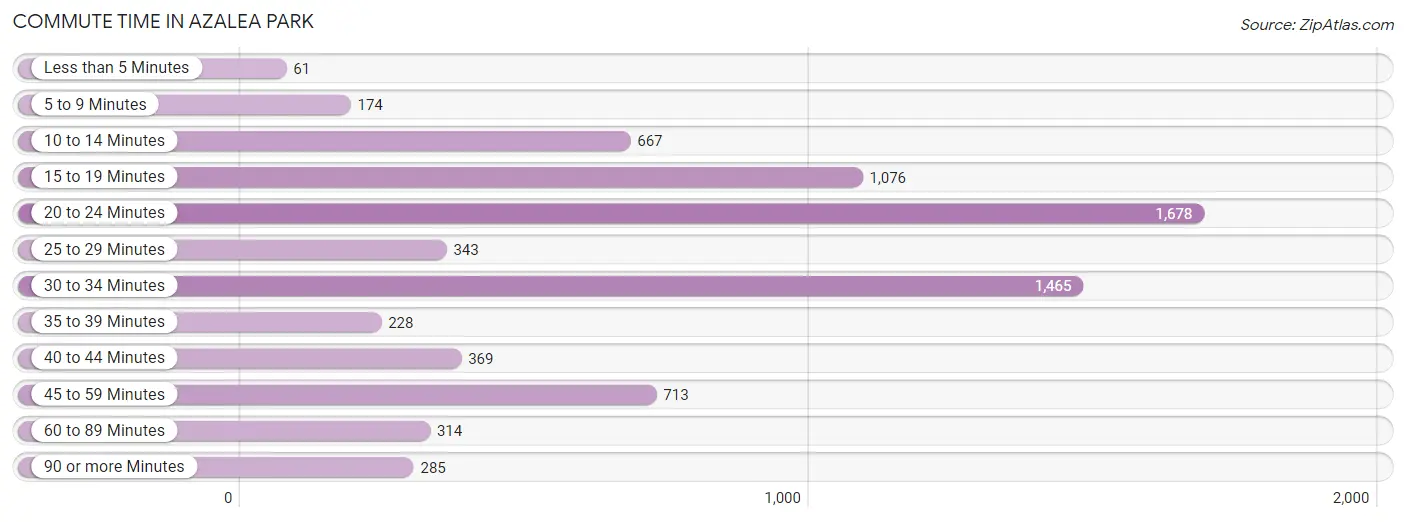
| Commute Time | # Commuters | % Commuters |
| Less than 5 Minutes | 61 | 0.8% |
| 5 to 9 Minutes | 174 | 2.4% |
| 10 to 14 Minutes | 667 | 9.0% |
| 15 to 19 Minutes | 1,076 | 14.6% |
| 20 to 24 Minutes | 1,678 | 22.8% |
| 25 to 29 Minutes | 343 | 4.6% |
| 30 to 34 Minutes | 1,465 | 19.9% |
| 35 to 39 Minutes | 228 | 3.1% |
| 40 to 44 Minutes | 369 | 5.0% |
| 45 to 59 Minutes | 713 | 9.7% |
| 60 to 89 Minutes | 314 | 4.3% |
| 90 or more Minutes | 285 | 3.9% |
Commute Time by Sex in Azalea Park
The most common commute times in Azalea Park are 20 to 24 minutes (909 commuters, 21.8%) for males and 20 to 24 minutes (769 commuters, 24.0%) for females.
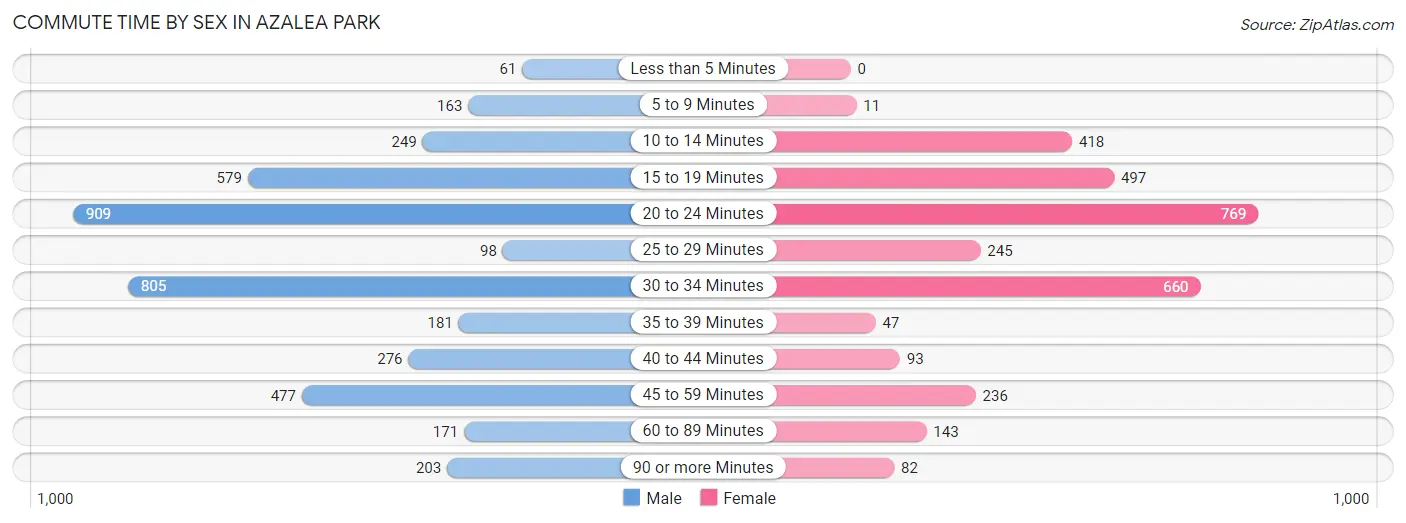
| Commute Time | Male | Female |
| Less than 5 Minutes | 61 (1.5%) | 0 (0.0%) |
| 5 to 9 Minutes | 163 (3.9%) | 11 (0.3%) |
| 10 to 14 Minutes | 249 (6.0%) | 418 (13.1%) |
| 15 to 19 Minutes | 579 (13.9%) | 497 (15.5%) |
| 20 to 24 Minutes | 909 (21.8%) | 769 (24.0%) |
| 25 to 29 Minutes | 98 (2.4%) | 245 (7.6%) |
| 30 to 34 Minutes | 805 (19.3%) | 660 (20.6%) |
| 35 to 39 Minutes | 181 (4.3%) | 47 (1.5%) |
| 40 to 44 Minutes | 276 (6.6%) | 93 (2.9%) |
| 45 to 59 Minutes | 477 (11.4%) | 236 (7.4%) |
| 60 to 89 Minutes | 171 (4.1%) | 143 (4.5%) |
| 90 or more Minutes | 203 (4.9%) | 82 (2.6%) |
Time of Departure to Work by Sex in Azalea Park
The most frequent times of departure to work in Azalea Park are 7:00 AM to 7:29 AM (762, 18.3%) for males and 7:30 AM to 7:59 AM (627, 19.6%) for females.
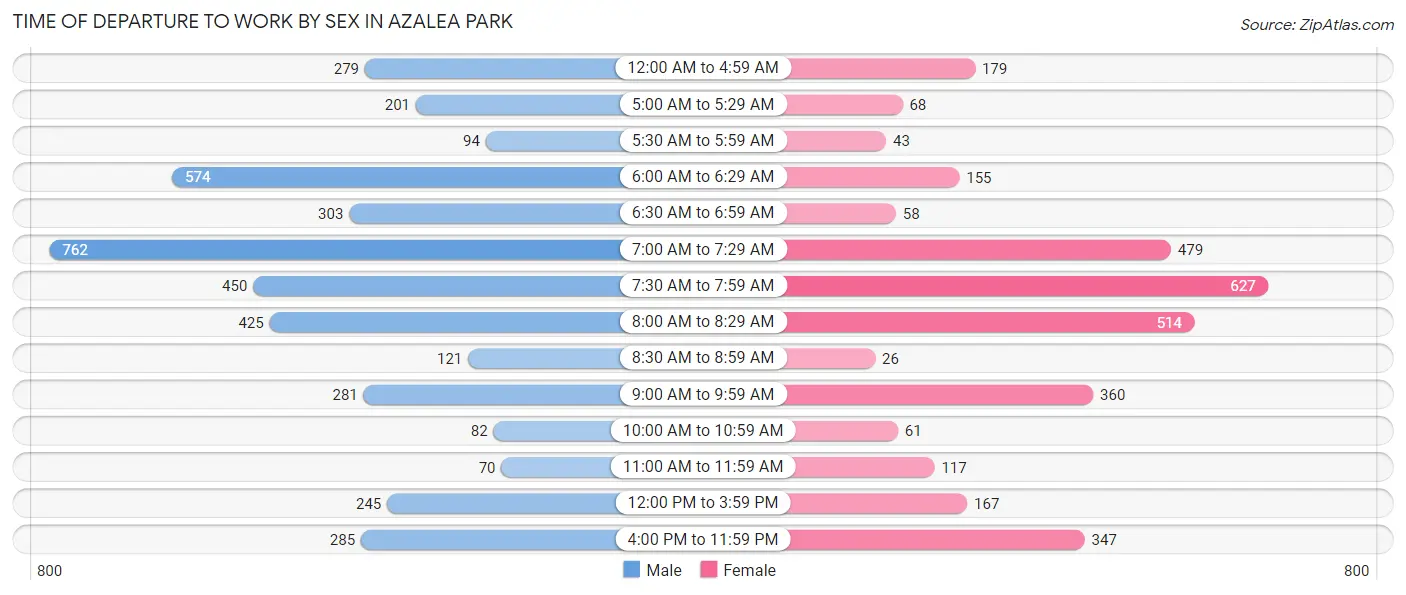
| Time of Departure | Male | Female |
| 12:00 AM to 4:59 AM | 279 (6.7%) | 179 (5.6%) |
| 5:00 AM to 5:29 AM | 201 (4.8%) | 68 (2.1%) |
| 5:30 AM to 5:59 AM | 94 (2.2%) | 43 (1.3%) |
| 6:00 AM to 6:29 AM | 574 (13.8%) | 155 (4.8%) |
| 6:30 AM to 6:59 AM | 303 (7.3%) | 58 (1.8%) |
| 7:00 AM to 7:29 AM | 762 (18.3%) | 479 (15.0%) |
| 7:30 AM to 7:59 AM | 450 (10.8%) | 627 (19.6%) |
| 8:00 AM to 8:29 AM | 425 (10.2%) | 514 (16.1%) |
| 8:30 AM to 8:59 AM | 121 (2.9%) | 26 (0.8%) |
| 9:00 AM to 9:59 AM | 281 (6.7%) | 360 (11.3%) |
| 10:00 AM to 10:59 AM | 82 (2.0%) | 61 (1.9%) |
| 11:00 AM to 11:59 AM | 70 (1.7%) | 117 (3.7%) |
| 12:00 PM to 3:59 PM | 245 (5.9%) | 167 (5.2%) |
| 4:00 PM to 11:59 PM | 285 (6.8%) | 347 (10.8%) |
| Total | 4,172 (100.0%) | 3,201 (100.0%) |
Housing Occupancy in Azalea Park
Occupancy by Ownership in Azalea Park
Of the total 5,521 dwellings in Azalea Park, owner-occupied units account for 2,962 (53.6%), while renter-occupied units make up 2,559 (46.4%).
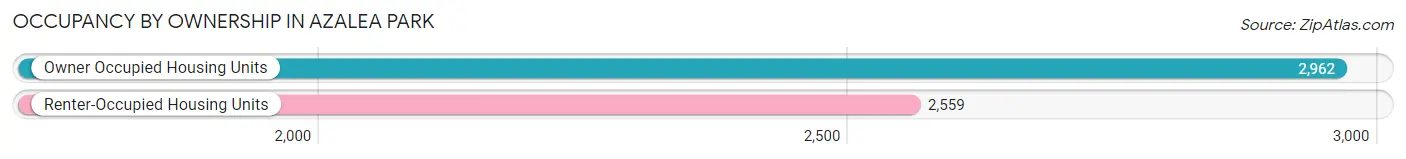
| Occupancy | # Housing Units | % Housing Units |
| Owner Occupied Housing Units | 2,962 | 53.6% |
| Renter-Occupied Housing Units | 2,559 | 46.4% |
| Total Occupied Housing Units | 5,521 | 100.0% |
Occupancy by Household Size in Azalea Park
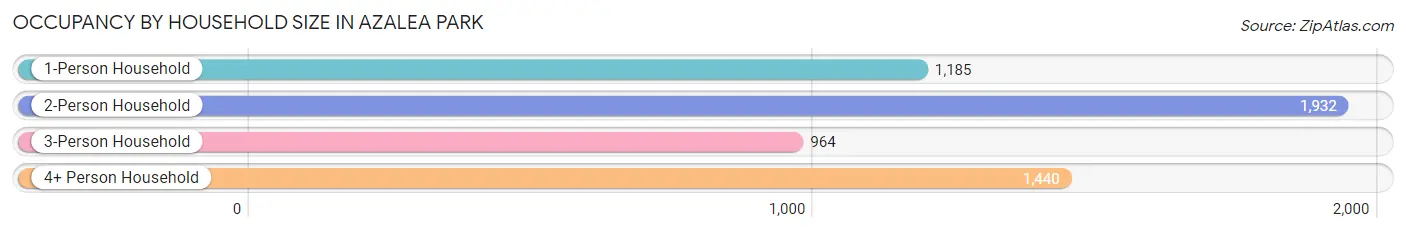
| Household Size | # Housing Units | % Housing Units |
| 1-Person Household | 1,185 | 21.5% |
| 2-Person Household | 1,932 | 35.0% |
| 3-Person Household | 964 | 17.5% |
| 4+ Person Household | 1,440 | 26.1% |
| Total Housing Units | 5,521 | 100.0% |
Occupancy by Ownership by Household Size in Azalea Park
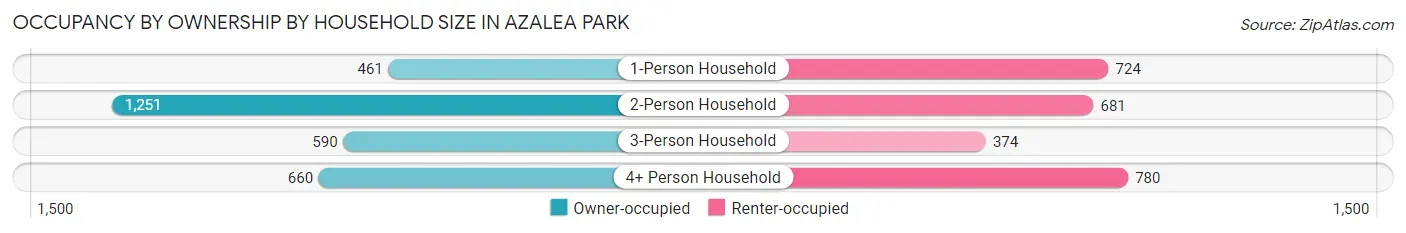
| Household Size | Owner-occupied | Renter-occupied |
| 1-Person Household | 461 (38.9%) | 724 (61.1%) |
| 2-Person Household | 1,251 (64.7%) | 681 (35.2%) |
| 3-Person Household | 590 (61.2%) | 374 (38.8%) |
| 4+ Person Household | 660 (45.8%) | 780 (54.2%) |
| Total Housing Units | 2,962 (53.6%) | 2,559 (46.4%) |
Occupancy by Educational Attainment in Azalea Park
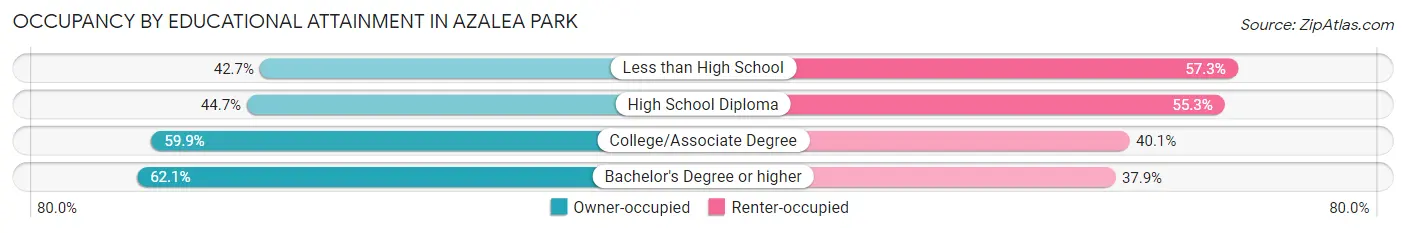
| Household Size | Owner-occupied | Renter-occupied |
| Less than High School | 342 (42.7%) | 459 (57.3%) |
| High School Diploma | 715 (44.7%) | 883 (55.3%) |
| College/Associate Degree | 927 (59.9%) | 621 (40.1%) |
| Bachelor's Degree or higher | 978 (62.1%) | 596 (37.9%) |
Occupancy by Age of Householder in Azalea Park
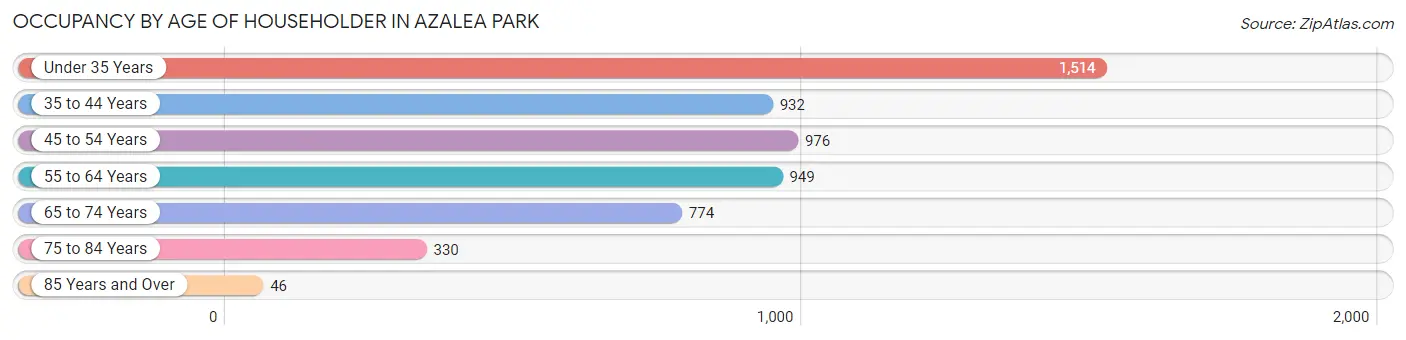
| Age Bracket | # Households | % Households |
| Under 35 Years | 1,514 | 27.4% |
| 35 to 44 Years | 932 | 16.9% |
| 45 to 54 Years | 976 | 17.7% |
| 55 to 64 Years | 949 | 17.2% |
| 65 to 74 Years | 774 | 14.0% |
| 75 to 84 Years | 330 | 6.0% |
| 85 Years and Over | 46 | 0.8% |
| Total | 5,521 | 100.0% |
Housing Finances in Azalea Park
Median Income by Occupancy in Azalea Park
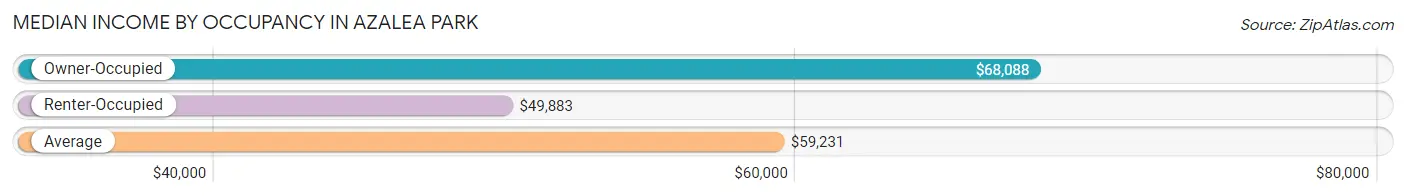
| Occupancy Type | # Households | Median Income |
| Owner-Occupied | 2,962 (53.6%) | $68,088 |
| Renter-Occupied | 2,559 (46.4%) | $49,883 |
| Average | 5,521 (100.0%) | $59,231 |
Occupancy by Householder Income Bracket in Azalea Park
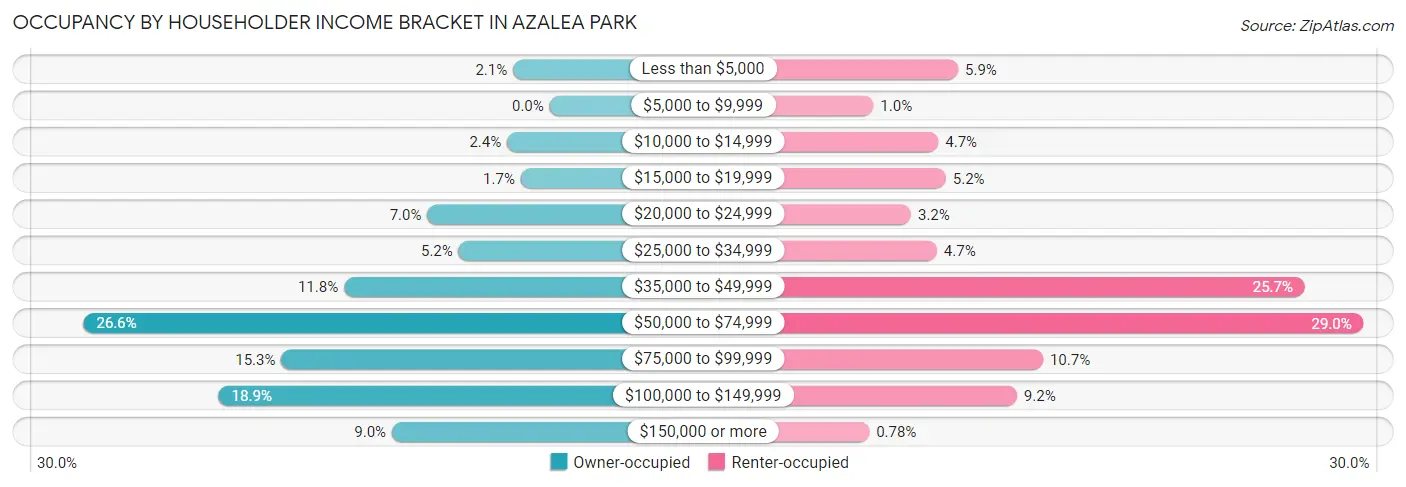
| Income Bracket | Owner-occupied | Renter-occupied |
| Less than $5,000 | 62 (2.1%) | 150 (5.9%) |
| $5,000 to $9,999 | 0 (0.0%) | 26 (1.0%) |
| $10,000 to $14,999 | 72 (2.4%) | 121 (4.7%) |
| $15,000 to $19,999 | 49 (1.7%) | 132 (5.2%) |
| $20,000 to $24,999 | 207 (7.0%) | 81 (3.2%) |
| $25,000 to $34,999 | 154 (5.2%) | 119 (4.6%) |
| $35,000 to $49,999 | 348 (11.7%) | 657 (25.7%) |
| $50,000 to $74,999 | 789 (26.6%) | 743 (29.0%) |
| $75,000 to $99,999 | 454 (15.3%) | 274 (10.7%) |
| $100,000 to $149,999 | 560 (18.9%) | 236 (9.2%) |
| $150,000 or more | 267 (9.0%) | 20 (0.8%) |
| Total | 2,962 (100.0%) | 2,559 (100.0%) |
Monthly Housing Cost Tiers in Azalea Park
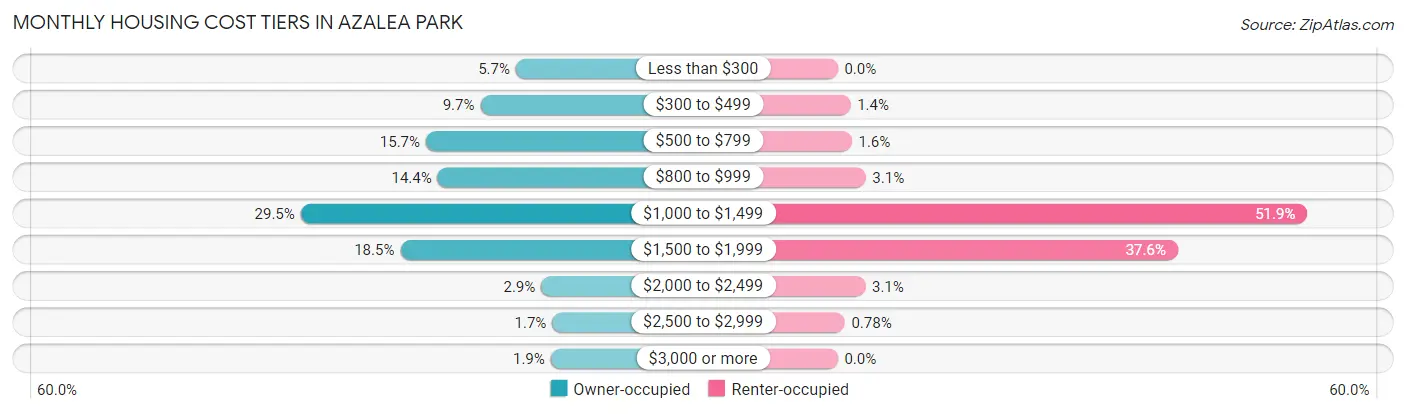
| Monthly Cost | Owner-occupied | Renter-occupied |
| Less than $300 | 170 (5.7%) | 0 (0.0%) |
| $300 to $499 | 286 (9.7%) | 36 (1.4%) |
| $500 to $799 | 464 (15.7%) | 40 (1.6%) |
| $800 to $999 | 426 (14.4%) | 79 (3.1%) |
| $1,000 to $1,499 | 874 (29.5%) | 1,328 (51.9%) |
| $1,500 to $1,999 | 548 (18.5%) | 962 (37.6%) |
| $2,000 to $2,499 | 87 (2.9%) | 78 (3.0%) |
| $2,500 to $2,999 | 51 (1.7%) | 20 (0.8%) |
| $3,000 or more | 56 (1.9%) | 0 (0.0%) |
| Total | 2,962 (100.0%) | 2,559 (100.0%) |
Physical Housing Characteristics in Azalea Park
Housing Structures in Azalea Park
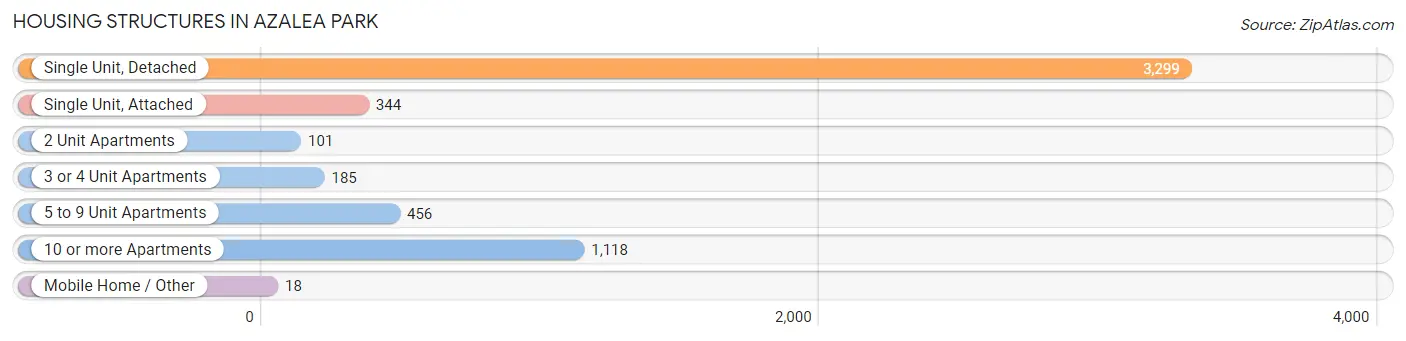
| Structure Type | # Housing Units | % Housing Units |
| Single Unit, Detached | 3,299 | 59.8% |
| Single Unit, Attached | 344 | 6.2% |
| 2 Unit Apartments | 101 | 1.8% |
| 3 or 4 Unit Apartments | 185 | 3.4% |
| 5 to 9 Unit Apartments | 456 | 8.3% |
| 10 or more Apartments | 1,118 | 20.3% |
| Mobile Home / Other | 18 | 0.3% |
| Total | 5,521 | 100.0% |
Housing Structures by Occupancy in Azalea Park
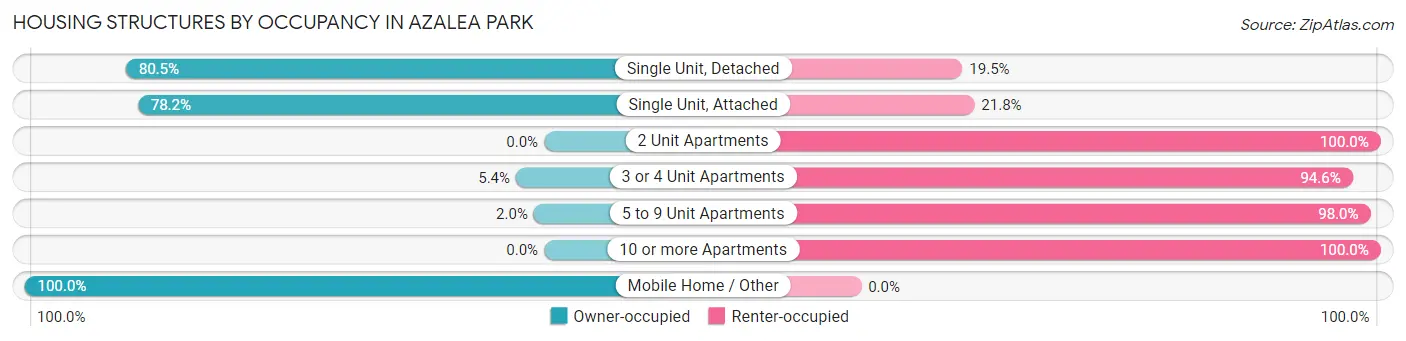
| Structure Type | Owner-occupied | Renter-occupied |
| Single Unit, Detached | 2,656 (80.5%) | 643 (19.5%) |
| Single Unit, Attached | 269 (78.2%) | 75 (21.8%) |
| 2 Unit Apartments | 0 (0.0%) | 101 (100.0%) |
| 3 or 4 Unit Apartments | 10 (5.4%) | 175 (94.6%) |
| 5 to 9 Unit Apartments | 9 (2.0%) | 447 (98.0%) |
| 10 or more Apartments | 0 (0.0%) | 1,118 (100.0%) |
| Mobile Home / Other | 18 (100.0%) | 0 (0.0%) |
| Total | 2,962 (53.6%) | 2,559 (46.4%) |
Housing Structures by Number of Rooms in Azalea Park
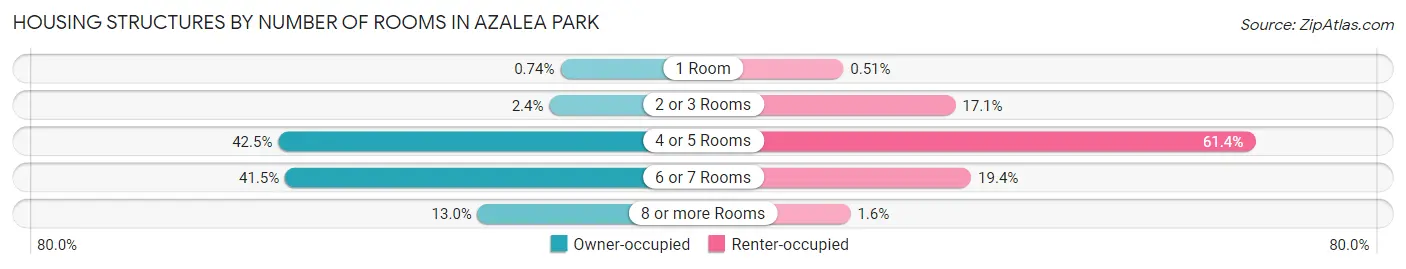
| Number of Rooms | Owner-occupied | Renter-occupied |
| 1 Room | 22 (0.7%) | 13 (0.5%) |
| 2 or 3 Rooms | 70 (2.4%) | 437 (17.1%) |
| 4 or 5 Rooms | 1,258 (42.5%) | 1,572 (61.4%) |
| 6 or 7 Rooms | 1,228 (41.5%) | 497 (19.4%) |
| 8 or more Rooms | 384 (13.0%) | 40 (1.6%) |
| Total | 2,962 (100.0%) | 2,559 (100.0%) |
Housing Structure by Heating Type in Azalea Park
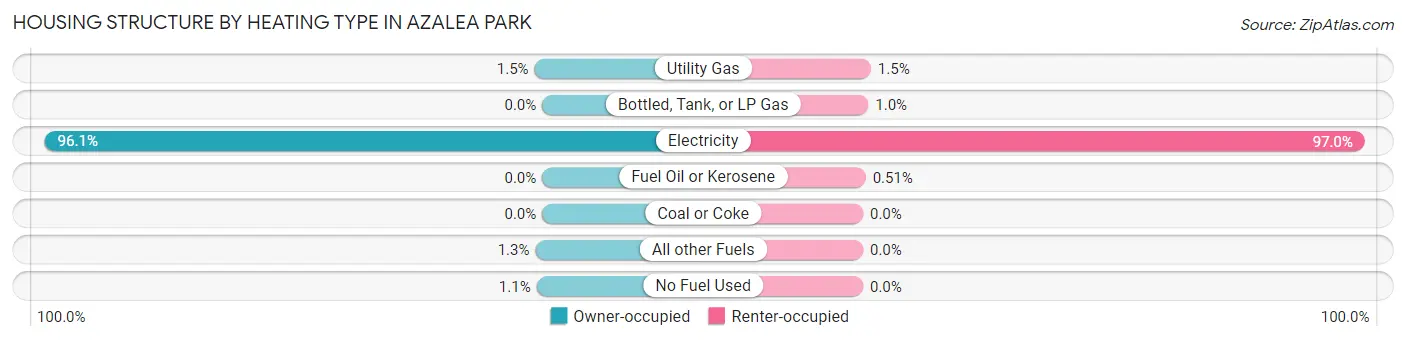
| Heating Type | Owner-occupied | Renter-occupied |
| Utility Gas | 44 (1.5%) | 39 (1.5%) |
| Bottled, Tank, or LP Gas | 0 (0.0%) | 26 (1.0%) |
| Electricity | 2,847 (96.1%) | 2,481 (97.0%) |
| Fuel Oil or Kerosene | 0 (0.0%) | 13 (0.5%) |
| Coal or Coke | 0 (0.0%) | 0 (0.0%) |
| All other Fuels | 39 (1.3%) | 0 (0.0%) |
| No Fuel Used | 32 (1.1%) | 0 (0.0%) |
| Total | 2,962 (100.0%) | 2,559 (100.0%) |
Household Vehicle Usage in Azalea Park
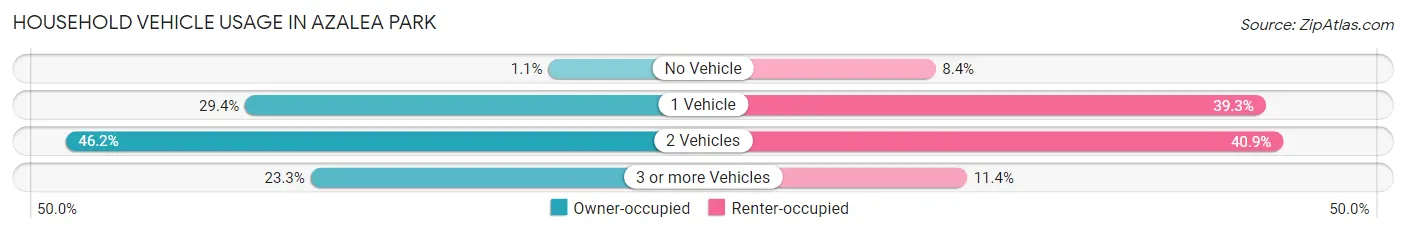
| Vehicles per Household | Owner-occupied | Renter-occupied |
| No Vehicle | 33 (1.1%) | 216 (8.4%) |
| 1 Vehicle | 871 (29.4%) | 1,005 (39.3%) |
| 2 Vehicles | 1,368 (46.2%) | 1,047 (40.9%) |
| 3 or more Vehicles | 690 (23.3%) | 291 (11.4%) |
| Total | 2,962 (100.0%) | 2,559 (100.0%) |
Real Estate & Mortgages in Azalea Park
Real Estate and Mortgage Overview in Azalea Park
| Characteristic | Without Mortgage | With Mortgage |
| Housing Units | 923 | 2,039 |
| Median Property Value | $220,000 | $229,400 |
| Median Household Income | $90,040 | $155 |
| Monthly Housing Costs | $509 | $56 |
| Real Estate Taxes | $1,066 | $102 |
Property Value by Mortgage Status in Azalea Park
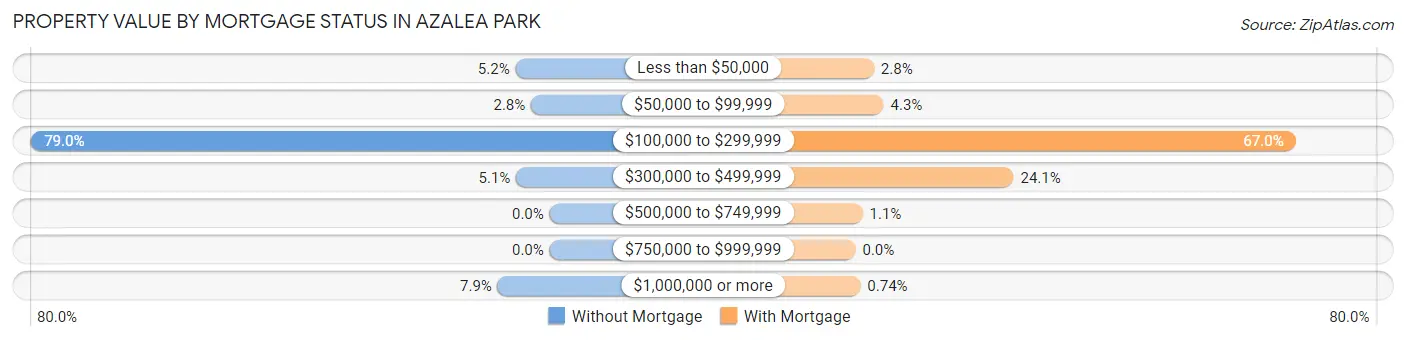
| Property Value | Without Mortgage | With Mortgage |
| Less than $50,000 | 48 (5.2%) | 57 (2.8%) |
| $50,000 to $99,999 | 26 (2.8%) | 87 (4.3%) |
| $100,000 to $299,999 | 729 (79.0%) | 1,367 (67.0%) |
| $300,000 to $499,999 | 47 (5.1%) | 491 (24.1%) |
| $500,000 to $749,999 | 0 (0.0%) | 22 (1.1%) |
| $750,000 to $999,999 | 0 (0.0%) | 0 (0.0%) |
| $1,000,000 or more | 73 (7.9%) | 15 (0.7%) |
| Total | 923 (100.0%) | 2,039 (100.0%) |
Household Income by Mortgage Status in Azalea Park
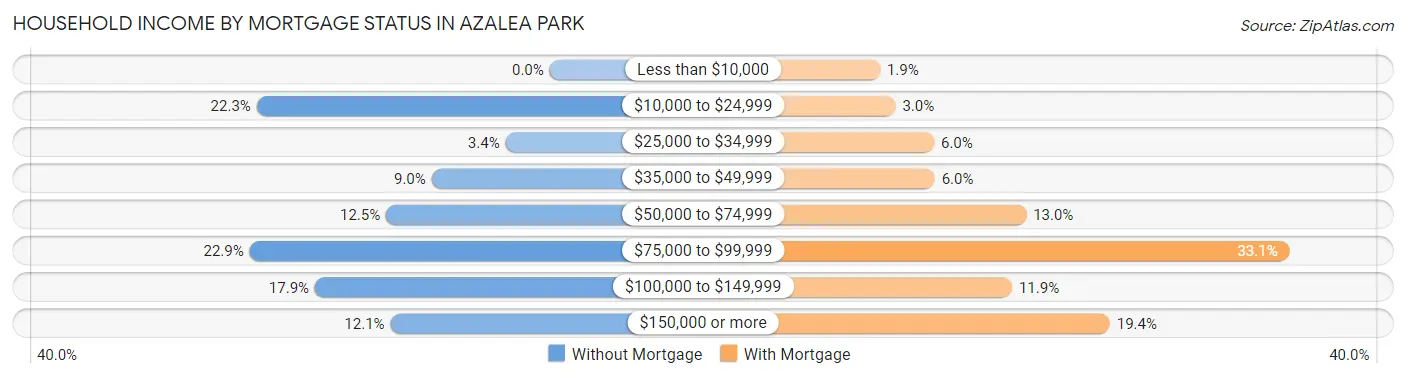
| Household Income | Without Mortgage | With Mortgage |
| Less than $10,000 | 0 (0.0%) | 38 (1.9%) |
| $10,000 to $24,999 | 206 (22.3%) | 62 (3.0%) |
| $25,000 to $34,999 | 31 (3.4%) | 122 (6.0%) |
| $35,000 to $49,999 | 83 (9.0%) | 123 (6.0%) |
| $50,000 to $74,999 | 115 (12.5%) | 265 (13.0%) |
| $75,000 to $99,999 | 211 (22.9%) | 674 (33.1%) |
| $100,000 to $149,999 | 165 (17.9%) | 243 (11.9%) |
| $150,000 or more | 112 (12.1%) | 395 (19.4%) |
| Total | 923 (100.0%) | 2,039 (100.0%) |
Property Value to Household Income Ratio in Azalea Park
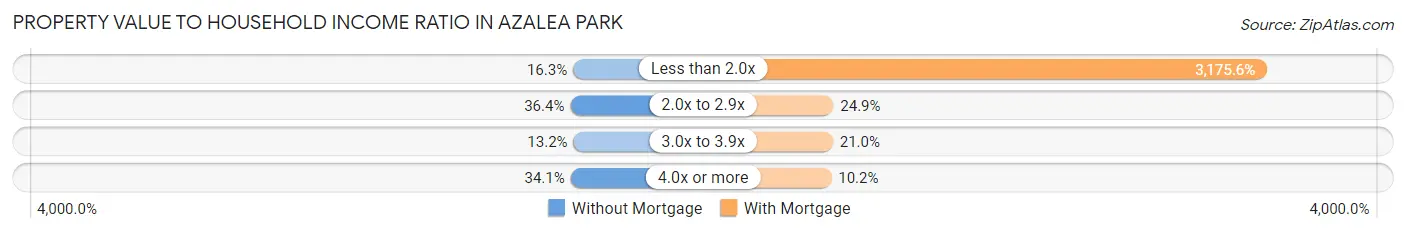
| Value-to-Income Ratio | Without Mortgage | With Mortgage |
| Less than 2.0x | 150 (16.3%) | 64,750 (3,175.6%) |
| 2.0x to 2.9x | 336 (36.4%) | 508 (24.9%) |
| 3.0x to 3.9x | 122 (13.2%) | 428 (21.0%) |
| 4.0x or more | 315 (34.1%) | 207 (10.2%) |
| Total | 923 (100.0%) | 2,039 (100.0%) |
Real Estate Taxes by Mortgage Status in Azalea Park
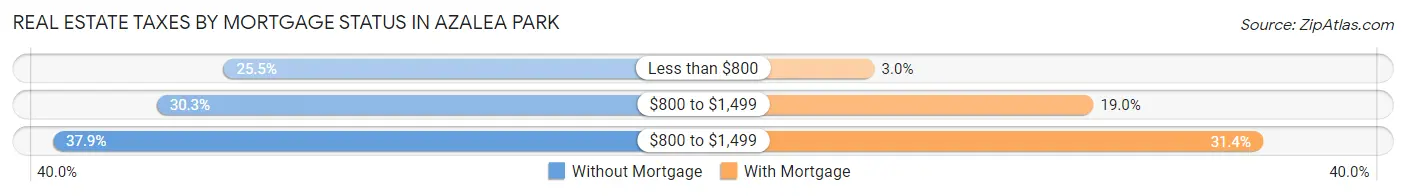
| Property Taxes | Without Mortgage | With Mortgage |
| Less than $800 | 235 (25.5%) | 62 (3.0%) |
| $800 to $1,499 | 280 (30.3%) | 388 (19.0%) |
| $800 to $1,499 | 350 (37.9%) | 640 (31.4%) |
| Total | 923 (100.0%) | 2,039 (100.0%) |
Health & Disability in Azalea Park
Health Insurance Coverage by Age in Azalea Park
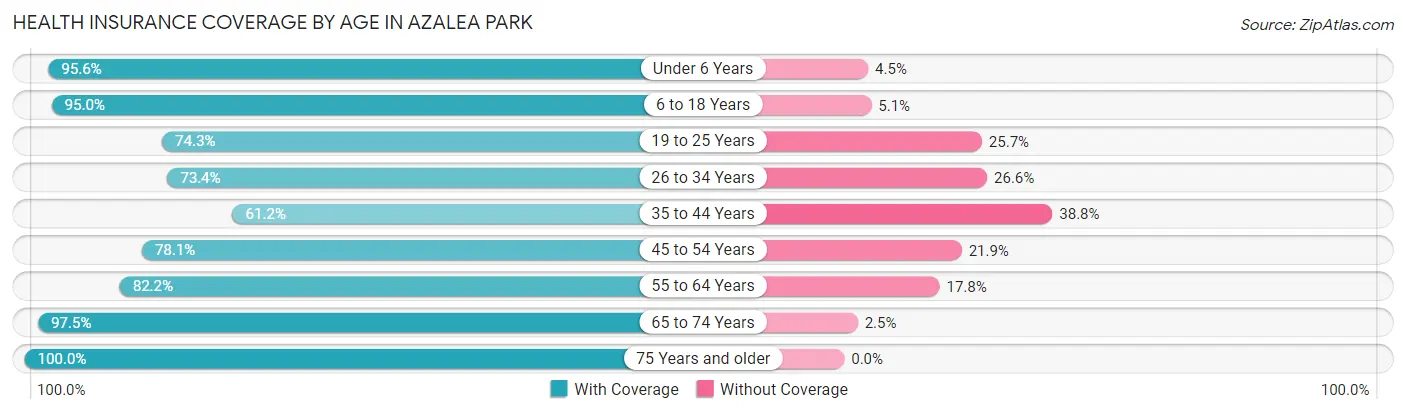
| Age Bracket | With Coverage | Without Coverage |
| Under 6 Years | 901 (95.6%) | 42 (4.4%) |
| 6 to 18 Years | 2,351 (95.0%) | 125 (5.1%) |
| 19 to 25 Years | 1,069 (74.3%) | 369 (25.7%) |
| 26 to 34 Years | 2,174 (73.4%) | 789 (26.6%) |
| 35 to 44 Years | 1,341 (61.2%) | 850 (38.8%) |
| 45 to 54 Years | 1,427 (78.1%) | 400 (21.9%) |
| 55 to 64 Years | 1,547 (82.2%) | 334 (17.8%) |
| 65 to 74 Years | 1,133 (97.5%) | 29 (2.5%) |
| 75 Years and older | 1,116 (100.0%) | 0 (0.0%) |
| Total | 13,059 (81.6%) | 2,938 (18.4%) |
Health Insurance Coverage by Citizenship Status in Azalea Park
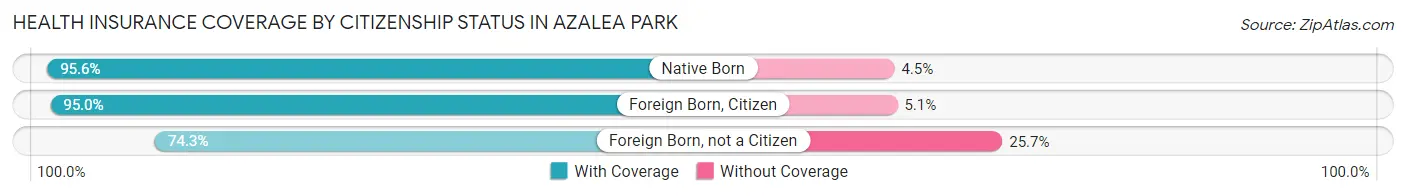
| Citizenship Status | With Coverage | Without Coverage |
| Native Born | 901 (95.6%) | 42 (4.4%) |
| Foreign Born, Citizen | 2,351 (95.0%) | 125 (5.1%) |
| Foreign Born, not a Citizen | 1,069 (74.3%) | 369 (25.7%) |
Health Insurance Coverage by Household Income in Azalea Park
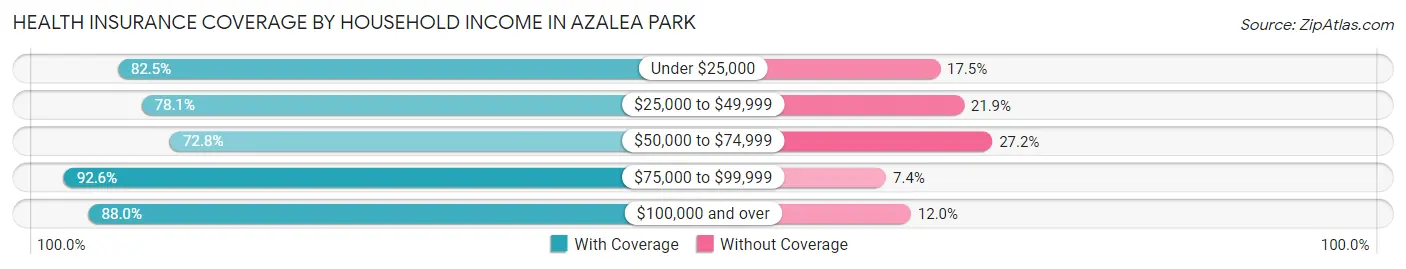
| Household Income | With Coverage | Without Coverage |
| Under $25,000 | 1,488 (82.5%) | 315 (17.5%) |
| $25,000 to $49,999 | 2,994 (78.1%) | 841 (21.9%) |
| $50,000 to $74,999 | 3,091 (72.8%) | 1,157 (27.2%) |
| $75,000 to $99,999 | 2,153 (92.6%) | 171 (7.4%) |
| $100,000 and over | 3,315 (88.0%) | 452 (12.0%) |
Public vs Private Health Insurance Coverage by Age in Azalea Park
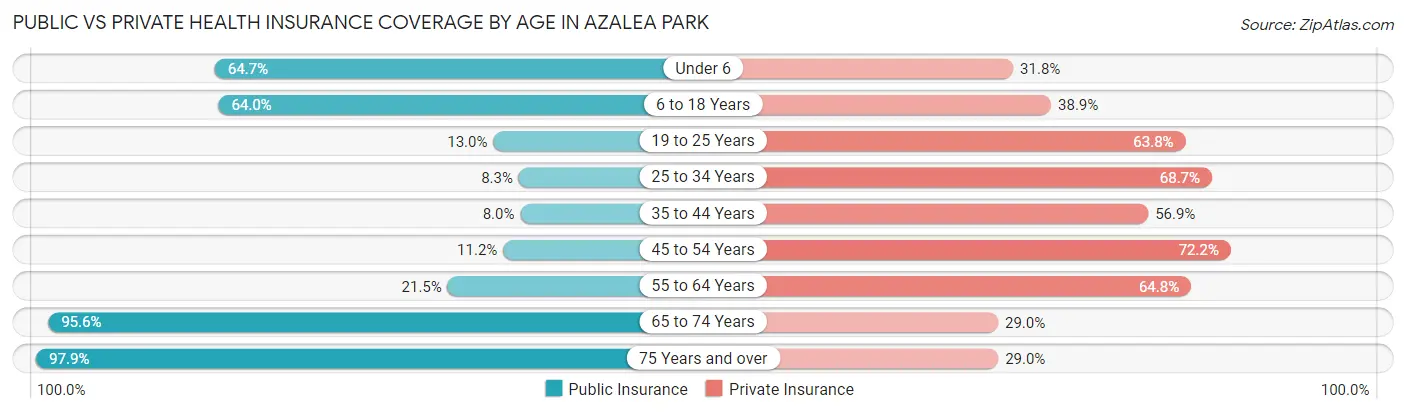
| Age Bracket | Public Insurance | Private Insurance |
| Under 6 | 610 (64.7%) | 300 (31.8%) |
| 6 to 18 Years | 1,585 (64.0%) | 962 (38.9%) |
| 19 to 25 Years | 187 (13.0%) | 917 (63.8%) |
| 25 to 34 Years | 245 (8.3%) | 2,035 (68.7%) |
| 35 to 44 Years | 175 (8.0%) | 1,246 (56.9%) |
| 45 to 54 Years | 204 (11.2%) | 1,319 (72.2%) |
| 55 to 64 Years | 404 (21.5%) | 1,219 (64.8%) |
| 65 to 74 Years | 1,111 (95.6%) | 337 (29.0%) |
| 75 Years and over | 1,092 (97.9%) | 324 (29.0%) |
| Total | 5,613 (35.1%) | 8,659 (54.1%) |
Disability Status by Sex by Age in Azalea Park
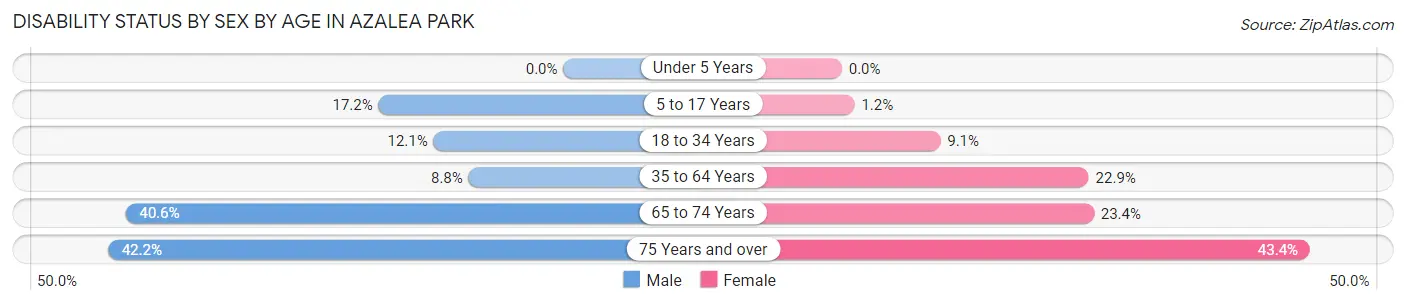
| Age Bracket | Male | Female |
| Under 5 Years | 0 (0.0%) | 0 (0.0%) |
| 5 to 17 Years | 220 (17.2%) | 14 (1.2%) |
| 18 to 34 Years | 321 (12.0%) | 172 (9.1%) |
| 35 to 64 Years | 256 (8.8%) | 684 (22.9%) |
| 65 to 74 Years | 232 (40.6%) | 138 (23.4%) |
| 75 Years and over | 127 (42.2%) | 354 (43.4%) |
Disability Class by Sex by Age in Azalea Park
Disability Class: Hearing Difficulty
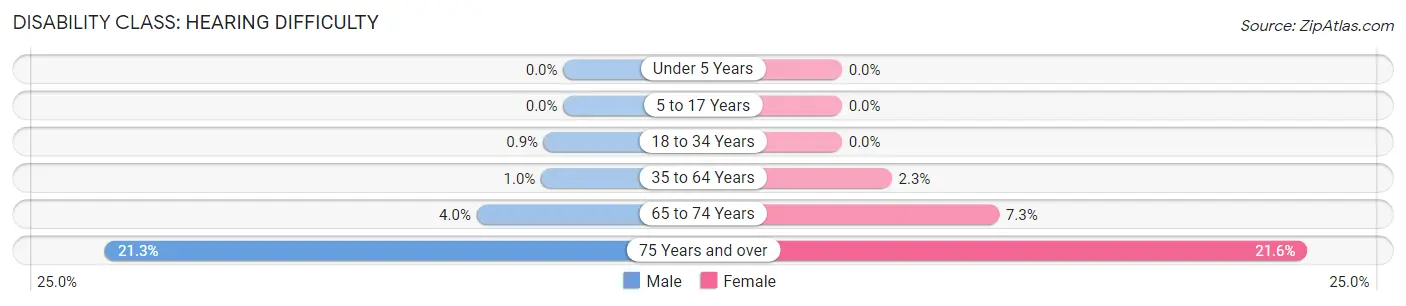
| Age Bracket | Male | Female |
| Under 5 Years | 0 (0.0%) | 0 (0.0%) |
| 5 to 17 Years | 0 (0.0%) | 0 (0.0%) |
| 18 to 34 Years | 24 (0.9%) | 0 (0.0%) |
| 35 to 64 Years | 30 (1.0%) | 69 (2.3%) |
| 65 to 74 Years | 23 (4.0%) | 43 (7.3%) |
| 75 Years and over | 64 (21.3%) | 176 (21.6%) |
Disability Class: Vision Difficulty
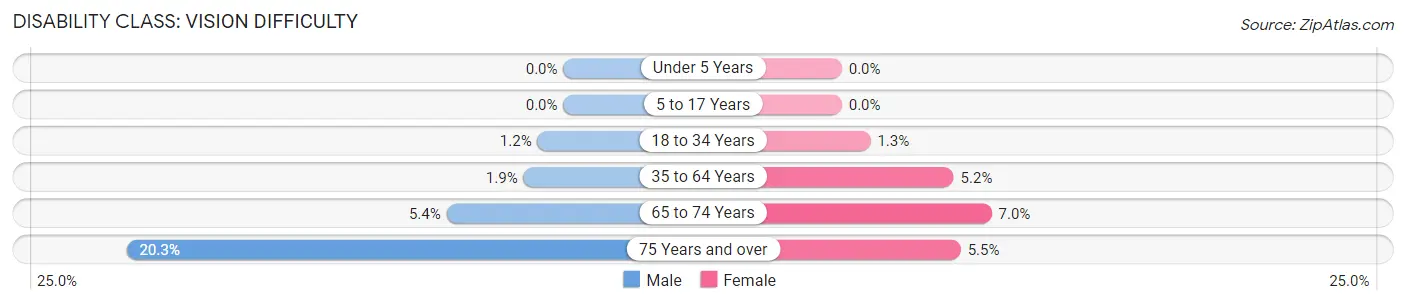
| Age Bracket | Male | Female |
| Under 5 Years | 0 (0.0%) | 0 (0.0%) |
| 5 to 17 Years | 0 (0.0%) | 0 (0.0%) |
| 18 to 34 Years | 32 (1.2%) | 25 (1.3%) |
| 35 to 64 Years | 54 (1.8%) | 155 (5.2%) |
| 65 to 74 Years | 31 (5.4%) | 41 (7.0%) |
| 75 Years and over | 61 (20.3%) | 45 (5.5%) |
Disability Class: Cognitive Difficulty
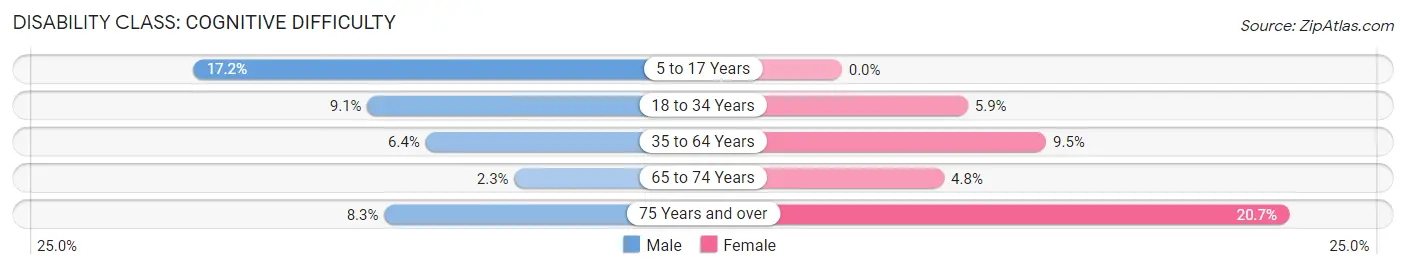
| Age Bracket | Male | Female |
| 5 to 17 Years | 220 (17.2%) | 0 (0.0%) |
| 18 to 34 Years | 242 (9.1%) | 110 (5.9%) |
| 35 to 64 Years | 186 (6.4%) | 283 (9.5%) |
| 65 to 74 Years | 13 (2.3%) | 28 (4.8%) |
| 75 Years and over | 25 (8.3%) | 169 (20.7%) |
Disability Class: Ambulatory Difficulty
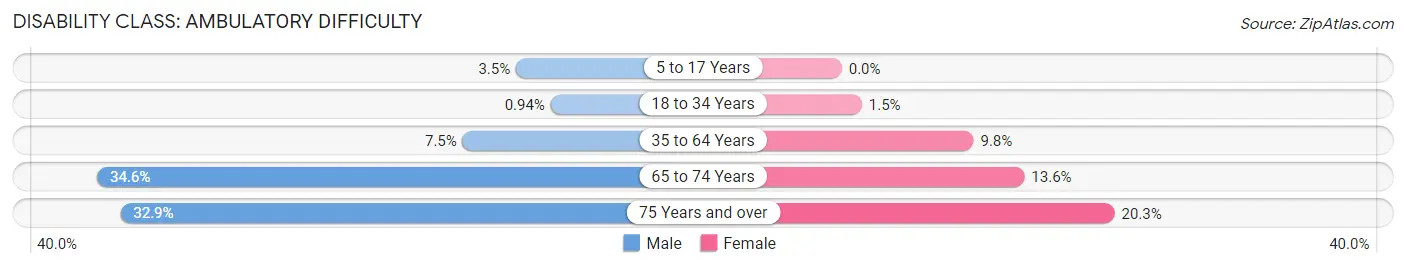
| Age Bracket | Male | Female |
| 5 to 17 Years | 45 (3.5%) | 0 (0.0%) |
| 18 to 34 Years | 25 (0.9%) | 28 (1.5%) |
| 35 to 64 Years | 218 (7.5%) | 292 (9.8%) |
| 65 to 74 Years | 198 (34.6%) | 80 (13.6%) |
| 75 Years and over | 99 (32.9%) | 165 (20.3%) |
Disability Class: Self-Care Difficulty
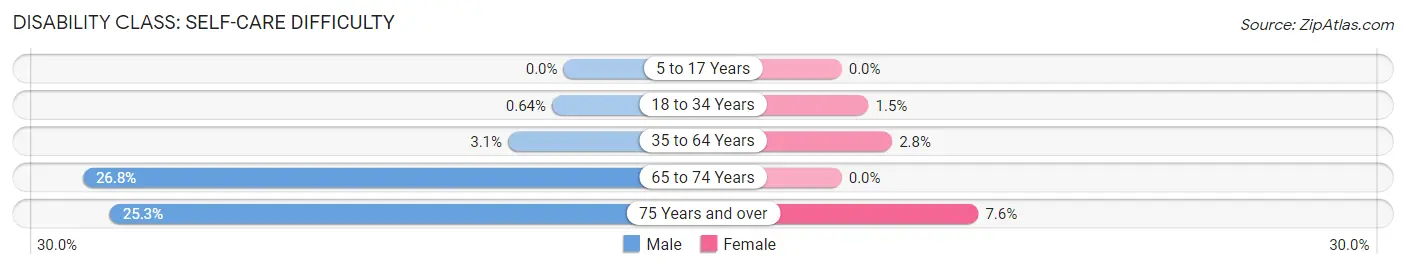
| Age Bracket | Male | Female |
| 5 to 17 Years | 0 (0.0%) | 0 (0.0%) |
| 18 to 34 Years | 17 (0.6%) | 28 (1.5%) |
| 35 to 64 Years | 90 (3.1%) | 84 (2.8%) |
| 65 to 74 Years | 153 (26.8%) | 0 (0.0%) |
| 75 Years and over | 76 (25.3%) | 62 (7.6%) |
Technology Access in Azalea Park
Computing Device Access in Azalea Park
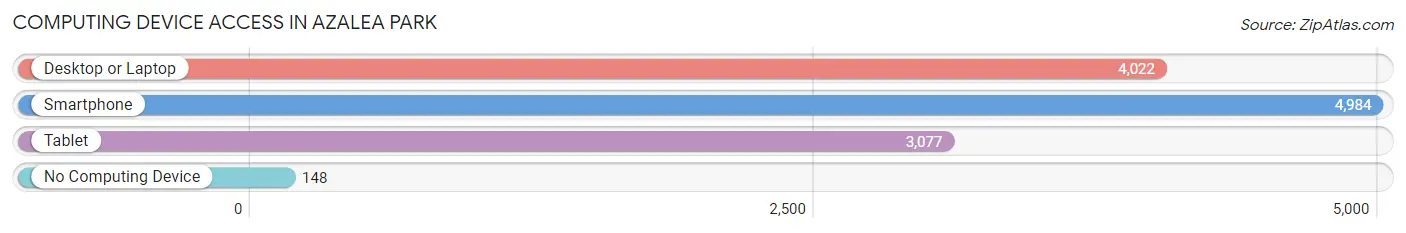
| Device Type | # Households | % Households |
| Desktop or Laptop | 4,022 | 72.9% |
| Smartphone | 4,984 | 90.3% |
| Tablet | 3,077 | 55.7% |
| No Computing Device | 148 | 2.7% |
| Total | 5,521 | 100.0% |
Internet Access in Azalea Park
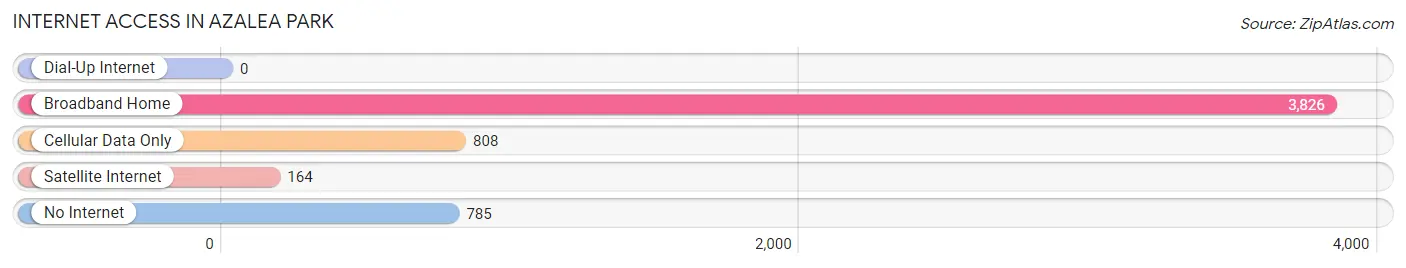
| Internet Type | # Households | % Households |
| Dial-Up Internet | 0 | 0.0% |
| Broadband Home | 3,826 | 69.3% |
| Cellular Data Only | 808 | 14.6% |
| Satellite Internet | 164 | 3.0% |
| No Internet | 785 | 14.2% |
| Total | 5,521 | 100.0% |
Azalea Park Summary
Azalea Park is a census-designated place (CDP) located in Orange County, Florida, United States. The population was 12,556 at the 2010 census. It is part of the Orlando–Kissimmee–Sanford Metropolitan Statistical Area.
History
Azalea Park was founded in the early 1950s by a group of developers from the Azalea Park Land Company. The area was originally intended to be a residential community, but it quickly grew into a commercial center. The area was named after the azalea bushes that were planted in the area.
The area was annexed by the City of Orlando in 1957, and the city began to develop the area. The city built a new fire station, a library, and a post office. The area also saw the construction of a shopping center, a movie theater, and a bowling alley.
Geography
Azalea Park is located at 28°31'25" North, 81°19'45" West (28.523750, -81.329167). According to the United States Census Bureau, the CDP has a total area of 4.2 square miles (10.8 km2), all land.
Economy
Azalea Park is home to a variety of businesses, including retail stores, restaurants, and professional services. The area is also home to a number of industrial and manufacturing businesses.
Demographics
As of the census of 2000, there were 12,556 people, 4,845 households, and 3,541 families residing in the CDP. The population density was 2,988.3 people per square mile (1,156.2/km2). There were 5,093 housing units at an average density of 1,214.3/sq mi (468.7/km2). The racial makeup of the CDP was 79.2% White, 11.2% African American, 0.4% Native American, 2.2% Asian, 0.1% Pacific Islander, 4.7% from other races, and 2.2% from two or more races. Hispanic or Latino of any race were 13.2% of the population.
There were 4,845 households, out of which 33.2% had children under the age of 18 living with them, 54.2% were married couples living together, 12.7% had a female householder with no husband present, and 28.2% were non-families. 21.2% of all households were made up of individuals, and 7.2% had someone living alone who was 65 years of age or older. The average household size was 2.58 and the average family size was 3.02.
In the CDP, the population was spread out, with 24.2% under the age of 18, 8.7% from 18 to 24, 32.2% from 25 to 44, 22.3% from 45 to 64, and 12.6% who were 65 years of age or older. The median age was 36 years. For every 100 females, there were 94.2 males. For every 100 females age 18 and over, there were 90.7 males.
The median income for a household in the CDP was $41,945, and the median income for a family was $46,945. Males had a median income of $31,945 versus $25,945 for females. The per capita income for the CDP was $19,945. About 8.2% of families and 10.2% of the population were below the poverty line, including 14.2% of those under age 18 and 8.2% of those age 65 or over.
Common Questions
What is Per Capita Income in Azalea Park?
Per Capita income in Azalea Park is $27,132.
What is the Median Family Income in Azalea Park?
Median Family Income in Azalea Park is $61,393.
What is the Median Household income in Azalea Park?
Median Household Income in Azalea Park is $59,231.
What is Income or Wage Gap in Azalea Park?
Income or Wage Gap in Azalea Park is 16.6%.
Women in Azalea Park earn 83.4 cents for every dollar earned by a man.
What is Family Income Deficit in Azalea Park?
Family Income Deficit in Azalea Park is $9,962.
Families that are below poverty line in Azalea Park earn $9,962 less on average than the poverty threshold level.
What is Inequality or Gini Index in Azalea Park?
Inequality or Gini Index in Azalea Park is 0.40.
What is the Total Population of Azalea Park?
Total Population of Azalea Park is 16,024.
What is the Total Male Population of Azalea Park?
Total Male Population of Azalea Park is 8,208.
What is the Total Female Population of Azalea Park?
Total Female Population of Azalea Park is 7,816.
What is the Ratio of Males per 100 Females in Azalea Park?
There are 105.02 Males per 100 Females in Azalea Park.
What is the Ratio of Females per 100 Males in Azalea Park?
There are 95.22 Females per 100 Males in Azalea Park.
What is the Median Population Age in Azalea Park?
Median Population Age in Azalea Park is 35.7 Years.
What is the Average Family Size in Azalea Park
Average Family Size in Azalea Park is 3.3 People.
What is the Average Household Size in Azalea Park
Average Household Size in Azalea Park is 2.9 People.
How Large is the Labor Force in Azalea Park?
There are 8,785 People in the Labor Forcein in Azalea Park.
What is the Percentage of People in the Labor Force in Azalea Park?
66.9% of People are in the Labor Force in Azalea Park.
What is the Unemployment Rate in Azalea Park?
Unemployment Rate in Azalea Park is 6.7%.