Yakama vs Immigrants from Oceania Currently Married
COMPARE
Yakama
Immigrants from Oceania
Currently Married
Currently Married Comparison
Yakama
Immigrants from Oceania
44.0%
CURRENTLY MARRIED
0.2/ 100
METRIC RATING
255th/ 347
METRIC RANK
46.5%
CURRENTLY MARRIED
44.6/ 100
METRIC RATING
179th/ 347
METRIC RANK
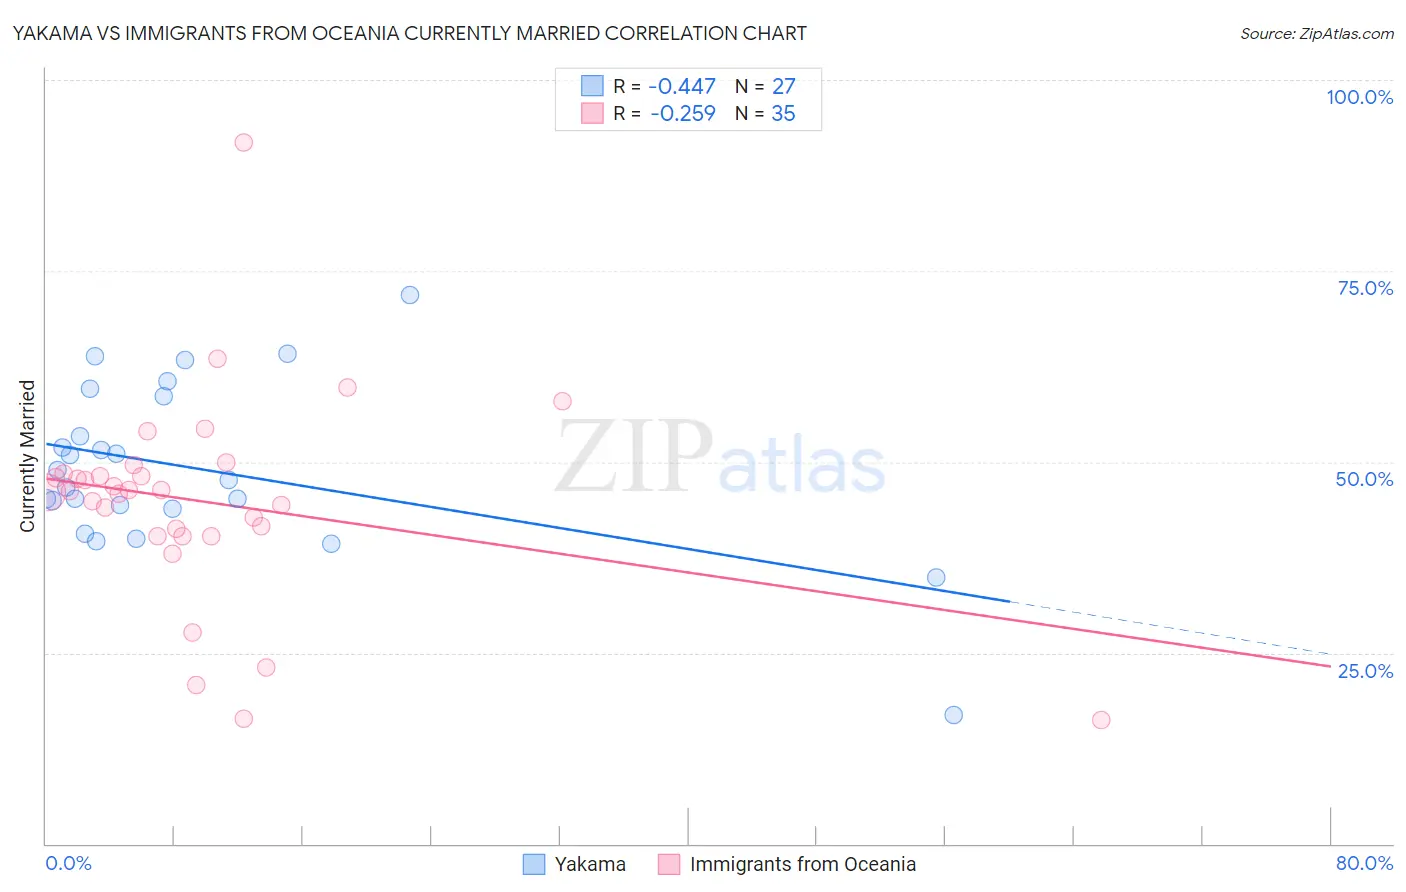
Yakama vs Immigrants from Oceania Currently Married Correlation Chart
The statistical analysis conducted on geographies consisting of 19,923,144 people shows a moderate negative correlation between the proportion of Yakama and percentage of population currently married in the United States with a correlation coefficient (R) of -0.447 and weighted average of 44.0%. Similarly, the statistical analysis conducted on geographies consisting of 305,491,409 people shows a weak negative correlation between the proportion of Immigrants from Oceania and percentage of population currently married in the United States with a correlation coefficient (R) of -0.259 and weighted average of 46.5%, a difference of 5.8%.
Currently Married Correlation Summary
| Measurement | Yakama | Immigrants from Oceania |
| Minimum | 16.9% | 16.2% |
| Maximum | 71.8% | 91.9% |
| Range | 54.9% | 75.7% |
| Mean | 49.0% | 44.8% |
| Median | 47.7% | 46.2% |
| Interquartile 25% (IQ1) | 43.8% | 40.3% |
| Interquartile 75% (IQ3) | 58.6% | 48.5% |
| Interquartile Range (IQR) | 14.8% | 8.2% |
| Standard Deviation (Sample) | 11.2% | 13.7% |
| Standard Deviation (Population) | 11.0% | 13.5% |
Similar Demographics by Currently Married
Demographics Similar to Yakama by Currently Married
In terms of currently married, the demographic groups most similar to Yakama are Shoshone (44.0%, a difference of 0.050%), Vietnamese (44.0%, a difference of 0.070%), Immigrants from Africa (43.9%, a difference of 0.25%), Ute (43.9%, a difference of 0.26%), and Immigrants from Central America (44.1%, a difference of 0.32%).
| Demographics | Rating | Rank | Currently Married |
| Nicaraguans | 0.3 /100 | #248 | Tragic 44.2% |
| Immigrants | Cameroon | 0.3 /100 | #249 | Tragic 44.2% |
| Immigrants | Eastern Africa | 0.3 /100 | #250 | Tragic 44.2% |
| Blackfeet | 0.3 /100 | #251 | Tragic 44.2% |
| Hispanics or Latinos | 0.3 /100 | #252 | Tragic 44.1% |
| Immigrants | Central America | 0.3 /100 | #253 | Tragic 44.1% |
| Vietnamese | 0.2 /100 | #254 | Tragic 44.0% |
| Yakama | 0.2 /100 | #255 | Tragic 44.0% |
| Shoshone | 0.2 /100 | #256 | Tragic 44.0% |
| Immigrants | Africa | 0.2 /100 | #257 | Tragic 43.9% |
| Ute | 0.2 /100 | #258 | Tragic 43.9% |
| Immigrants | Sierra Leone | 0.1 /100 | #259 | Tragic 43.8% |
| Immigrants | Latin America | 0.1 /100 | #260 | Tragic 43.8% |
| Immigrants | Nicaragua | 0.1 /100 | #261 | Tragic 43.7% |
| Bangladeshis | 0.1 /100 | #262 | Tragic 43.7% |
Demographics Similar to Immigrants from Oceania by Currently Married
In terms of currently married, the demographic groups most similar to Immigrants from Oceania are Costa Rican (46.5%, a difference of 0.030%), Ottawa (46.5%, a difference of 0.060%), Potawatomi (46.5%, a difference of 0.10%), Chickasaw (46.6%, a difference of 0.12%), and Hawaiian (46.6%, a difference of 0.15%).
| Demographics | Rating | Rank | Currently Married |
| Aleuts | 52.0 /100 | #172 | Average 46.7% |
| Tlingit-Haida | 51.2 /100 | #173 | Average 46.7% |
| Peruvians | 50.0 /100 | #174 | Average 46.6% |
| Immigrants | Brazil | 49.9 /100 | #175 | Average 46.6% |
| Hawaiians | 48.6 /100 | #176 | Average 46.6% |
| Israelis | 48.6 /100 | #177 | Average 46.6% |
| Chickasaw | 47.8 /100 | #178 | Average 46.6% |
| Immigrants | Oceania | 44.6 /100 | #179 | Average 46.5% |
| Costa Ricans | 43.7 /100 | #180 | Average 46.5% |
| Ottawa | 43.0 /100 | #181 | Average 46.5% |
| Potawatomi | 41.9 /100 | #182 | Average 46.5% |
| Immigrants | Northern Africa | 39.7 /100 | #183 | Fair 46.5% |
| Brazilians | 39.3 /100 | #184 | Fair 46.4% |
| Mongolians | 37.6 /100 | #185 | Fair 46.4% |
| Immigrants | Chile | 36.8 /100 | #186 | Fair 46.4% |