Yakama vs Brazilian Currently Married
COMPARE
Yakama
Brazilian
Currently Married
Currently Married Comparison
Yakama
Brazilians
44.0%
CURRENTLY MARRIED
0.2/ 100
METRIC RATING
255th/ 347
METRIC RANK
46.4%
CURRENTLY MARRIED
39.3/ 100
METRIC RATING
184th/ 347
METRIC RANK
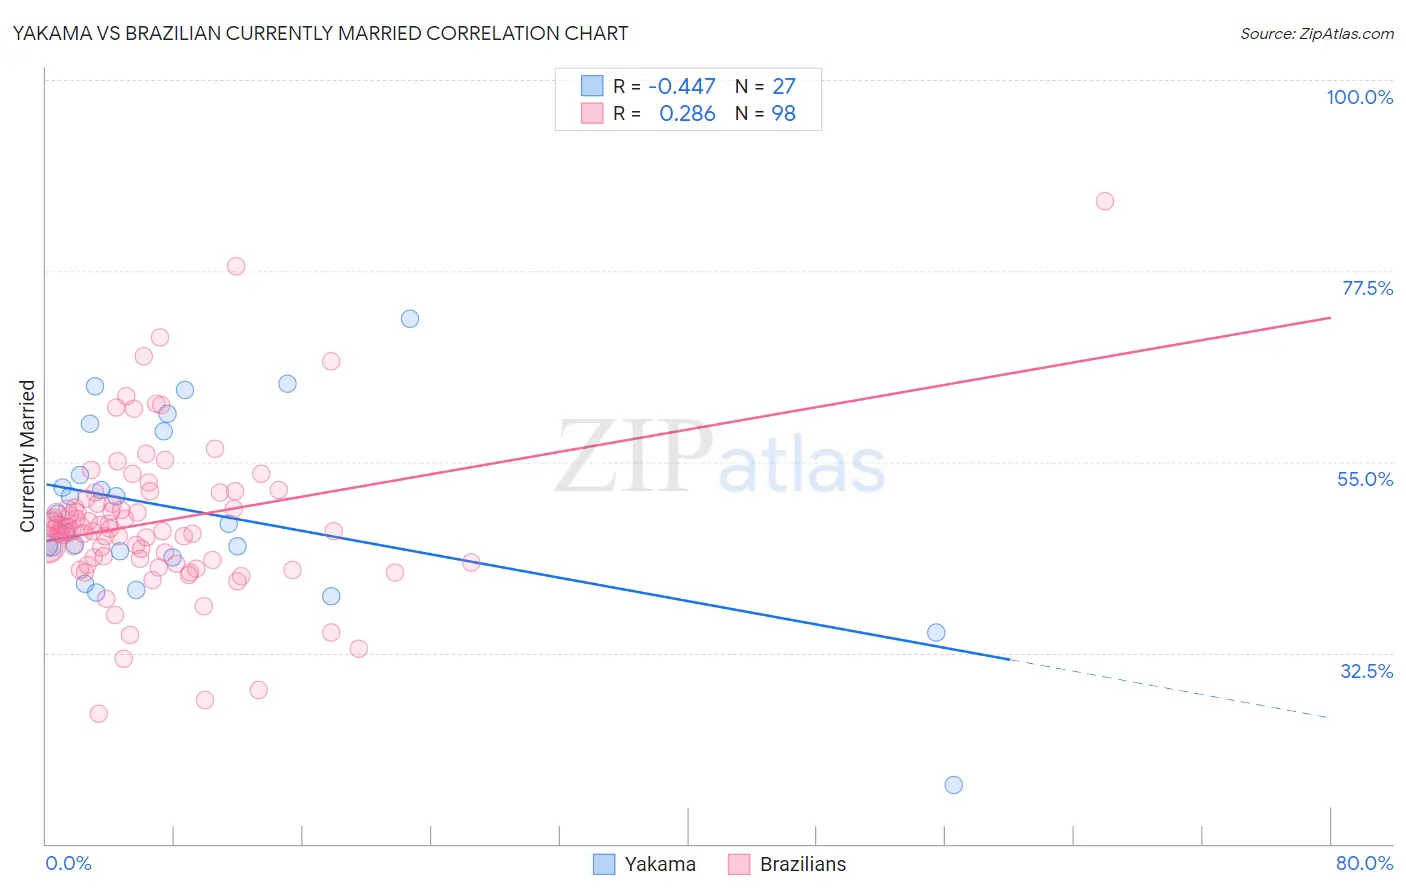
Yakama vs Brazilian Currently Married Correlation Chart
The statistical analysis conducted on geographies consisting of 19,923,144 people shows a moderate negative correlation between the proportion of Yakama and percentage of population currently married in the United States with a correlation coefficient (R) of -0.447 and weighted average of 44.0%. Similarly, the statistical analysis conducted on geographies consisting of 323,904,544 people shows a weak positive correlation between the proportion of Brazilians and percentage of population currently married in the United States with a correlation coefficient (R) of 0.286 and weighted average of 46.4%, a difference of 5.6%.
Currently Married Correlation Summary
| Measurement | Yakama | Brazilian |
| Minimum | 16.9% | 25.3% |
| Maximum | 71.8% | 85.7% |
| Range | 54.9% | 60.4% |
| Mean | 49.0% | 47.9% |
| Median | 47.7% | 47.2% |
| Interquartile 25% (IQ1) | 43.8% | 43.5% |
| Interquartile 75% (IQ3) | 58.6% | 50.1% |
| Interquartile Range (IQR) | 14.8% | 6.6% |
| Standard Deviation (Sample) | 11.2% | 9.1% |
| Standard Deviation (Population) | 11.0% | 9.1% |
Similar Demographics by Currently Married
Demographics Similar to Yakama by Currently Married
In terms of currently married, the demographic groups most similar to Yakama are Shoshone (44.0%, a difference of 0.050%), Vietnamese (44.0%, a difference of 0.070%), Immigrants from Africa (43.9%, a difference of 0.25%), Ute (43.9%, a difference of 0.26%), and Immigrants from Central America (44.1%, a difference of 0.32%).
| Demographics | Rating | Rank | Currently Married |
| Nicaraguans | 0.3 /100 | #248 | Tragic 44.2% |
| Immigrants | Cameroon | 0.3 /100 | #249 | Tragic 44.2% |
| Immigrants | Eastern Africa | 0.3 /100 | #250 | Tragic 44.2% |
| Blackfeet | 0.3 /100 | #251 | Tragic 44.2% |
| Hispanics or Latinos | 0.3 /100 | #252 | Tragic 44.1% |
| Immigrants | Central America | 0.3 /100 | #253 | Tragic 44.1% |
| Vietnamese | 0.2 /100 | #254 | Tragic 44.0% |
| Yakama | 0.2 /100 | #255 | Tragic 44.0% |
| Shoshone | 0.2 /100 | #256 | Tragic 44.0% |
| Immigrants | Africa | 0.2 /100 | #257 | Tragic 43.9% |
| Ute | 0.2 /100 | #258 | Tragic 43.9% |
| Immigrants | Sierra Leone | 0.1 /100 | #259 | Tragic 43.8% |
| Immigrants | Latin America | 0.1 /100 | #260 | Tragic 43.8% |
| Immigrants | Nicaragua | 0.1 /100 | #261 | Tragic 43.7% |
| Bangladeshis | 0.1 /100 | #262 | Tragic 43.7% |
Demographics Similar to Brazilians by Currently Married
In terms of currently married, the demographic groups most similar to Brazilians are Immigrants from Northern Africa (46.5%, a difference of 0.020%), Mongolian (46.4%, a difference of 0.070%), Potawatomi (46.5%, a difference of 0.10%), Immigrants from Chile (46.4%, a difference of 0.10%), and Ottawa (46.5%, a difference of 0.14%).
| Demographics | Rating | Rank | Currently Married |
| Israelis | 48.6 /100 | #177 | Average 46.6% |
| Chickasaw | 47.8 /100 | #178 | Average 46.6% |
| Immigrants | Oceania | 44.6 /100 | #179 | Average 46.5% |
| Costa Ricans | 43.7 /100 | #180 | Average 46.5% |
| Ottawa | 43.0 /100 | #181 | Average 46.5% |
| Potawatomi | 41.9 /100 | #182 | Average 46.5% |
| Immigrants | Northern Africa | 39.7 /100 | #183 | Fair 46.5% |
| Brazilians | 39.3 /100 | #184 | Fair 46.4% |
| Mongolians | 37.6 /100 | #185 | Fair 46.4% |
| Immigrants | Chile | 36.8 /100 | #186 | Fair 46.4% |
| Immigrants | Peru | 35.3 /100 | #187 | Fair 46.4% |
| Colombians | 31.8 /100 | #188 | Fair 46.3% |
| Fijians | 30.3 /100 | #189 | Fair 46.3% |
| Choctaw | 29.1 /100 | #190 | Fair 46.3% |
| Immigrants | France | 27.7 /100 | #191 | Fair 46.2% |