Puerto Rican vs Immigrants from Oceania Currently Married
COMPARE
Puerto Rican
Immigrants from Oceania
Currently Married
Currently Married Comparison
Puerto Ricans
Immigrants from Oceania
39.9%
CURRENTLY MARRIED
0.0/ 100
METRIC RATING
334th/ 347
METRIC RANK
46.5%
CURRENTLY MARRIED
44.6/ 100
METRIC RATING
179th/ 347
METRIC RANK
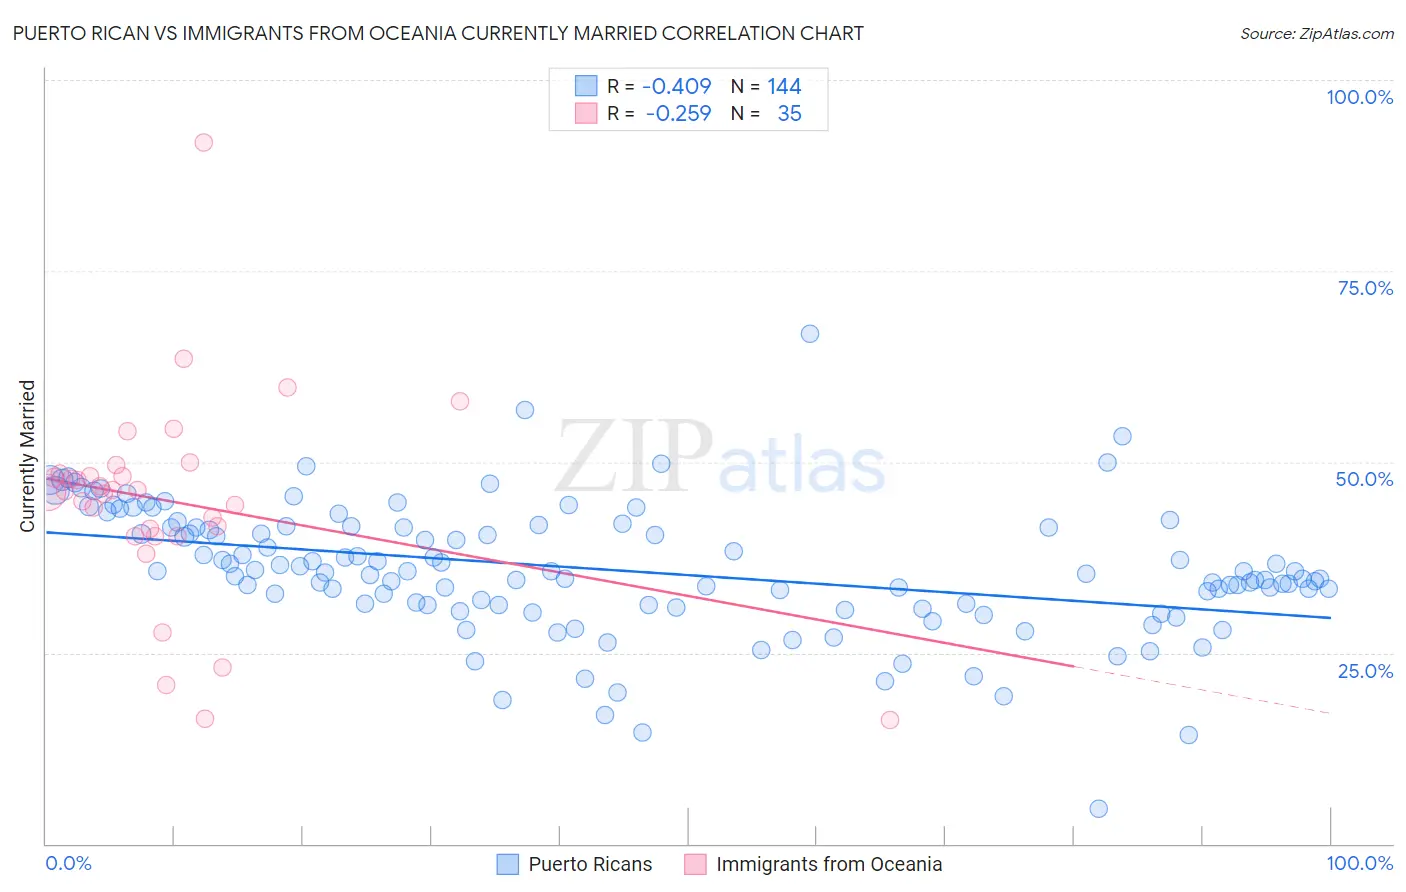
Puerto Rican vs Immigrants from Oceania Currently Married Correlation Chart
The statistical analysis conducted on geographies consisting of 528,221,069 people shows a moderate negative correlation between the proportion of Puerto Ricans and percentage of population currently married in the United States with a correlation coefficient (R) of -0.409 and weighted average of 39.9%. Similarly, the statistical analysis conducted on geographies consisting of 305,491,409 people shows a weak negative correlation between the proportion of Immigrants from Oceania and percentage of population currently married in the United States with a correlation coefficient (R) of -0.259 and weighted average of 46.5%, a difference of 16.6%.
Currently Married Correlation Summary
| Measurement | Puerto Rican | Immigrants from Oceania |
| Minimum | 4.6% | 16.2% |
| Maximum | 66.7% | 91.9% |
| Range | 62.1% | 75.7% |
| Mean | 35.8% | 44.8% |
| Median | 35.4% | 46.2% |
| Interquartile 25% (IQ1) | 31.3% | 40.3% |
| Interquartile 75% (IQ3) | 41.4% | 48.5% |
| Interquartile Range (IQR) | 10.1% | 8.2% |
| Standard Deviation (Sample) | 8.6% | 13.7% |
| Standard Deviation (Population) | 8.6% | 13.5% |
Similar Demographics by Currently Married
Demographics Similar to Puerto Ricans by Currently Married
In terms of currently married, the demographic groups most similar to Puerto Ricans are Yup'ik (39.9%, a difference of 0.010%), Lumbee (39.8%, a difference of 0.16%), British West Indian (39.8%, a difference of 0.34%), Immigrants from St. Vincent and the Grenadines (40.1%, a difference of 0.41%), and Black/African American (39.6%, a difference of 0.72%).
| Demographics | Rating | Rank | Currently Married |
| Senegalese | 0.0 /100 | #327 | Tragic 40.6% |
| Arapaho | 0.0 /100 | #328 | Tragic 40.5% |
| Crow | 0.0 /100 | #329 | Tragic 40.4% |
| Immigrants | Dominica | 0.0 /100 | #330 | Tragic 40.3% |
| Immigrants | Barbados | 0.0 /100 | #331 | Tragic 40.3% |
| Immigrants | St. Vincent and the Grenadines | 0.0 /100 | #332 | Tragic 40.1% |
| Yup'ik | 0.0 /100 | #333 | Tragic 39.9% |
| Puerto Ricans | 0.0 /100 | #334 | Tragic 39.9% |
| Lumbee | 0.0 /100 | #335 | Tragic 39.8% |
| British West Indians | 0.0 /100 | #336 | Tragic 39.8% |
| Blacks/African Americans | 0.0 /100 | #337 | Tragic 39.6% |
| Cape Verdeans | 0.0 /100 | #338 | Tragic 39.6% |
| Dominicans | 0.0 /100 | #339 | Tragic 39.5% |
| Immigrants | Grenada | 0.0 /100 | #340 | Tragic 39.1% |
| Navajo | 0.0 /100 | #341 | Tragic 39.0% |
Demographics Similar to Immigrants from Oceania by Currently Married
In terms of currently married, the demographic groups most similar to Immigrants from Oceania are Costa Rican (46.5%, a difference of 0.030%), Ottawa (46.5%, a difference of 0.060%), Potawatomi (46.5%, a difference of 0.10%), Chickasaw (46.6%, a difference of 0.12%), and Hawaiian (46.6%, a difference of 0.15%).
| Demographics | Rating | Rank | Currently Married |
| Aleuts | 52.0 /100 | #172 | Average 46.7% |
| Tlingit-Haida | 51.2 /100 | #173 | Average 46.7% |
| Peruvians | 50.0 /100 | #174 | Average 46.6% |
| Immigrants | Brazil | 49.9 /100 | #175 | Average 46.6% |
| Hawaiians | 48.6 /100 | #176 | Average 46.6% |
| Israelis | 48.6 /100 | #177 | Average 46.6% |
| Chickasaw | 47.8 /100 | #178 | Average 46.6% |
| Immigrants | Oceania | 44.6 /100 | #179 | Average 46.5% |
| Costa Ricans | 43.7 /100 | #180 | Average 46.5% |
| Ottawa | 43.0 /100 | #181 | Average 46.5% |
| Potawatomi | 41.9 /100 | #182 | Average 46.5% |
| Immigrants | Northern Africa | 39.7 /100 | #183 | Fair 46.5% |
| Brazilians | 39.3 /100 | #184 | Fair 46.4% |
| Mongolians | 37.6 /100 | #185 | Fair 46.4% |
| Immigrants | Chile | 36.8 /100 | #186 | Fair 46.4% |