Yakama vs Macedonian Currently Married
COMPARE
Yakama
Macedonian
Currently Married
Currently Married Comparison
Yakama
Macedonians
44.0%
CURRENTLY MARRIED
0.2/ 100
METRIC RATING
255th/ 347
METRIC RANK
48.3%
CURRENTLY MARRIED
97.9/ 100
METRIC RATING
71st/ 347
METRIC RANK
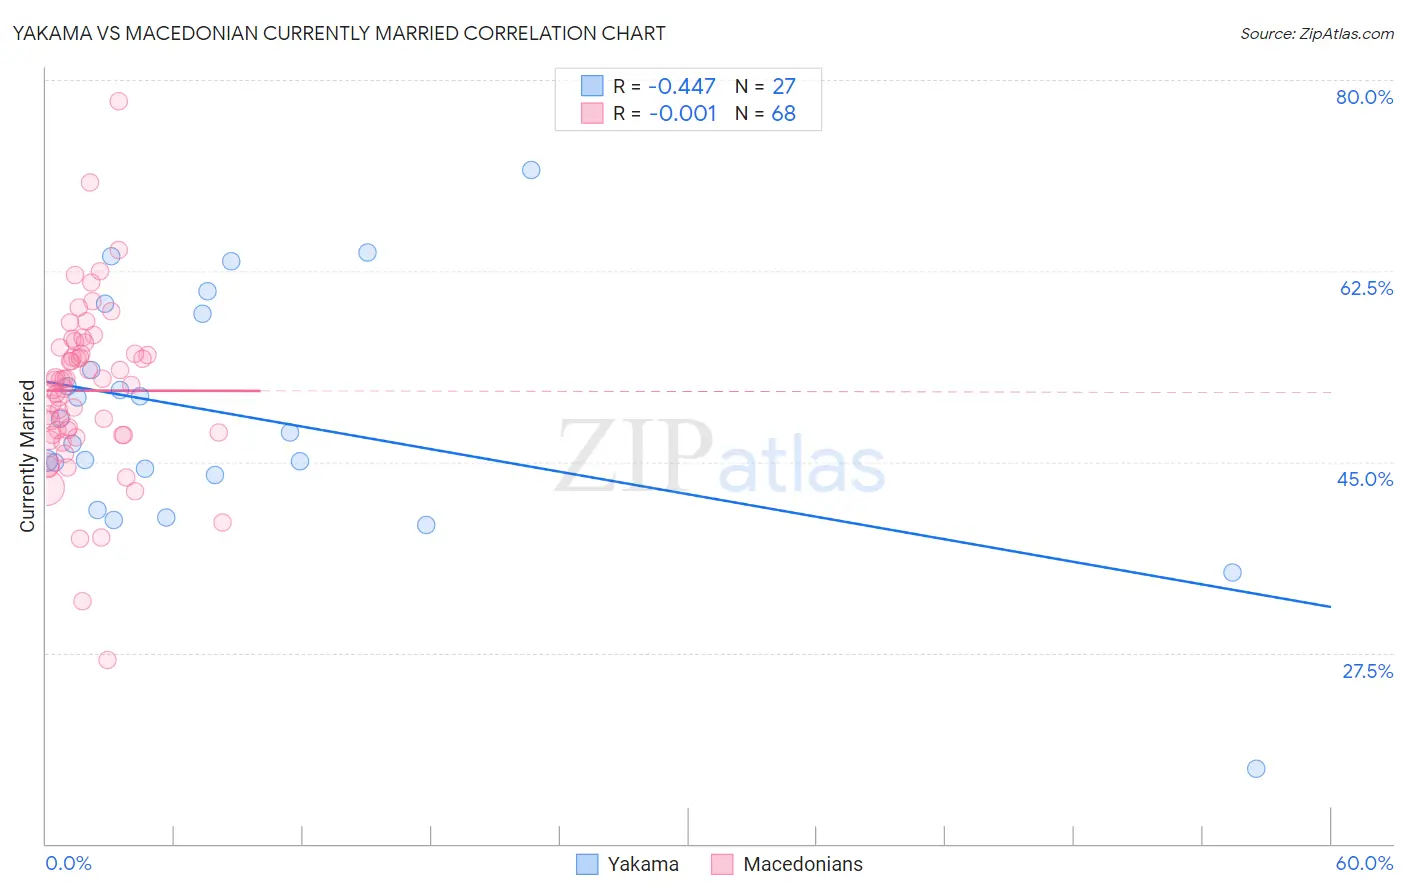
Yakama vs Macedonian Currently Married Correlation Chart
The statistical analysis conducted on geographies consisting of 19,923,144 people shows a moderate negative correlation between the proportion of Yakama and percentage of population currently married in the United States with a correlation coefficient (R) of -0.447 and weighted average of 44.0%. Similarly, the statistical analysis conducted on geographies consisting of 132,654,492 people shows no correlation between the proportion of Macedonians and percentage of population currently married in the United States with a correlation coefficient (R) of -0.001 and weighted average of 48.3%, a difference of 9.7%.
Currently Married Correlation Summary
| Measurement | Yakama | Macedonian |
| Minimum | 16.9% | 26.8% |
| Maximum | 71.8% | 78.0% |
| Range | 54.9% | 51.2% |
| Mean | 49.0% | 51.5% |
| Median | 47.7% | 52.3% |
| Interquartile 25% (IQ1) | 43.8% | 47.5% |
| Interquartile 75% (IQ3) | 58.6% | 55.2% |
| Interquartile Range (IQR) | 14.8% | 7.7% |
| Standard Deviation (Sample) | 11.2% | 7.9% |
| Standard Deviation (Population) | 11.0% | 7.8% |
Similar Demographics by Currently Married
Demographics Similar to Yakama by Currently Married
In terms of currently married, the demographic groups most similar to Yakama are Shoshone (44.0%, a difference of 0.050%), Vietnamese (44.0%, a difference of 0.070%), Immigrants from Africa (43.9%, a difference of 0.25%), Ute (43.9%, a difference of 0.26%), and Immigrants from Central America (44.1%, a difference of 0.32%).
| Demographics | Rating | Rank | Currently Married |
| Nicaraguans | 0.3 /100 | #248 | Tragic 44.2% |
| Immigrants | Cameroon | 0.3 /100 | #249 | Tragic 44.2% |
| Immigrants | Eastern Africa | 0.3 /100 | #250 | Tragic 44.2% |
| Blackfeet | 0.3 /100 | #251 | Tragic 44.2% |
| Hispanics or Latinos | 0.3 /100 | #252 | Tragic 44.1% |
| Immigrants | Central America | 0.3 /100 | #253 | Tragic 44.1% |
| Vietnamese | 0.2 /100 | #254 | Tragic 44.0% |
| Yakama | 0.2 /100 | #255 | Tragic 44.0% |
| Shoshone | 0.2 /100 | #256 | Tragic 44.0% |
| Immigrants | Africa | 0.2 /100 | #257 | Tragic 43.9% |
| Ute | 0.2 /100 | #258 | Tragic 43.9% |
| Immigrants | Sierra Leone | 0.1 /100 | #259 | Tragic 43.8% |
| Immigrants | Latin America | 0.1 /100 | #260 | Tragic 43.8% |
| Immigrants | Nicaragua | 0.1 /100 | #261 | Tragic 43.7% |
| Bangladeshis | 0.1 /100 | #262 | Tragic 43.7% |
Demographics Similar to Macedonians by Currently Married
In terms of currently married, the demographic groups most similar to Macedonians are Immigrants from Asia (48.3%, a difference of 0.010%), Canadian (48.3%, a difference of 0.090%), Immigrants from England (48.3%, a difference of 0.11%), Slovak (48.3%, a difference of 0.12%), and Tongan (48.3%, a difference of 0.13%).
| Demographics | Rating | Rank | Currently Married |
| Immigrants | Czechoslovakia | 98.3 /100 | #64 | Exceptional 48.4% |
| Ukrainians | 98.3 /100 | #65 | Exceptional 48.4% |
| Tongans | 98.2 /100 | #66 | Exceptional 48.3% |
| Slovaks | 98.2 /100 | #67 | Exceptional 48.3% |
| Immigrants | England | 98.2 /100 | #68 | Exceptional 48.3% |
| Canadians | 98.1 /100 | #69 | Exceptional 48.3% |
| Immigrants | Asia | 97.9 /100 | #70 | Exceptional 48.3% |
| Macedonians | 97.9 /100 | #71 | Exceptional 48.3% |
| Immigrants | Lebanon | 97.6 /100 | #72 | Exceptional 48.2% |
| Immigrants | Eastern Asia | 97.5 /100 | #73 | Exceptional 48.2% |
| Estonians | 97.4 /100 | #74 | Exceptional 48.2% |
| Immigrants | Belarus | 97.2 /100 | #75 | Exceptional 48.1% |
| Basques | 97.2 /100 | #76 | Exceptional 48.1% |
| Slovenes | 97.1 /100 | #77 | Exceptional 48.1% |
| Immigrants | Belgium | 97.1 /100 | #78 | Exceptional 48.1% |