Somali vs Immigrants from Oceania Currently Married
COMPARE
Somali
Immigrants from Oceania
Currently Married
Currently Married Comparison
Somalis
Immigrants from Oceania
41.5%
CURRENTLY MARRIED
0.0/ 100
METRIC RATING
312th/ 347
METRIC RANK
46.5%
CURRENTLY MARRIED
44.6/ 100
METRIC RATING
179th/ 347
METRIC RANK
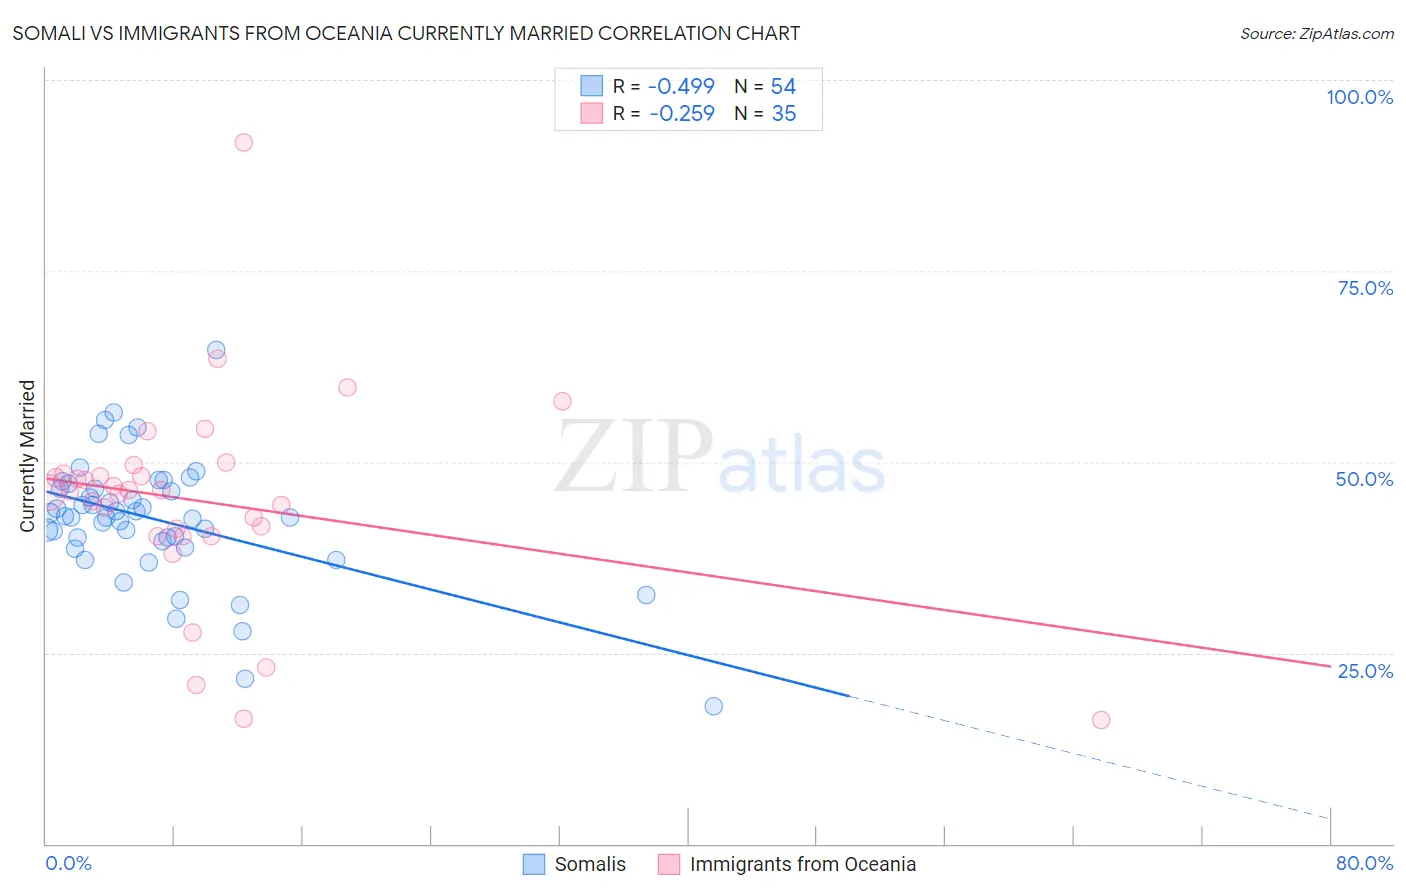
Somali vs Immigrants from Oceania Currently Married Correlation Chart
The statistical analysis conducted on geographies consisting of 99,327,030 people shows a moderate negative correlation between the proportion of Somalis and percentage of population currently married in the United States with a correlation coefficient (R) of -0.499 and weighted average of 41.5%. Similarly, the statistical analysis conducted on geographies consisting of 305,491,409 people shows a weak negative correlation between the proportion of Immigrants from Oceania and percentage of population currently married in the United States with a correlation coefficient (R) of -0.259 and weighted average of 46.5%, a difference of 12.2%.
Currently Married Correlation Summary
| Measurement | Somali | Immigrants from Oceania |
| Minimum | 18.0% | 16.2% |
| Maximum | 64.7% | 91.9% |
| Range | 46.7% | 75.7% |
| Mean | 42.5% | 44.8% |
| Median | 42.8% | 46.2% |
| Interquartile 25% (IQ1) | 39.7% | 40.3% |
| Interquartile 75% (IQ3) | 46.5% | 48.5% |
| Interquartile Range (IQR) | 6.8% | 8.2% |
| Standard Deviation (Sample) | 8.1% | 13.7% |
| Standard Deviation (Population) | 8.1% | 13.5% |
Similar Demographics by Currently Married
Demographics Similar to Somalis by Currently Married
In terms of currently married, the demographic groups most similar to Somalis are Trinidadian and Tobagonian (41.5%, a difference of 0.18%), Jamaican (41.4%, a difference of 0.29%), Guyanese (41.6%, a difference of 0.33%), West Indian (41.3%, a difference of 0.36%), and Inupiat (41.3%, a difference of 0.45%).
| Demographics | Rating | Rank | Currently Married |
| Immigrants | Trinidad and Tobago | 0.0 /100 | #305 | Tragic 41.9% |
| Immigrants | Guyana | 0.0 /100 | #306 | Tragic 41.9% |
| Africans | 0.0 /100 | #307 | Tragic 41.8% |
| Immigrants | Belize | 0.0 /100 | #308 | Tragic 41.8% |
| Immigrants | Liberia | 0.0 /100 | #309 | Tragic 41.8% |
| Guyanese | 0.0 /100 | #310 | Tragic 41.6% |
| Trinidadians and Tobagonians | 0.0 /100 | #311 | Tragic 41.5% |
| Somalis | 0.0 /100 | #312 | Tragic 41.5% |
| Jamaicans | 0.0 /100 | #313 | Tragic 41.4% |
| West Indians | 0.0 /100 | #314 | Tragic 41.3% |
| Inupiat | 0.0 /100 | #315 | Tragic 41.3% |
| Immigrants | Caribbean | 0.0 /100 | #316 | Tragic 41.3% |
| Haitians | 0.0 /100 | #317 | Tragic 41.3% |
| Bahamians | 0.0 /100 | #318 | Tragic 41.2% |
| Immigrants | Somalia | 0.0 /100 | #319 | Tragic 41.2% |
Demographics Similar to Immigrants from Oceania by Currently Married
In terms of currently married, the demographic groups most similar to Immigrants from Oceania are Costa Rican (46.5%, a difference of 0.030%), Ottawa (46.5%, a difference of 0.060%), Potawatomi (46.5%, a difference of 0.10%), Chickasaw (46.6%, a difference of 0.12%), and Hawaiian (46.6%, a difference of 0.15%).
| Demographics | Rating | Rank | Currently Married |
| Aleuts | 52.0 /100 | #172 | Average 46.7% |
| Tlingit-Haida | 51.2 /100 | #173 | Average 46.7% |
| Peruvians | 50.0 /100 | #174 | Average 46.6% |
| Immigrants | Brazil | 49.9 /100 | #175 | Average 46.6% |
| Hawaiians | 48.6 /100 | #176 | Average 46.6% |
| Israelis | 48.6 /100 | #177 | Average 46.6% |
| Chickasaw | 47.8 /100 | #178 | Average 46.6% |
| Immigrants | Oceania | 44.6 /100 | #179 | Average 46.5% |
| Costa Ricans | 43.7 /100 | #180 | Average 46.5% |
| Ottawa | 43.0 /100 | #181 | Average 46.5% |
| Potawatomi | 41.9 /100 | #182 | Average 46.5% |
| Immigrants | Northern Africa | 39.7 /100 | #183 | Fair 46.5% |
| Brazilians | 39.3 /100 | #184 | Fair 46.4% |
| Mongolians | 37.6 /100 | #185 | Fair 46.4% |
| Immigrants | Chile | 36.8 /100 | #186 | Fair 46.4% |