Yakama vs Immigrants from Oceania Child Poverty Among Boys Under 16
COMPARE
Yakama
Immigrants from Oceania
Child Poverty Among Boys Under 16
Child Poverty Among Boys Under 16 Comparison
Yakama
Immigrants from Oceania
21.7%
CHILD POVERTY AMONG BOYS UNDER 16
0.0/ 100
METRIC RATING
318th/ 347
METRIC RANK
16.0%
CHILD POVERTY AMONG BOYS UNDER 16
71.3/ 100
METRIC RATING
161st/ 347
METRIC RANK
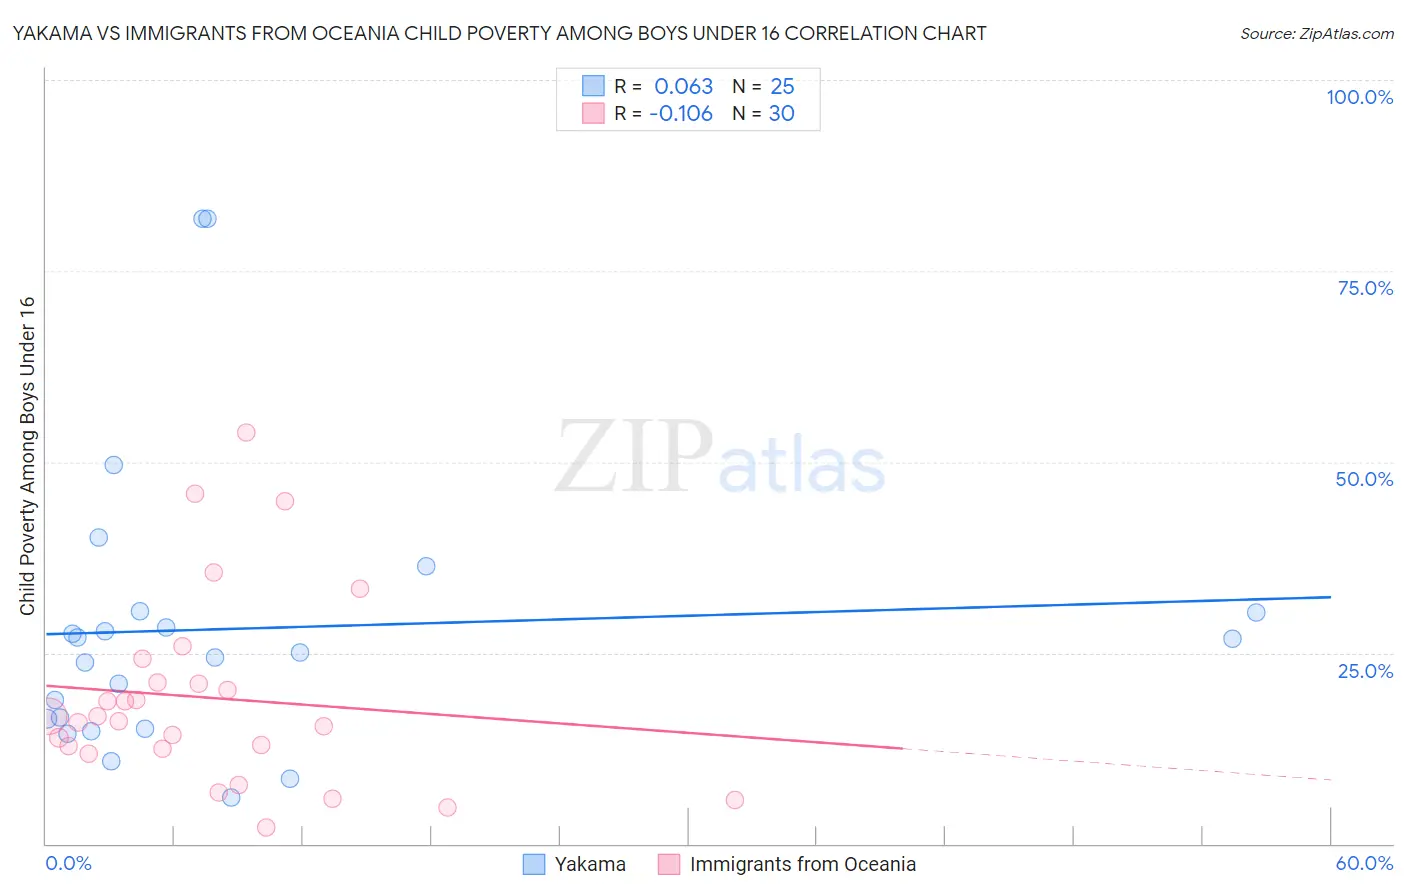
Yakama vs Immigrants from Oceania Child Poverty Among Boys Under 16 Correlation Chart
The statistical analysis conducted on geographies consisting of 19,821,804 people shows a slight positive correlation between the proportion of Yakama and poverty level among boys under the age of 16 in the United States with a correlation coefficient (R) of 0.063 and weighted average of 21.7%. Similarly, the statistical analysis conducted on geographies consisting of 301,361,436 people shows a poor negative correlation between the proportion of Immigrants from Oceania and poverty level among boys under the age of 16 in the United States with a correlation coefficient (R) of -0.106 and weighted average of 16.0%, a difference of 35.7%.
Child Poverty Among Boys Under 16 Correlation Summary
| Measurement | Yakama | Immigrants from Oceania |
| Minimum | 6.1% | 2.1% |
| Maximum | 81.8% | 53.8% |
| Range | 75.8% | 51.7% |
| Mean | 28.1% | 19.1% |
| Median | 25.0% | 16.3% |
| Interquartile 25% (IQ1) | 15.7% | 12.4% |
| Interquartile 75% (IQ3) | 30.4% | 21.2% |
| Interquartile Range (IQR) | 14.7% | 8.8% |
| Standard Deviation (Sample) | 18.9% | 12.5% |
| Standard Deviation (Population) | 18.6% | 12.3% |
Similar Demographics by Child Poverty Among Boys Under 16
Demographics Similar to Yakama by Child Poverty Among Boys Under 16
In terms of child poverty among boys under 16, the demographic groups most similar to Yakama are African (21.7%, a difference of 0.060%), Immigrants from Somalia (21.7%, a difference of 0.14%), Menominee (21.7%, a difference of 0.14%), Dutch West Indian (21.8%, a difference of 0.48%), and Ute (21.6%, a difference of 0.74%).
| Demographics | Rating | Rank | Child Poverty Among Boys Under 16 |
| Bahamians | 0.0 /100 | #311 | Tragic 21.6% |
| Immigrants | Guatemala | 0.0 /100 | #312 | Tragic 21.6% |
| British West Indians | 0.0 /100 | #313 | Tragic 21.6% |
| Ute | 0.0 /100 | #314 | Tragic 21.6% |
| Immigrants | Somalia | 0.0 /100 | #315 | Tragic 21.7% |
| Menominee | 0.0 /100 | #316 | Tragic 21.7% |
| Africans | 0.0 /100 | #317 | Tragic 21.7% |
| Yakama | 0.0 /100 | #318 | Tragic 21.7% |
| Dutch West Indians | 0.0 /100 | #319 | Tragic 21.8% |
| U.S. Virgin Islanders | 0.0 /100 | #320 | Tragic 22.0% |
| Cajuns | 0.0 /100 | #321 | Tragic 22.2% |
| Immigrants | Dominica | 0.0 /100 | #322 | Tragic 22.2% |
| Hondurans | 0.0 /100 | #323 | Tragic 22.3% |
| Immigrants | Congo | 0.0 /100 | #324 | Tragic 22.4% |
| Central American Indians | 0.0 /100 | #325 | Tragic 22.5% |
Demographics Similar to Immigrants from Oceania by Child Poverty Among Boys Under 16
In terms of child poverty among boys under 16, the demographic groups most similar to Immigrants from Oceania are Immigrants from Northern Africa (16.0%, a difference of 0.010%), Guamanian/Chamorro (16.1%, a difference of 0.23%), Costa Rican (16.1%, a difference of 0.43%), Immigrants from Albania (16.1%, a difference of 0.45%), and Immigrants from Chile (15.9%, a difference of 0.52%).
| Demographics | Rating | Rank | Child Poverty Among Boys Under 16 |
| Syrians | 77.5 /100 | #154 | Good 15.9% |
| French Canadians | 76.6 /100 | #155 | Good 15.9% |
| Israelis | 76.5 /100 | #156 | Good 15.9% |
| Immigrants | Nepal | 76.0 /100 | #157 | Good 15.9% |
| Yugoslavians | 75.9 /100 | #158 | Good 15.9% |
| Immigrants | Chile | 74.8 /100 | #159 | Good 15.9% |
| Immigrants | Northern Africa | 71.3 /100 | #160 | Good 16.0% |
| Immigrants | Oceania | 71.3 /100 | #161 | Good 16.0% |
| Guamanians/Chamorros | 69.6 /100 | #162 | Good 16.1% |
| Costa Ricans | 68.1 /100 | #163 | Good 16.1% |
| Immigrants | Albania | 67.9 /100 | #164 | Good 16.1% |
| Colombians | 65.2 /100 | #165 | Good 16.1% |
| Immigrants | Germany | 63.6 /100 | #166 | Good 16.2% |
| Afghans | 55.4 /100 | #167 | Average 16.3% |
| South Americans | 55.3 /100 | #168 | Average 16.3% |