Nigerian vs Immigrants from Oceania Currently Married
COMPARE
Nigerian
Immigrants from Oceania
Currently Married
Currently Married Comparison
Nigerians
Immigrants from Oceania
43.4%
CURRENTLY MARRIED
0.1/ 100
METRIC RATING
274th/ 347
METRIC RANK
46.5%
CURRENTLY MARRIED
44.6/ 100
METRIC RATING
179th/ 347
METRIC RANK
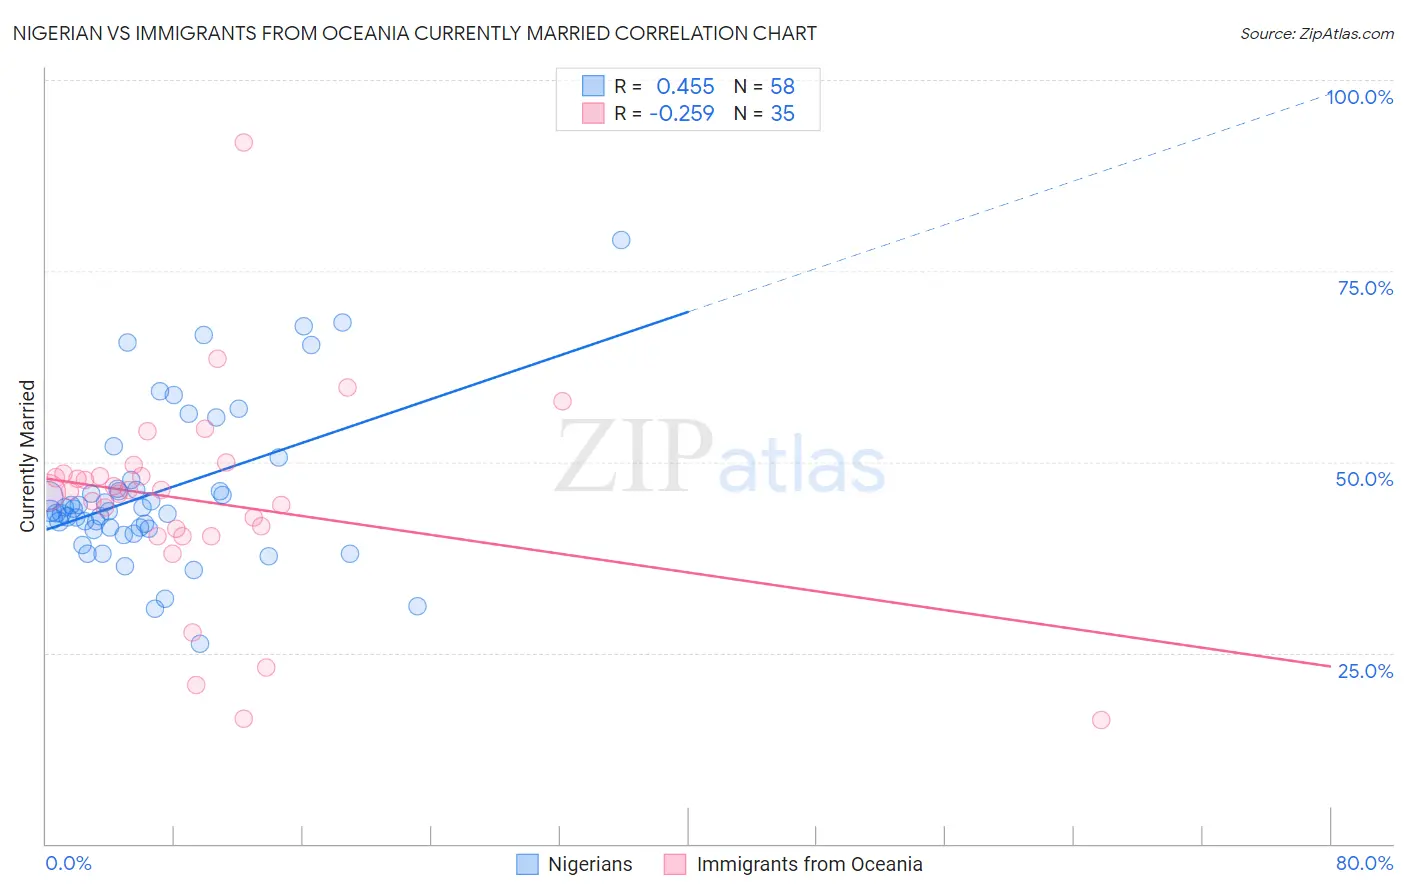
Nigerian vs Immigrants from Oceania Currently Married Correlation Chart
The statistical analysis conducted on geographies consisting of 332,730,636 people shows a moderate positive correlation between the proportion of Nigerians and percentage of population currently married in the United States with a correlation coefficient (R) of 0.455 and weighted average of 43.4%. Similarly, the statistical analysis conducted on geographies consisting of 305,491,409 people shows a weak negative correlation between the proportion of Immigrants from Oceania and percentage of population currently married in the United States with a correlation coefficient (R) of -0.259 and weighted average of 46.5%, a difference of 7.1%.
Currently Married Correlation Summary
| Measurement | Nigerian | Immigrants from Oceania |
| Minimum | 26.3% | 16.2% |
| Maximum | 79.1% | 91.9% |
| Range | 52.8% | 75.7% |
| Mean | 46.0% | 44.8% |
| Median | 43.6% | 46.2% |
| Interquartile 25% (IQ1) | 41.3% | 40.3% |
| Interquartile 75% (IQ3) | 46.5% | 48.5% |
| Interquartile Range (IQR) | 5.2% | 8.2% |
| Standard Deviation (Sample) | 10.1% | 13.7% |
| Standard Deviation (Population) | 10.0% | 13.5% |
Similar Demographics by Currently Married
Demographics Similar to Nigerians by Currently Married
In terms of currently married, the demographic groups most similar to Nigerians are Yaqui (43.4%, a difference of 0.020%), Colville (43.4%, a difference of 0.020%), Sierra Leonean (43.4%, a difference of 0.050%), Indonesian (43.5%, a difference of 0.060%), and Immigrants from Nigeria (43.4%, a difference of 0.060%).
| Demographics | Rating | Rank | Currently Married |
| Immigrants | Eritrea | 0.1 /100 | #267 | Tragic 43.6% |
| Spanish American Indians | 0.1 /100 | #268 | Tragic 43.6% |
| Immigrants | Sudan | 0.1 /100 | #269 | Tragic 43.5% |
| Salvadorans | 0.1 /100 | #270 | Tragic 43.5% |
| Bermudans | 0.1 /100 | #271 | Tragic 43.5% |
| Indonesians | 0.1 /100 | #272 | Tragic 43.5% |
| Yaqui | 0.1 /100 | #273 | Tragic 43.4% |
| Nigerians | 0.1 /100 | #274 | Tragic 43.4% |
| Colville | 0.1 /100 | #275 | Tragic 43.4% |
| Sierra Leoneans | 0.1 /100 | #276 | Tragic 43.4% |
| Immigrants | Nigeria | 0.1 /100 | #277 | Tragic 43.4% |
| Central Americans | 0.0 /100 | #278 | Tragic 43.3% |
| Central American Indians | 0.0 /100 | #279 | Tragic 43.3% |
| Apache | 0.0 /100 | #280 | Tragic 43.2% |
| Chippewa | 0.0 /100 | #281 | Tragic 43.2% |
Demographics Similar to Immigrants from Oceania by Currently Married
In terms of currently married, the demographic groups most similar to Immigrants from Oceania are Costa Rican (46.5%, a difference of 0.030%), Ottawa (46.5%, a difference of 0.060%), Potawatomi (46.5%, a difference of 0.10%), Chickasaw (46.6%, a difference of 0.12%), and Hawaiian (46.6%, a difference of 0.15%).
| Demographics | Rating | Rank | Currently Married |
| Aleuts | 52.0 /100 | #172 | Average 46.7% |
| Tlingit-Haida | 51.2 /100 | #173 | Average 46.7% |
| Peruvians | 50.0 /100 | #174 | Average 46.6% |
| Immigrants | Brazil | 49.9 /100 | #175 | Average 46.6% |
| Hawaiians | 48.6 /100 | #176 | Average 46.6% |
| Israelis | 48.6 /100 | #177 | Average 46.6% |
| Chickasaw | 47.8 /100 | #178 | Average 46.6% |
| Immigrants | Oceania | 44.6 /100 | #179 | Average 46.5% |
| Costa Ricans | 43.7 /100 | #180 | Average 46.5% |
| Ottawa | 43.0 /100 | #181 | Average 46.5% |
| Potawatomi | 41.9 /100 | #182 | Average 46.5% |
| Immigrants | Northern Africa | 39.7 /100 | #183 | Fair 46.5% |
| Brazilians | 39.3 /100 | #184 | Fair 46.4% |
| Mongolians | 37.6 /100 | #185 | Fair 46.4% |
| Immigrants | Chile | 36.8 /100 | #186 | Fair 46.4% |