Yakama vs Immigrants from China Currently Married
COMPARE
Yakama
Immigrants from China
Currently Married
Currently Married Comparison
Yakama
Immigrants from China
44.0%
CURRENTLY MARRIED
0.2/ 100
METRIC RATING
255th/ 347
METRIC RANK
47.9%
CURRENTLY MARRIED
94.7/ 100
METRIC RATING
98th/ 347
METRIC RANK
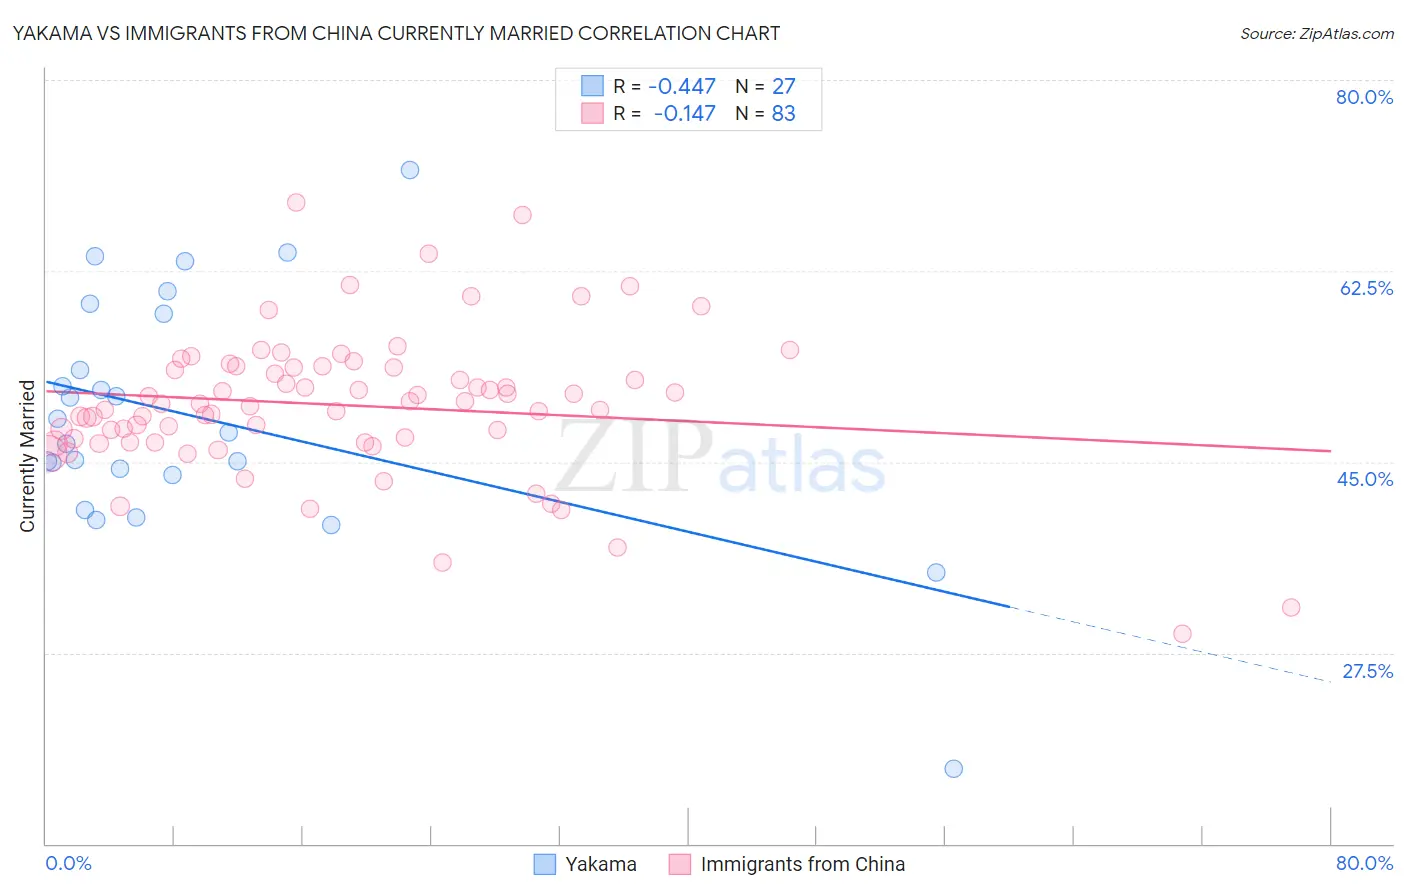
Yakama vs Immigrants from China Currently Married Correlation Chart
The statistical analysis conducted on geographies consisting of 19,923,144 people shows a moderate negative correlation between the proportion of Yakama and percentage of population currently married in the United States with a correlation coefficient (R) of -0.447 and weighted average of 44.0%. Similarly, the statistical analysis conducted on geographies consisting of 456,988,820 people shows a poor negative correlation between the proportion of Immigrants from China and percentage of population currently married in the United States with a correlation coefficient (R) of -0.147 and weighted average of 47.9%, a difference of 8.8%.
Currently Married Correlation Summary
| Measurement | Yakama | Immigrants from China |
| Minimum | 16.9% | 29.3% |
| Maximum | 71.8% | 68.8% |
| Range | 54.9% | 39.5% |
| Mean | 49.0% | 50.2% |
| Median | 47.7% | 50.3% |
| Interquartile 25% (IQ1) | 43.8% | 46.8% |
| Interquartile 75% (IQ3) | 58.6% | 53.7% |
| Interquartile Range (IQR) | 14.8% | 6.9% |
| Standard Deviation (Sample) | 11.2% | 6.6% |
| Standard Deviation (Population) | 11.0% | 6.6% |
Similar Demographics by Currently Married
Demographics Similar to Yakama by Currently Married
In terms of currently married, the demographic groups most similar to Yakama are Shoshone (44.0%, a difference of 0.050%), Vietnamese (44.0%, a difference of 0.070%), Immigrants from Africa (43.9%, a difference of 0.25%), Ute (43.9%, a difference of 0.26%), and Immigrants from Central America (44.1%, a difference of 0.32%).
| Demographics | Rating | Rank | Currently Married |
| Nicaraguans | 0.3 /100 | #248 | Tragic 44.2% |
| Immigrants | Cameroon | 0.3 /100 | #249 | Tragic 44.2% |
| Immigrants | Eastern Africa | 0.3 /100 | #250 | Tragic 44.2% |
| Blackfeet | 0.3 /100 | #251 | Tragic 44.2% |
| Hispanics or Latinos | 0.3 /100 | #252 | Tragic 44.1% |
| Immigrants | Central America | 0.3 /100 | #253 | Tragic 44.1% |
| Vietnamese | 0.2 /100 | #254 | Tragic 44.0% |
| Yakama | 0.2 /100 | #255 | Tragic 44.0% |
| Shoshone | 0.2 /100 | #256 | Tragic 44.0% |
| Immigrants | Africa | 0.2 /100 | #257 | Tragic 43.9% |
| Ute | 0.2 /100 | #258 | Tragic 43.9% |
| Immigrants | Sierra Leone | 0.1 /100 | #259 | Tragic 43.8% |
| Immigrants | Latin America | 0.1 /100 | #260 | Tragic 43.8% |
| Immigrants | Nicaragua | 0.1 /100 | #261 | Tragic 43.7% |
| Bangladeshis | 0.1 /100 | #262 | Tragic 43.7% |
Demographics Similar to Immigrants from China by Currently Married
In terms of currently married, the demographic groups most similar to Immigrants from China are Immigrants from Bulgaria (47.9%, a difference of 0.020%), Egyptian (47.9%, a difference of 0.020%), Immigrants from Ukraine (47.9%, a difference of 0.020%), Native Hawaiian (47.9%, a difference of 0.060%), and Lebanese (47.9%, a difference of 0.070%).
| Demographics | Rating | Rank | Currently Married |
| Immigrants | Bolivia | 95.6 /100 | #91 | Exceptional 47.9% |
| Koreans | 95.4 /100 | #92 | Exceptional 47.9% |
| Lebanese | 95.1 /100 | #93 | Exceptional 47.9% |
| Native Hawaiians | 95.0 /100 | #94 | Exceptional 47.9% |
| Immigrants | Bulgaria | 94.8 /100 | #95 | Exceptional 47.9% |
| Egyptians | 94.8 /100 | #96 | Exceptional 47.9% |
| Immigrants | Ukraine | 94.8 /100 | #97 | Exceptional 47.9% |
| Immigrants | China | 94.7 /100 | #98 | Exceptional 47.9% |
| Immigrants | Sweden | 94.3 /100 | #99 | Exceptional 47.8% |
| Celtics | 94.2 /100 | #100 | Exceptional 47.8% |
| Immigrants | Germany | 94.1 /100 | #101 | Exceptional 47.8% |
| Turks | 93.9 /100 | #102 | Exceptional 47.8% |
| Cypriots | 93.7 /100 | #103 | Exceptional 47.8% |
| Serbians | 93.6 /100 | #104 | Exceptional 47.8% |
| Immigrants | Singapore | 93.3 /100 | #105 | Exceptional 47.8% |