Immigrants from Saudi Arabia vs Yugoslavian Births to Unmarried Women
COMPARE
Immigrants from Saudi Arabia
Yugoslavian
Births to Unmarried Women
Births to Unmarried Women Comparison
Immigrants from Saudi Arabia
Yugoslavians
29.1%
BIRTHS TO UNMARRIED WOMEN
97.0/ 100
METRIC RATING
89th/ 347
METRIC RANK
30.8%
BIRTHS TO UNMARRIED WOMEN
75.1/ 100
METRIC RATING
154th/ 347
METRIC RANK
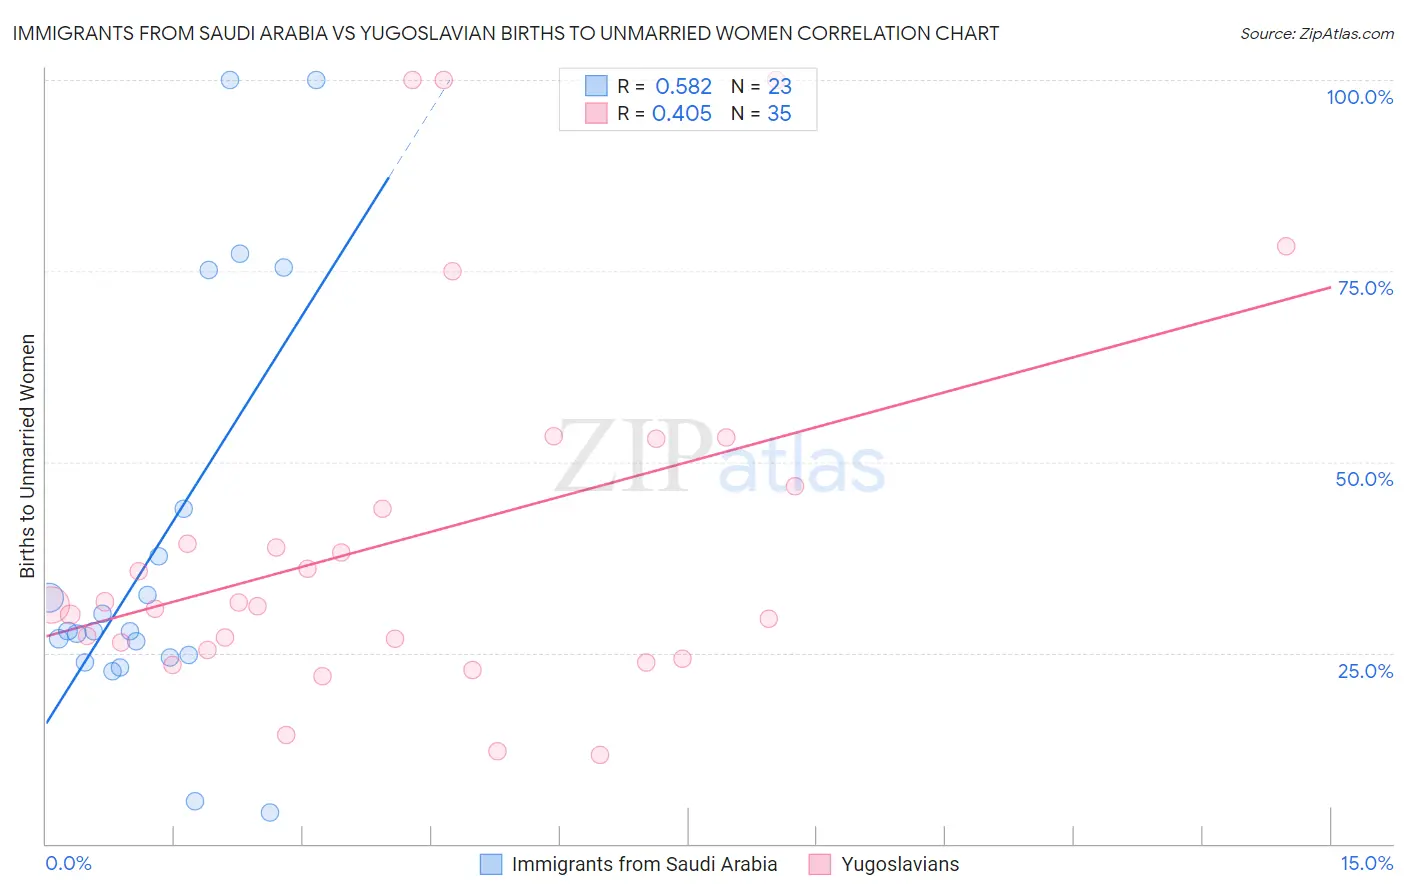
Immigrants from Saudi Arabia vs Yugoslavian Births to Unmarried Women Correlation Chart
The statistical analysis conducted on geographies consisting of 158,618,627 people shows a substantial positive correlation between the proportion of Immigrants from Saudi Arabia and percentage of births to unmarried women in the United States with a correlation coefficient (R) of 0.582 and weighted average of 29.1%. Similarly, the statistical analysis conducted on geographies consisting of 270,567,772 people shows a moderate positive correlation between the proportion of Yugoslavians and percentage of births to unmarried women in the United States with a correlation coefficient (R) of 0.405 and weighted average of 30.8%, a difference of 6.1%.
Births to Unmarried Women Correlation Summary
| Measurement | Immigrants from Saudi Arabia | Yugoslavian |
| Minimum | 4.0% | 11.7% |
| Maximum | 100.0% | 100.0% |
| Range | 96.0% | 88.3% |
| Mean | 39.0% | 39.8% |
| Median | 27.8% | 31.3% |
| Interquartile 25% (IQ1) | 24.4% | 25.4% |
| Interquartile 75% (IQ3) | 43.8% | 46.8% |
| Interquartile Range (IQR) | 19.4% | 21.4% |
| Standard Deviation (Sample) | 27.0% | 23.8% |
| Standard Deviation (Population) | 26.4% | 23.5% |
Similar Demographics by Births to Unmarried Women
Demographics Similar to Immigrants from Saudi Arabia by Births to Unmarried Women
In terms of births to unmarried women, the demographic groups most similar to Immigrants from Saudi Arabia are Immigrants from Latvia (29.1%, a difference of 0.16%), Taiwanese (29.0%, a difference of 0.28%), Immigrants from France (29.0%, a difference of 0.28%), Immigrants from Jordan (29.0%, a difference of 0.36%), and Immigrants from Fiji (29.2%, a difference of 0.37%).
| Demographics | Rating | Rank | Births to Unmarried Women |
| Romanians | 98.0 /100 | #82 | Exceptional 28.7% |
| Immigrants | Kuwait | 98.0 /100 | #83 | Exceptional 28.8% |
| Immigrants | Poland | 97.6 /100 | #84 | Exceptional 28.9% |
| Sri Lankans | 97.5 /100 | #85 | Exceptional 28.9% |
| Immigrants | Jordan | 97.4 /100 | #86 | Exceptional 29.0% |
| Taiwanese | 97.3 /100 | #87 | Exceptional 29.0% |
| Immigrants | France | 97.3 /100 | #88 | Exceptional 29.0% |
| Immigrants | Saudi Arabia | 97.0 /100 | #89 | Exceptional 29.1% |
| Immigrants | Latvia | 96.8 /100 | #90 | Exceptional 29.1% |
| Immigrants | Fiji | 96.6 /100 | #91 | Exceptional 29.2% |
| Arabs | 96.5 /100 | #92 | Exceptional 29.2% |
| Estonians | 96.5 /100 | #93 | Exceptional 29.2% |
| Ukrainians | 96.3 /100 | #94 | Exceptional 29.2% |
| Immigrants | Vietnam | 96.1 /100 | #95 | Exceptional 29.3% |
| Norwegians | 95.8 /100 | #96 | Exceptional 29.3% |
Demographics Similar to Yugoslavians by Births to Unmarried Women
In terms of births to unmarried women, the demographic groups most similar to Yugoslavians are British (30.8%, a difference of 0.12%), Polish (30.8%, a difference of 0.14%), Immigrants from Bangladesh (30.9%, a difference of 0.15%), Carpatho Rusyn (30.9%, a difference of 0.20%), and Italian (30.8%, a difference of 0.25%).
| Demographics | Rating | Rank | Births to Unmarried Women |
| Immigrants | Oceania | 81.2 /100 | #147 | Excellent 30.6% |
| Chileans | 79.1 /100 | #148 | Good 30.7% |
| Serbians | 78.8 /100 | #149 | Good 30.7% |
| Somalis | 77.8 /100 | #150 | Good 30.7% |
| Italians | 77.0 /100 | #151 | Good 30.8% |
| Poles | 76.2 /100 | #152 | Good 30.8% |
| British | 76.0 /100 | #153 | Good 30.8% |
| Yugoslavians | 75.1 /100 | #154 | Good 30.8% |
| Immigrants | Bangladesh | 73.9 /100 | #155 | Good 30.9% |
| Carpatho Rusyns | 73.5 /100 | #156 | Good 30.9% |
| Immigrants | Eastern Africa | 72.1 /100 | #157 | Good 31.0% |
| Austrians | 69.9 /100 | #158 | Good 31.0% |
| Immigrants | England | 69.4 /100 | #159 | Good 31.1% |
| Immigrants | Western Europe | 69.3 /100 | #160 | Good 31.1% |
| Immigrants | Southern Europe | 68.7 /100 | #161 | Good 31.1% |