Immigrants from Cuba vs Yugoslavian Births to Unmarried Women
COMPARE
Immigrants from Cuba
Yugoslavian
Births to Unmarried Women
Births to Unmarried Women Comparison
Immigrants from Cuba
Yugoslavians
41.5%
BIRTHS TO UNMARRIED WOMEN
0.0/ 100
METRIC RATING
326th/ 347
METRIC RANK
30.8%
BIRTHS TO UNMARRIED WOMEN
75.1/ 100
METRIC RATING
154th/ 347
METRIC RANK
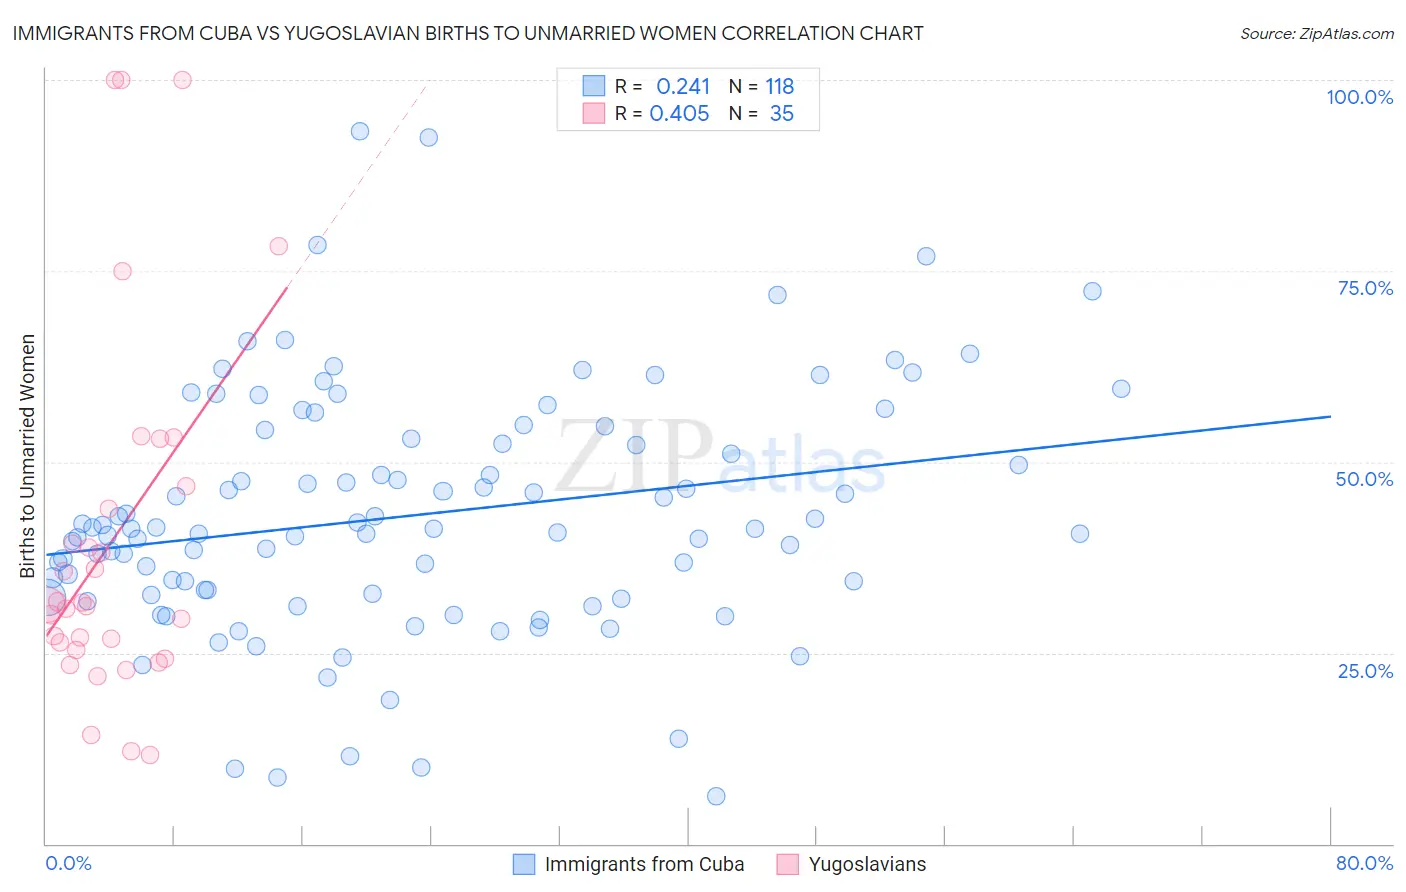
Immigrants from Cuba vs Yugoslavian Births to Unmarried Women Correlation Chart
The statistical analysis conducted on geographies consisting of 308,833,039 people shows a weak positive correlation between the proportion of Immigrants from Cuba and percentage of births to unmarried women in the United States with a correlation coefficient (R) of 0.241 and weighted average of 41.5%. Similarly, the statistical analysis conducted on geographies consisting of 270,567,772 people shows a moderate positive correlation between the proportion of Yugoslavians and percentage of births to unmarried women in the United States with a correlation coefficient (R) of 0.405 and weighted average of 30.8%, a difference of 34.4%.
Births to Unmarried Women Correlation Summary
| Measurement | Immigrants from Cuba | Yugoslavian |
| Minimum | 6.3% | 11.7% |
| Maximum | 93.3% | 100.0% |
| Range | 87.0% | 88.3% |
| Mean | 43.0% | 39.8% |
| Median | 41.2% | 31.3% |
| Interquartile 25% (IQ1) | 32.8% | 25.4% |
| Interquartile 75% (IQ3) | 53.1% | 46.8% |
| Interquartile Range (IQR) | 20.3% | 21.4% |
| Standard Deviation (Sample) | 15.9% | 23.8% |
| Standard Deviation (Population) | 15.8% | 23.5% |
Similar Demographics by Births to Unmarried Women
Demographics Similar to Immigrants from Cuba by Births to Unmarried Women
In terms of births to unmarried women, the demographic groups most similar to Immigrants from Cuba are Cheyenne (41.3%, a difference of 0.27%), Cape Verdean (41.3%, a difference of 0.33%), Sioux (41.0%, a difference of 1.1%), Cajun (41.0%, a difference of 1.2%), and Tsimshian (42.2%, a difference of 1.7%).
| Demographics | Rating | Rank | Births to Unmarried Women |
| Yakama | 0.0 /100 | #319 | Tragic 40.3% |
| Crow | 0.0 /100 | #320 | Tragic 40.4% |
| Bahamians | 0.0 /100 | #321 | Tragic 40.8% |
| Cajuns | 0.0 /100 | #322 | Tragic 41.0% |
| Sioux | 0.0 /100 | #323 | Tragic 41.0% |
| Cape Verdeans | 0.0 /100 | #324 | Tragic 41.3% |
| Cheyenne | 0.0 /100 | #325 | Tragic 41.3% |
| Immigrants | Cuba | 0.0 /100 | #326 | Tragic 41.5% |
| Tsimshian | 0.0 /100 | #327 | Tragic 42.2% |
| Immigrants | Cabo Verde | 0.0 /100 | #328 | Tragic 42.2% |
| Paiute | 0.0 /100 | #329 | Tragic 42.5% |
| Chippewa | 0.0 /100 | #330 | Tragic 42.6% |
| Natives/Alaskans | 0.0 /100 | #331 | Tragic 43.0% |
| Kiowa | 0.0 /100 | #332 | Tragic 43.1% |
| Blacks/African Americans | 0.0 /100 | #333 | Tragic 44.3% |
Demographics Similar to Yugoslavians by Births to Unmarried Women
In terms of births to unmarried women, the demographic groups most similar to Yugoslavians are British (30.8%, a difference of 0.12%), Polish (30.8%, a difference of 0.14%), Immigrants from Bangladesh (30.9%, a difference of 0.15%), Carpatho Rusyn (30.9%, a difference of 0.20%), and Italian (30.8%, a difference of 0.25%).
| Demographics | Rating | Rank | Births to Unmarried Women |
| Immigrants | Oceania | 81.2 /100 | #147 | Excellent 30.6% |
| Chileans | 79.1 /100 | #148 | Good 30.7% |
| Serbians | 78.8 /100 | #149 | Good 30.7% |
| Somalis | 77.8 /100 | #150 | Good 30.7% |
| Italians | 77.0 /100 | #151 | Good 30.8% |
| Poles | 76.2 /100 | #152 | Good 30.8% |
| British | 76.0 /100 | #153 | Good 30.8% |
| Yugoslavians | 75.1 /100 | #154 | Good 30.8% |
| Immigrants | Bangladesh | 73.9 /100 | #155 | Good 30.9% |
| Carpatho Rusyns | 73.5 /100 | #156 | Good 30.9% |
| Immigrants | Eastern Africa | 72.1 /100 | #157 | Good 31.0% |
| Austrians | 69.9 /100 | #158 | Good 31.0% |
| Immigrants | England | 69.4 /100 | #159 | Good 31.1% |
| Immigrants | Western Europe | 69.3 /100 | #160 | Good 31.1% |
| Immigrants | Southern Europe | 68.7 /100 | #161 | Good 31.1% |