Immigrants from Eritrea vs Yugoslavian Births to Unmarried Women
COMPARE
Immigrants from Eritrea
Yugoslavian
Births to Unmarried Women
Births to Unmarried Women Comparison
Immigrants from Eritrea
Yugoslavians
31.7%
BIRTHS TO UNMARRIED WOMEN
50.4/ 100
METRIC RATING
172nd/ 347
METRIC RANK
30.8%
BIRTHS TO UNMARRIED WOMEN
75.1/ 100
METRIC RATING
154th/ 347
METRIC RANK
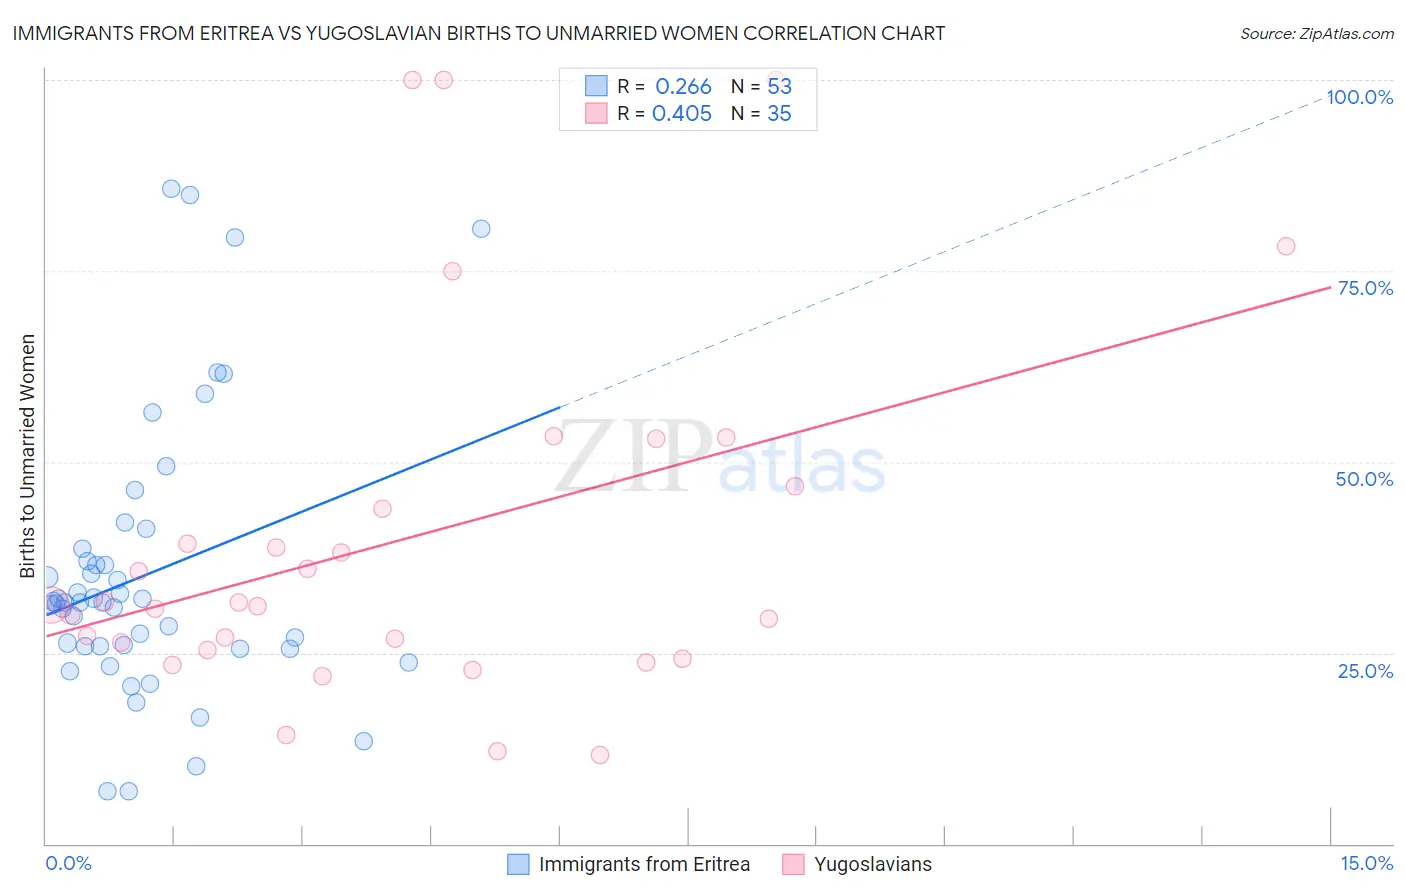
Immigrants from Eritrea vs Yugoslavian Births to Unmarried Women Correlation Chart
The statistical analysis conducted on geographies consisting of 103,370,880 people shows a weak positive correlation between the proportion of Immigrants from Eritrea and percentage of births to unmarried women in the United States with a correlation coefficient (R) of 0.266 and weighted average of 31.7%. Similarly, the statistical analysis conducted on geographies consisting of 270,567,772 people shows a moderate positive correlation between the proportion of Yugoslavians and percentage of births to unmarried women in the United States with a correlation coefficient (R) of 0.405 and weighted average of 30.8%, a difference of 2.6%.
Births to Unmarried Women Correlation Summary
| Measurement | Immigrants from Eritrea | Yugoslavian |
| Minimum | 6.8% | 11.7% |
| Maximum | 85.7% | 100.0% |
| Range | 78.9% | 88.3% |
| Mean | 35.2% | 39.8% |
| Median | 31.6% | 31.3% |
| Interquartile 25% (IQ1) | 25.8% | 25.4% |
| Interquartile 75% (IQ3) | 37.8% | 46.8% |
| Interquartile Range (IQR) | 12.0% | 21.4% |
| Standard Deviation (Sample) | 18.1% | 23.8% |
| Standard Deviation (Population) | 17.9% | 23.5% |
Demographics Similar to Immigrants from Eritrea and Yugoslavians by Births to Unmarried Women
In terms of births to unmarried women, the demographic groups most similar to Immigrants from Eritrea are Finnish (31.7%, a difference of 0.010%), Immigrants from Yemen (31.7%, a difference of 0.020%), Guamanian/Chamorro (31.6%, a difference of 0.090%), Slavic (31.6%, a difference of 0.15%), and Belgian (31.6%, a difference of 0.19%). Similarly, the demographic groups most similar to Yugoslavians are British (30.8%, a difference of 0.12%), Immigrants from Bangladesh (30.9%, a difference of 0.15%), Carpatho Rusyn (30.9%, a difference of 0.20%), Immigrants from Eastern Africa (31.0%, a difference of 0.38%), and Austrian (31.0%, a difference of 0.64%).
| Demographics | Rating | Rank | Births to Unmarried Women |
| British | 76.0 /100 | #153 | Good 30.8% |
| Yugoslavians | 75.1 /100 | #154 | Good 30.8% |
| Immigrants | Bangladesh | 73.9 /100 | #155 | Good 30.9% |
| Carpatho Rusyns | 73.5 /100 | #156 | Good 30.9% |
| Immigrants | Eastern Africa | 72.1 /100 | #157 | Good 31.0% |
| Austrians | 69.9 /100 | #158 | Good 31.0% |
| Immigrants | England | 69.4 /100 | #159 | Good 31.1% |
| Immigrants | Western Europe | 69.3 /100 | #160 | Good 31.1% |
| Immigrants | Southern Europe | 68.7 /100 | #161 | Good 31.1% |
| Slovenes | 65.9 /100 | #162 | Good 31.2% |
| Immigrants | Chile | 65.7 /100 | #163 | Good 31.2% |
| Hungarians | 64.1 /100 | #164 | Good 31.2% |
| Immigrants | Somalia | 58.1 /100 | #165 | Average 31.4% |
| Peruvians | 55.5 /100 | #166 | Average 31.5% |
| Dutch | 55.3 /100 | #167 | Average 31.5% |
| Belgians | 52.4 /100 | #168 | Average 31.6% |
| Slavs | 52.0 /100 | #169 | Average 31.6% |
| Guamanians/Chamorros | 51.3 /100 | #170 | Average 31.6% |
| Finns | 50.5 /100 | #171 | Average 31.7% |
| Immigrants | Eritrea | 50.4 /100 | #172 | Average 31.7% |
| Immigrants | Yemen | 50.2 /100 | #173 | Average 31.7% |