Puerto Rican vs Immigrants from the Azores Currently Married
COMPARE
Puerto Rican
Immigrants from the Azores
Currently Married
Currently Married Comparison
Puerto Ricans
Immigrants from the Azores
39.9%
CURRENTLY MARRIED
0.0/ 100
METRIC RATING
334th/ 347
METRIC RANK
45.1%
CURRENTLY MARRIED
2.5/ 100
METRIC RATING
222nd/ 347
METRIC RANK
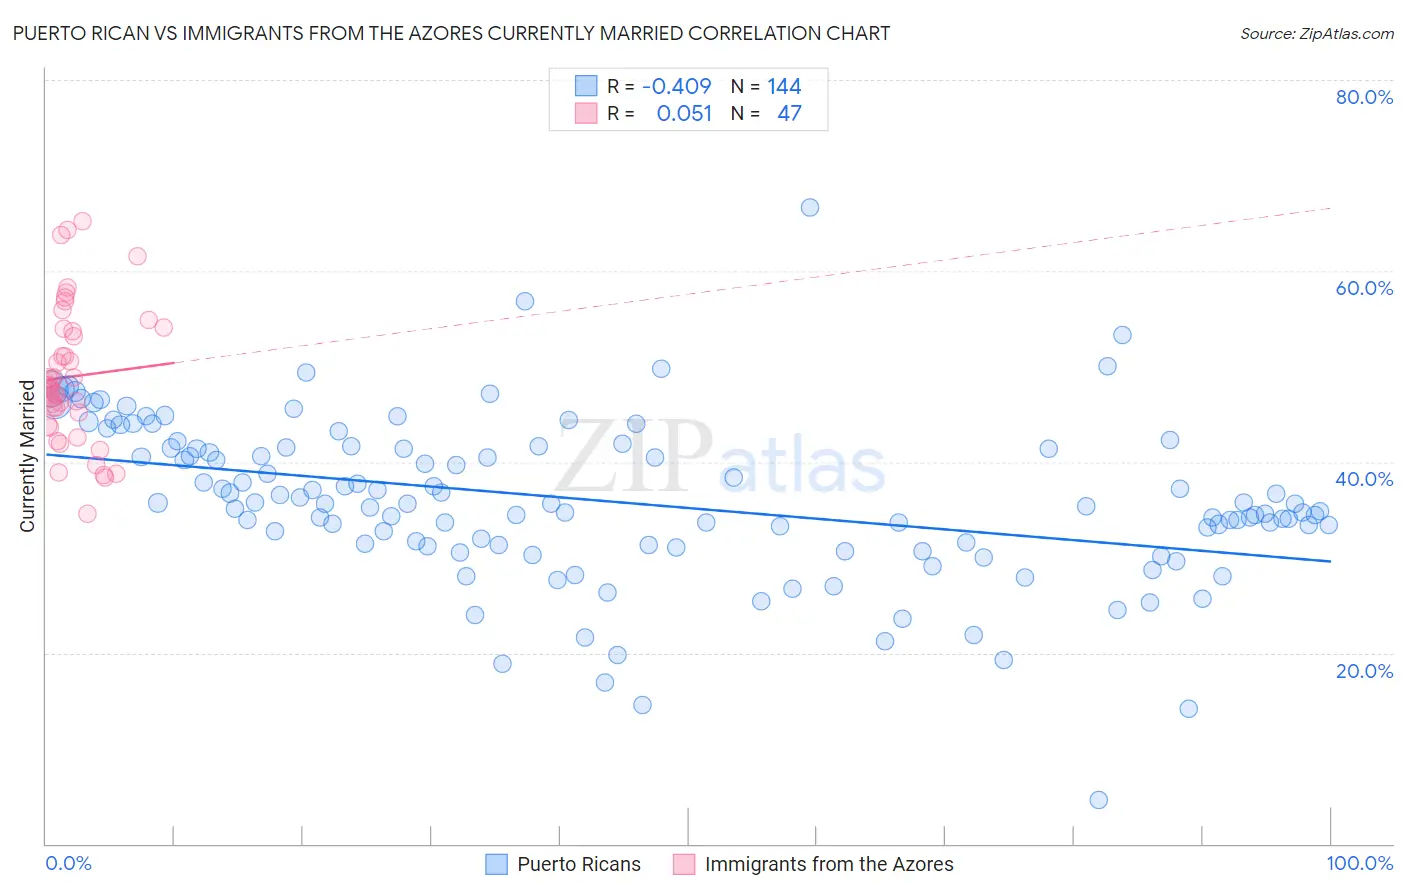
Puerto Rican vs Immigrants from the Azores Currently Married Correlation Chart
The statistical analysis conducted on geographies consisting of 528,221,069 people shows a moderate negative correlation between the proportion of Puerto Ricans and percentage of population currently married in the United States with a correlation coefficient (R) of -0.409 and weighted average of 39.9%. Similarly, the statistical analysis conducted on geographies consisting of 46,256,915 people shows a slight positive correlation between the proportion of Immigrants from the Azores and percentage of population currently married in the United States with a correlation coefficient (R) of 0.051 and weighted average of 45.1%, a difference of 13.0%.
Currently Married Correlation Summary
| Measurement | Puerto Rican | Immigrants from the Azores |
| Minimum | 4.6% | 34.6% |
| Maximum | 66.7% | 65.2% |
| Range | 62.1% | 30.6% |
| Mean | 35.8% | 48.9% |
| Median | 35.4% | 47.9% |
| Interquartile 25% (IQ1) | 31.3% | 43.9% |
| Interquartile 75% (IQ3) | 41.4% | 54.0% |
| Interquartile Range (IQR) | 10.1% | 10.1% |
| Standard Deviation (Sample) | 8.6% | 7.2% |
| Standard Deviation (Population) | 8.6% | 7.2% |
Similar Demographics by Currently Married
Demographics Similar to Puerto Ricans by Currently Married
In terms of currently married, the demographic groups most similar to Puerto Ricans are Yup'ik (39.9%, a difference of 0.010%), Lumbee (39.8%, a difference of 0.16%), British West Indian (39.8%, a difference of 0.34%), Immigrants from St. Vincent and the Grenadines (40.1%, a difference of 0.41%), and Black/African American (39.6%, a difference of 0.72%).
| Demographics | Rating | Rank | Currently Married |
| Senegalese | 0.0 /100 | #327 | Tragic 40.6% |
| Arapaho | 0.0 /100 | #328 | Tragic 40.5% |
| Crow | 0.0 /100 | #329 | Tragic 40.4% |
| Immigrants | Dominica | 0.0 /100 | #330 | Tragic 40.3% |
| Immigrants | Barbados | 0.0 /100 | #331 | Tragic 40.3% |
| Immigrants | St. Vincent and the Grenadines | 0.0 /100 | #332 | Tragic 40.1% |
| Yup'ik | 0.0 /100 | #333 | Tragic 39.9% |
| Puerto Ricans | 0.0 /100 | #334 | Tragic 39.9% |
| Lumbee | 0.0 /100 | #335 | Tragic 39.8% |
| British West Indians | 0.0 /100 | #336 | Tragic 39.8% |
| Blacks/African Americans | 0.0 /100 | #337 | Tragic 39.6% |
| Cape Verdeans | 0.0 /100 | #338 | Tragic 39.6% |
| Dominicans | 0.0 /100 | #339 | Tragic 39.5% |
| Immigrants | Grenada | 0.0 /100 | #340 | Tragic 39.1% |
| Navajo | 0.0 /100 | #341 | Tragic 39.0% |
Demographics Similar to Immigrants from the Azores by Currently Married
In terms of currently married, the demographic groups most similar to Immigrants from the Azores are Immigrants from Laos (45.0%, a difference of 0.080%), Immigrants from Uganda (45.0%, a difference of 0.13%), French American Indian (45.0%, a difference of 0.13%), Comanche (45.0%, a difference of 0.18%), and Spanish American (45.0%, a difference of 0.18%).
| Demographics | Rating | Rank | Currently Married |
| German Russians | 6.7 /100 | #215 | Tragic 45.5% |
| Immigrants | Morocco | 5.5 /100 | #216 | Tragic 45.4% |
| Immigrants | Thailand | 5.1 /100 | #217 | Tragic 45.4% |
| Panamanians | 4.0 /100 | #218 | Tragic 45.3% |
| Immigrants | Portugal | 3.5 /100 | #219 | Tragic 45.2% |
| Kenyans | 3.1 /100 | #220 | Tragic 45.2% |
| Mexicans | 3.0 /100 | #221 | Tragic 45.2% |
| Immigrants | Azores | 2.5 /100 | #222 | Tragic 45.1% |
| Immigrants | Laos | 2.3 /100 | #223 | Tragic 45.0% |
| Immigrants | Uganda | 2.2 /100 | #224 | Tragic 45.0% |
| French American Indians | 2.2 /100 | #225 | Tragic 45.0% |
| Comanche | 2.1 /100 | #226 | Tragic 45.0% |
| Spanish Americans | 2.1 /100 | #227 | Tragic 45.0% |
| Immigrants | Uruguay | 2.0 /100 | #228 | Tragic 45.0% |
| Cree | 1.7 /100 | #229 | Tragic 44.9% |