Puerto Rican vs Immigrants from Kuwait Currently Married
COMPARE
Puerto Rican
Immigrants from Kuwait
Currently Married
Currently Married Comparison
Puerto Ricans
Immigrants from Kuwait
39.9%
CURRENTLY MARRIED
0.0/ 100
METRIC RATING
334th/ 347
METRIC RANK
46.1%
CURRENTLY MARRIED
21.7/ 100
METRIC RATING
197th/ 347
METRIC RANK
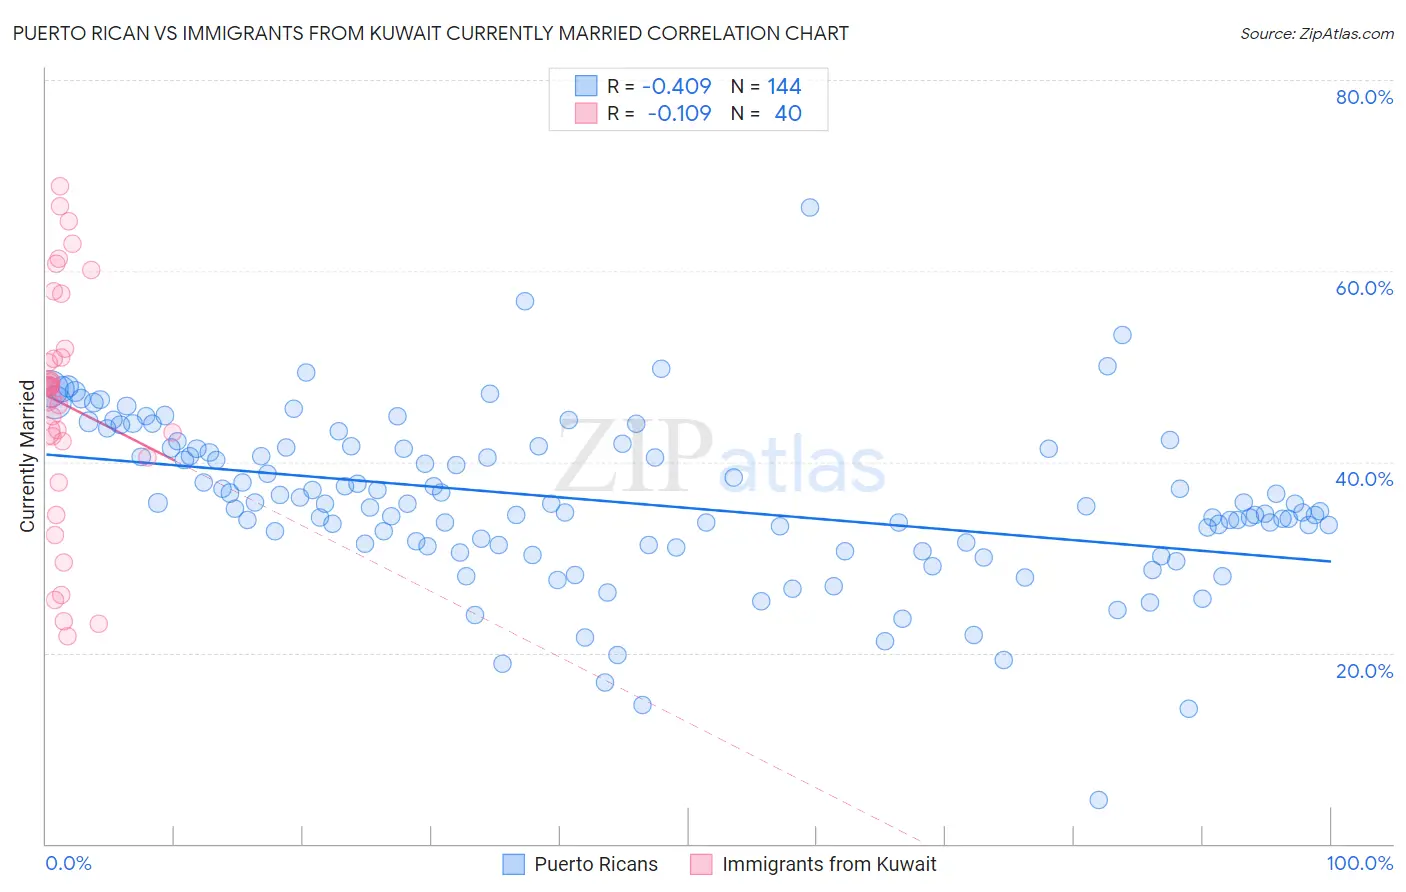
Puerto Rican vs Immigrants from Kuwait Currently Married Correlation Chart
The statistical analysis conducted on geographies consisting of 528,221,069 people shows a moderate negative correlation between the proportion of Puerto Ricans and percentage of population currently married in the United States with a correlation coefficient (R) of -0.409 and weighted average of 39.9%. Similarly, the statistical analysis conducted on geographies consisting of 136,899,142 people shows a poor negative correlation between the proportion of Immigrants from Kuwait and percentage of population currently married in the United States with a correlation coefficient (R) of -0.109 and weighted average of 46.1%, a difference of 15.5%.
Currently Married Correlation Summary
| Measurement | Puerto Rican | Immigrants from Kuwait |
| Minimum | 4.6% | 21.7% |
| Maximum | 66.7% | 68.9% |
| Range | 62.1% | 47.2% |
| Mean | 35.8% | 46.1% |
| Median | 35.4% | 47.8% |
| Interquartile 25% (IQ1) | 31.3% | 41.4% |
| Interquartile 75% (IQ3) | 41.4% | 51.4% |
| Interquartile Range (IQR) | 10.1% | 10.0% |
| Standard Deviation (Sample) | 8.6% | 12.3% |
| Standard Deviation (Population) | 8.6% | 12.1% |
Similar Demographics by Currently Married
Demographics Similar to Puerto Ricans by Currently Married
In terms of currently married, the demographic groups most similar to Puerto Ricans are Yup'ik (39.9%, a difference of 0.010%), Lumbee (39.8%, a difference of 0.16%), British West Indian (39.8%, a difference of 0.34%), Immigrants from St. Vincent and the Grenadines (40.1%, a difference of 0.41%), and Black/African American (39.6%, a difference of 0.72%).
| Demographics | Rating | Rank | Currently Married |
| Senegalese | 0.0 /100 | #327 | Tragic 40.6% |
| Arapaho | 0.0 /100 | #328 | Tragic 40.5% |
| Crow | 0.0 /100 | #329 | Tragic 40.4% |
| Immigrants | Dominica | 0.0 /100 | #330 | Tragic 40.3% |
| Immigrants | Barbados | 0.0 /100 | #331 | Tragic 40.3% |
| Immigrants | St. Vincent and the Grenadines | 0.0 /100 | #332 | Tragic 40.1% |
| Yup'ik | 0.0 /100 | #333 | Tragic 39.9% |
| Puerto Ricans | 0.0 /100 | #334 | Tragic 39.9% |
| Lumbee | 0.0 /100 | #335 | Tragic 39.8% |
| British West Indians | 0.0 /100 | #336 | Tragic 39.8% |
| Blacks/African Americans | 0.0 /100 | #337 | Tragic 39.6% |
| Cape Verdeans | 0.0 /100 | #338 | Tragic 39.6% |
| Dominicans | 0.0 /100 | #339 | Tragic 39.5% |
| Immigrants | Grenada | 0.0 /100 | #340 | Tragic 39.1% |
| Navajo | 0.0 /100 | #341 | Tragic 39.0% |
Demographics Similar to Immigrants from Kuwait by Currently Married
In terms of currently married, the demographic groups most similar to Immigrants from Kuwait are Immigrants from Bosnia and Herzegovina (46.1%, a difference of 0.030%), Immigrants from Colombia (46.1%, a difference of 0.040%), Immigrants from Nepal (46.1%, a difference of 0.10%), South American (46.1%, a difference of 0.11%), and Immigrants from Costa Rica (46.0%, a difference of 0.12%).
| Demographics | Rating | Rank | Currently Married |
| Choctaw | 29.1 /100 | #190 | Fair 46.3% |
| Immigrants | France | 27.7 /100 | #191 | Fair 46.2% |
| Soviet Union | 25.7 /100 | #192 | Fair 46.2% |
| Immigrants | Fiji | 25.0 /100 | #193 | Fair 46.2% |
| South Americans | 23.8 /100 | #194 | Fair 46.1% |
| Immigrants | Nepal | 23.7 /100 | #195 | Fair 46.1% |
| Immigrants | Bosnia and Herzegovina | 22.2 /100 | #196 | Fair 46.1% |
| Immigrants | Kuwait | 21.7 /100 | #197 | Fair 46.1% |
| Immigrants | Colombia | 21.0 /100 | #198 | Fair 46.1% |
| Immigrants | Costa Rica | 19.6 /100 | #199 | Poor 46.0% |
| Creek | 17.2 /100 | #200 | Poor 46.0% |
| Malaysians | 15.3 /100 | #201 | Poor 45.9% |
| Immigrants | Albania | 14.5 /100 | #202 | Poor 45.9% |
| Taiwanese | 11.7 /100 | #203 | Poor 45.8% |
| Immigrants | Spain | 11.6 /100 | #204 | Poor 45.8% |