Puerto Rican vs Immigrants from Oceania In Labor Force | Age 20-24
COMPARE
Puerto Rican
Immigrants from Oceania
In Labor Force | Age 20-24
In Labor Force | Age 20-24 Comparison
Puerto Ricans
Immigrants from Oceania
68.3%
IN LABOR FORCE | AGE 20-24
0.0/ 100
METRIC RATING
343rd/ 347
METRIC RANK
76.1%
IN LABOR FORCE | AGE 20-24
98.0/ 100
METRIC RATING
98th/ 347
METRIC RANK
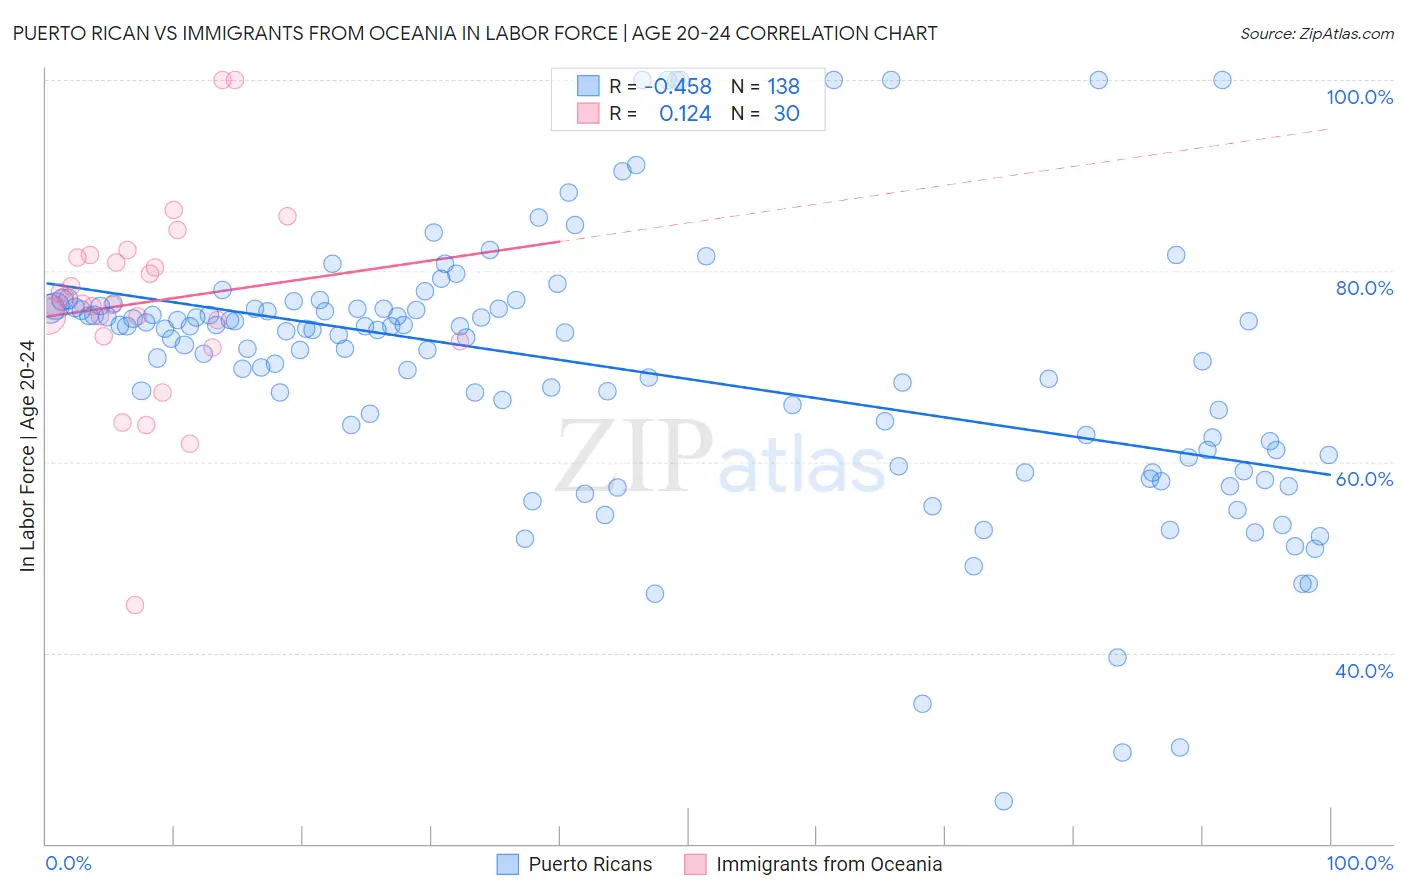
Puerto Rican vs Immigrants from Oceania In Labor Force | Age 20-24 Correlation Chart
The statistical analysis conducted on geographies consisting of 527,810,286 people shows a moderate negative correlation between the proportion of Puerto Ricans and labor force participation rate among population between the ages 20 and 24 in the United States with a correlation coefficient (R) of -0.458 and weighted average of 68.3%. Similarly, the statistical analysis conducted on geographies consisting of 305,402,520 people shows a poor positive correlation between the proportion of Immigrants from Oceania and labor force participation rate among population between the ages 20 and 24 in the United States with a correlation coefficient (R) of 0.124 and weighted average of 76.1%, a difference of 11.4%.
In Labor Force | Age 20-24 Correlation Summary
| Measurement | Puerto Rican | Immigrants from Oceania |
| Minimum | 24.4% | 45.0% |
| Maximum | 100.0% | 100.0% |
| Range | 75.6% | 55.0% |
| Mean | 69.9% | 76.7% |
| Median | 73.6% | 76.5% |
| Interquartile 25% (IQ1) | 61.2% | 73.2% |
| Interquartile 75% (IQ3) | 76.1% | 81.4% |
| Interquartile Range (IQR) | 14.9% | 8.2% |
| Standard Deviation (Sample) | 13.9% | 10.4% |
| Standard Deviation (Population) | 13.9% | 10.2% |
Similar Demographics by In Labor Force | Age 20-24
Demographics Similar to Puerto Ricans by In Labor Force | Age 20-24
In terms of in labor force | age 20-24, the demographic groups most similar to Puerto Ricans are Immigrants from St. Vincent and the Grenadines (68.4%, a difference of 0.12%), Tohono O'odham (68.6%, a difference of 0.43%), Menominee (68.7%, a difference of 0.56%), Immigrants from Yemen (68.9%, a difference of 0.87%), and Pima (69.0%, a difference of 1.0%).
| Demographics | Rating | Rank | In Labor Force | Age 20-24 |
| Yuman | 0.0 /100 | #333 | Tragic 70.3% |
| British West Indians | 0.0 /100 | #334 | Tragic 70.0% |
| Immigrants | Barbados | 0.0 /100 | #335 | Tragic 69.7% |
| Immigrants | Guyana | 0.0 /100 | #336 | Tragic 69.3% |
| Guyanese | 0.0 /100 | #337 | Tragic 69.2% |
| Pima | 0.0 /100 | #338 | Tragic 69.0% |
| Immigrants | Yemen | 0.0 /100 | #339 | Tragic 68.9% |
| Menominee | 0.0 /100 | #340 | Tragic 68.7% |
| Tohono O'odham | 0.0 /100 | #341 | Tragic 68.6% |
| Immigrants | St. Vincent and the Grenadines | 0.0 /100 | #342 | Tragic 68.4% |
| Puerto Ricans | 0.0 /100 | #343 | Tragic 68.3% |
| Immigrants | Grenada | 0.0 /100 | #344 | Tragic 67.2% |
| Hopi | 0.0 /100 | #345 | Tragic 66.0% |
| Lumbee | 0.0 /100 | #346 | Tragic 65.5% |
| Navajo | 0.0 /100 | #347 | Tragic 64.8% |
Demographics Similar to Immigrants from Oceania by In Labor Force | Age 20-24
In terms of in labor force | age 20-24, the demographic groups most similar to Immigrants from Oceania are Immigrants from Lithuania (76.1%, a difference of 0.0%), American (76.1%, a difference of 0.030%), Shoshone (76.1%, a difference of 0.040%), Immigrants from Poland (76.1%, a difference of 0.050%), and Latvian (76.1%, a difference of 0.060%).
| Demographics | Rating | Rank | In Labor Force | Age 20-24 |
| Sierra Leoneans | 99.0 /100 | #91 | Exceptional 76.3% |
| Maltese | 98.9 /100 | #92 | Exceptional 76.3% |
| Hungarians | 98.9 /100 | #93 | Exceptional 76.3% |
| Potawatomi | 98.5 /100 | #94 | Exceptional 76.2% |
| Immigrants | Germany | 98.5 /100 | #95 | Exceptional 76.2% |
| Immigrants | Nonimmigrants | 98.5 /100 | #96 | Exceptional 76.2% |
| Immigrants | Lithuania | 98.0 /100 | #97 | Exceptional 76.1% |
| Immigrants | Oceania | 98.0 /100 | #98 | Exceptional 76.1% |
| Americans | 97.8 /100 | #99 | Exceptional 76.1% |
| Shoshone | 97.8 /100 | #100 | Exceptional 76.1% |
| Immigrants | Poland | 97.7 /100 | #101 | Exceptional 76.1% |
| Latvians | 97.6 /100 | #102 | Exceptional 76.1% |
| Immigrants | North Macedonia | 97.5 /100 | #103 | Exceptional 76.1% |
| Macedonians | 97.2 /100 | #104 | Exceptional 76.0% |
| Immigrants | Nepal | 97.2 /100 | #105 | Exceptional 76.0% |