Puerto Rican vs Immigrants from Oceania Child Poverty Among Boys Under 16
COMPARE
Puerto Rican
Immigrants from Oceania
Child Poverty Among Boys Under 16
Child Poverty Among Boys Under 16 Comparison
Puerto Ricans
Immigrants from Oceania
32.8%
CHILD POVERTY AMONG BOYS UNDER 16
0.0/ 100
METRIC RATING
347th/ 347
METRIC RANK
16.0%
CHILD POVERTY AMONG BOYS UNDER 16
71.3/ 100
METRIC RATING
161st/ 347
METRIC RANK
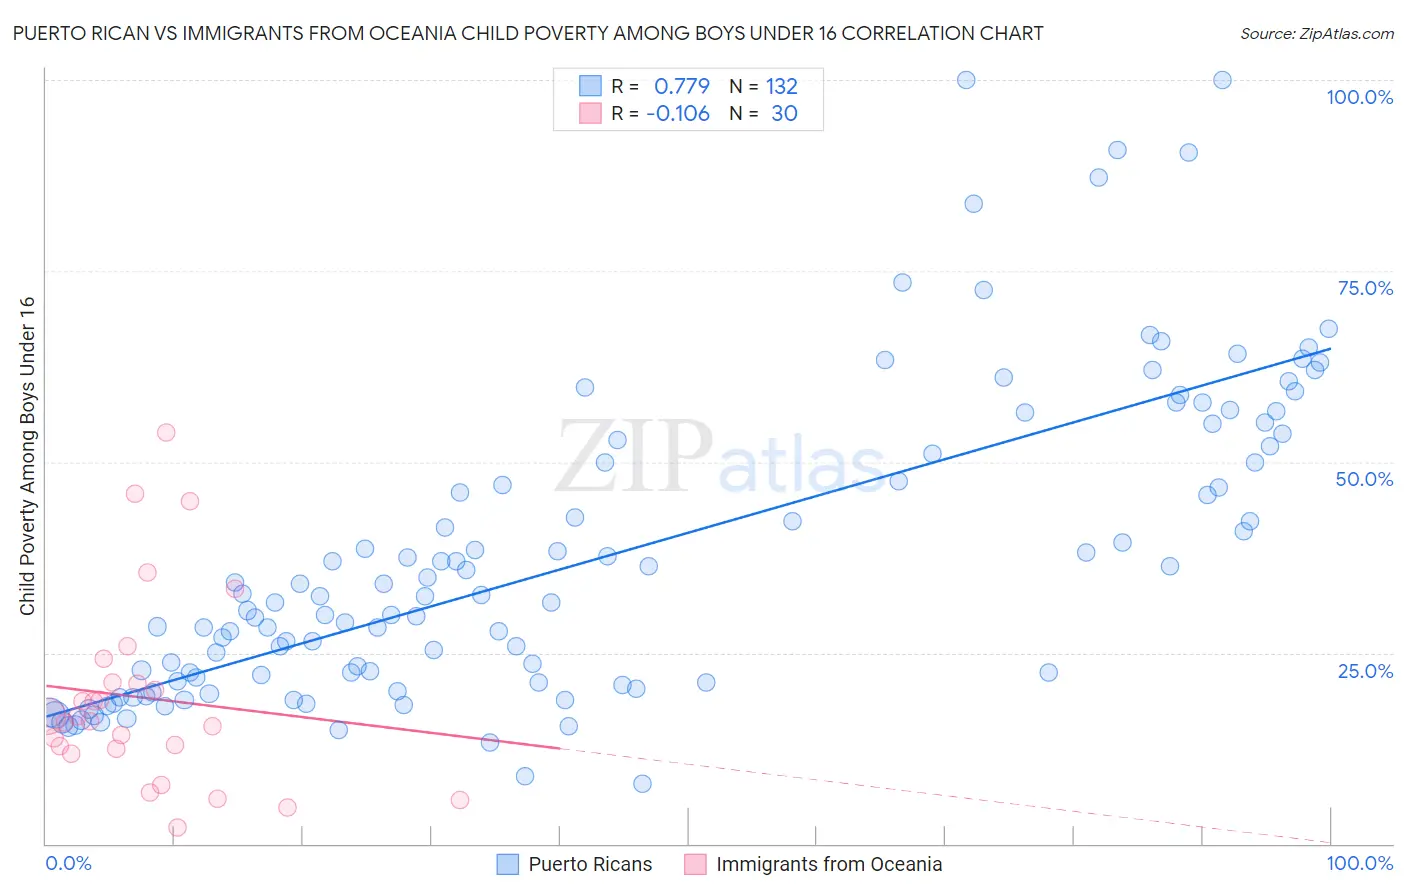
Puerto Rican vs Immigrants from Oceania Child Poverty Among Boys Under 16 Correlation Chart
The statistical analysis conducted on geographies consisting of 514,590,520 people shows a strong positive correlation between the proportion of Puerto Ricans and poverty level among boys under the age of 16 in the United States with a correlation coefficient (R) of 0.779 and weighted average of 32.8%. Similarly, the statistical analysis conducted on geographies consisting of 301,361,436 people shows a poor negative correlation between the proportion of Immigrants from Oceania and poverty level among boys under the age of 16 in the United States with a correlation coefficient (R) of -0.106 and weighted average of 16.0%, a difference of 105.1%.
Child Poverty Among Boys Under 16 Correlation Summary
| Measurement | Puerto Rican | Immigrants from Oceania |
| Minimum | 7.9% | 2.1% |
| Maximum | 100.0% | 53.8% |
| Range | 92.1% | 51.7% |
| Mean | 37.5% | 19.1% |
| Median | 32.4% | 16.3% |
| Interquartile 25% (IQ1) | 21.2% | 12.4% |
| Interquartile 75% (IQ3) | 51.6% | 21.2% |
| Interquartile Range (IQR) | 30.4% | 8.8% |
| Standard Deviation (Sample) | 20.1% | 12.5% |
| Standard Deviation (Population) | 20.0% | 12.3% |
Similar Demographics by Child Poverty Among Boys Under 16
Demographics Similar to Puerto Ricans by Child Poverty Among Boys Under 16
In terms of child poverty among boys under 16, the demographic groups most similar to Puerto Ricans are Lumbee (31.9%, a difference of 2.9%), Tohono O'odham (31.6%, a difference of 4.1%), Yuman (30.6%, a difference of 7.2%), Navajo (30.3%, a difference of 8.4%), and Pima (29.7%, a difference of 10.4%).
| Demographics | Rating | Rank | Child Poverty Among Boys Under 16 |
| Apache | 0.0 /100 | #333 | Tragic 24.5% |
| Blacks/African Americans | 0.0 /100 | #334 | Tragic 24.5% |
| Yup'ik | 0.0 /100 | #335 | Tragic 24.7% |
| Sioux | 0.0 /100 | #336 | Tragic 25.3% |
| Cheyenne | 0.0 /100 | #337 | Tragic 25.8% |
| Hopi | 0.0 /100 | #338 | Tragic 25.9% |
| Houma | 0.0 /100 | #339 | Tragic 26.2% |
| Crow | 0.0 /100 | #340 | Tragic 26.3% |
| Immigrants | Yemen | 0.0 /100 | #341 | Tragic 28.9% |
| Pima | 0.0 /100 | #342 | Tragic 29.7% |
| Navajo | 0.0 /100 | #343 | Tragic 30.3% |
| Yuman | 0.0 /100 | #344 | Tragic 30.6% |
| Tohono O'odham | 0.0 /100 | #345 | Tragic 31.6% |
| Lumbee | 0.0 /100 | #346 | Tragic 31.9% |
| Puerto Ricans | 0.0 /100 | #347 | Tragic 32.8% |
Demographics Similar to Immigrants from Oceania by Child Poverty Among Boys Under 16
In terms of child poverty among boys under 16, the demographic groups most similar to Immigrants from Oceania are Immigrants from Northern Africa (16.0%, a difference of 0.010%), Guamanian/Chamorro (16.1%, a difference of 0.23%), Costa Rican (16.1%, a difference of 0.43%), Immigrants from Albania (16.1%, a difference of 0.45%), and Immigrants from Chile (15.9%, a difference of 0.52%).
| Demographics | Rating | Rank | Child Poverty Among Boys Under 16 |
| Syrians | 77.5 /100 | #154 | Good 15.9% |
| French Canadians | 76.6 /100 | #155 | Good 15.9% |
| Israelis | 76.5 /100 | #156 | Good 15.9% |
| Immigrants | Nepal | 76.0 /100 | #157 | Good 15.9% |
| Yugoslavians | 75.9 /100 | #158 | Good 15.9% |
| Immigrants | Chile | 74.8 /100 | #159 | Good 15.9% |
| Immigrants | Northern Africa | 71.3 /100 | #160 | Good 16.0% |
| Immigrants | Oceania | 71.3 /100 | #161 | Good 16.0% |
| Guamanians/Chamorros | 69.6 /100 | #162 | Good 16.1% |
| Costa Ricans | 68.1 /100 | #163 | Good 16.1% |
| Immigrants | Albania | 67.9 /100 | #164 | Good 16.1% |
| Colombians | 65.2 /100 | #165 | Good 16.1% |
| Immigrants | Germany | 63.6 /100 | #166 | Good 16.2% |
| Afghans | 55.4 /100 | #167 | Average 16.3% |
| South Americans | 55.3 /100 | #168 | Average 16.3% |