Sioux vs Choctaw GED/Equivalency
COMPARE
Sioux
Choctaw
GED/Equivalency
GED/Equivalency Comparison
Sioux
Choctaw
82.6%
GED/EQUIVALENCY
0.1/ 100
METRIC RATING
281st/ 347
METRIC RANK
83.1%
GED/EQUIVALENCY
0.3/ 100
METRIC RATING
260th/ 347
METRIC RANK
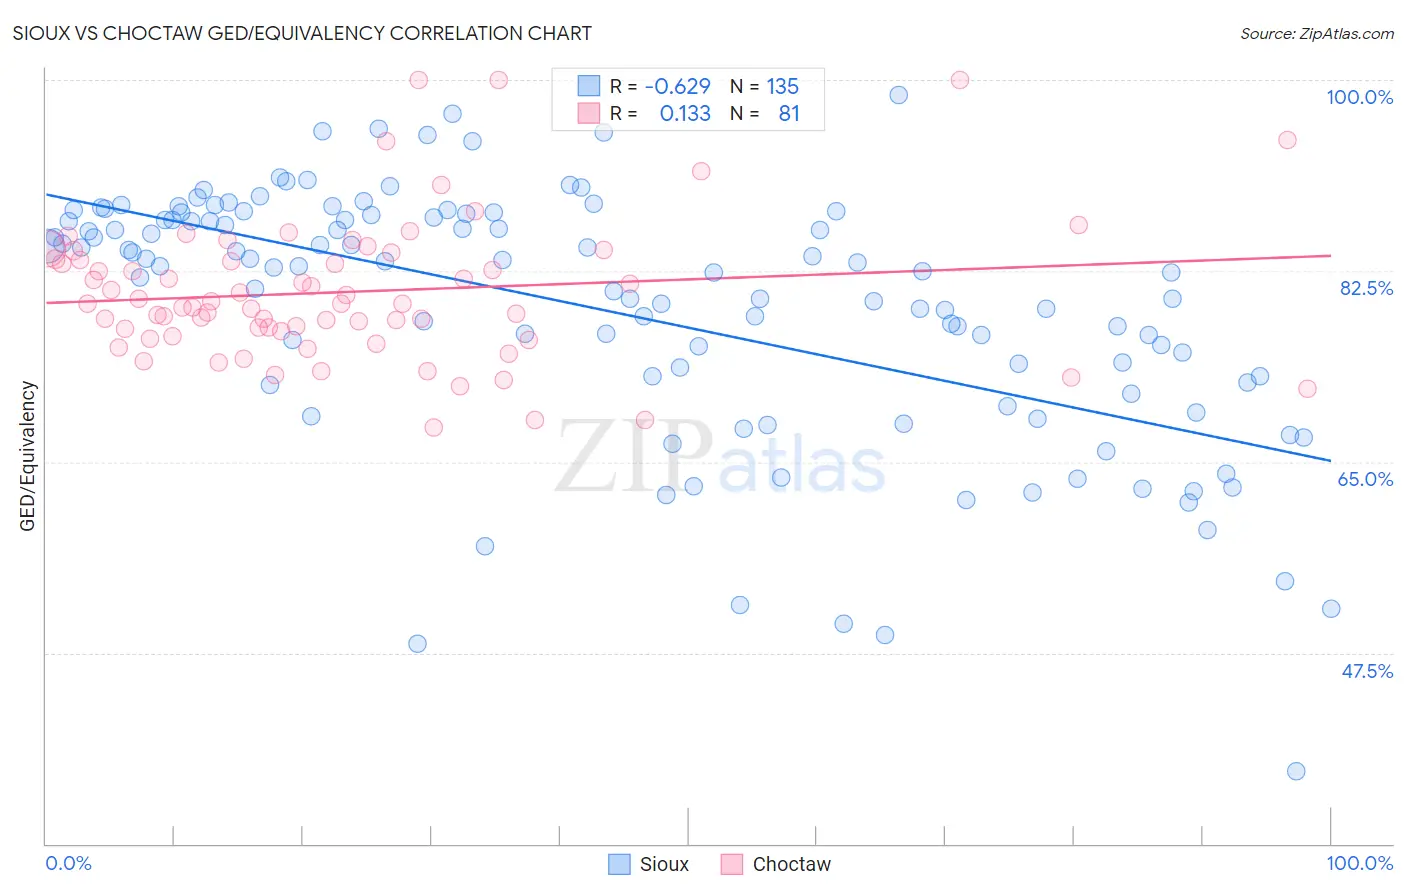
Sioux vs Choctaw GED/Equivalency Correlation Chart
The statistical analysis conducted on geographies consisting of 234,200,345 people shows a significant negative correlation between the proportion of Sioux and percentage of population with at least ged/equivalency education in the United States with a correlation coefficient (R) of -0.629 and weighted average of 82.6%. Similarly, the statistical analysis conducted on geographies consisting of 269,738,650 people shows a poor positive correlation between the proportion of Choctaw and percentage of population with at least ged/equivalency education in the United States with a correlation coefficient (R) of 0.133 and weighted average of 83.1%, a difference of 0.59%.
GED/Equivalency Correlation Summary
| Measurement | Sioux | Choctaw |
| Minimum | 36.6% | 68.1% |
| Maximum | 98.6% | 100.0% |
| Range | 62.0% | 31.9% |
| Mean | 78.9% | 80.6% |
| Median | 82.8% | 79.5% |
| Interquartile 25% (IQ1) | 72.3% | 76.7% |
| Interquartile 75% (IQ3) | 87.4% | 83.9% |
| Interquartile Range (IQR) | 15.2% | 7.2% |
| Standard Deviation (Sample) | 11.7% | 6.5% |
| Standard Deviation (Population) | 11.6% | 6.5% |
Similar Demographics by GED/Equivalency
Demographics Similar to Sioux by GED/Equivalency
In terms of ged/equivalency, the demographic groups most similar to Sioux are Immigrants from Fiji (82.7%, a difference of 0.090%), Cheyenne (82.7%, a difference of 0.090%), Immigrants (82.6%, a difference of 0.090%), Immigrants from Laos (82.7%, a difference of 0.10%), and Arapaho (82.8%, a difference of 0.14%).
| Demographics | Rating | Rank | GED/Equivalency |
| Immigrants | Trinidad and Tobago | 0.1 /100 | #274 | Tragic 82.8% |
| Seminole | 0.1 /100 | #275 | Tragic 82.8% |
| Blacks/African Americans | 0.1 /100 | #276 | Tragic 82.8% |
| Arapaho | 0.1 /100 | #277 | Tragic 82.8% |
| Immigrants | Laos | 0.1 /100 | #278 | Tragic 82.7% |
| Immigrants | Fiji | 0.1 /100 | #279 | Tragic 82.7% |
| Cheyenne | 0.1 /100 | #280 | Tragic 82.7% |
| Sioux | 0.1 /100 | #281 | Tragic 82.6% |
| Immigrants | Immigrants | 0.1 /100 | #282 | Tragic 82.6% |
| Indonesians | 0.1 /100 | #283 | Tragic 82.5% |
| Immigrants | Barbados | 0.1 /100 | #284 | Tragic 82.4% |
| Cajuns | 0.0 /100 | #285 | Tragic 82.4% |
| Immigrants | West Indies | 0.0 /100 | #286 | Tragic 82.4% |
| Japanese | 0.0 /100 | #287 | Tragic 82.4% |
| Pueblo | 0.0 /100 | #288 | Tragic 82.3% |
Demographics Similar to Choctaw by GED/Equivalency
In terms of ged/equivalency, the demographic groups most similar to Choctaw are Immigrants from Vietnam (83.2%, a difference of 0.030%), Inupiat (83.1%, a difference of 0.050%), Immigrants from Armenia (83.1%, a difference of 0.060%), Immigrants from Congo (83.1%, a difference of 0.070%), and Bangladeshi (83.1%, a difference of 0.080%).
| Demographics | Rating | Rank | GED/Equivalency |
| Comanche | 0.7 /100 | #253 | Tragic 83.6% |
| Creek | 0.7 /100 | #254 | Tragic 83.6% |
| Colville | 0.5 /100 | #255 | Tragic 83.4% |
| Africans | 0.5 /100 | #256 | Tragic 83.4% |
| Jamaicans | 0.4 /100 | #257 | Tragic 83.3% |
| Malaysians | 0.4 /100 | #258 | Tragic 83.3% |
| Immigrants | Vietnam | 0.3 /100 | #259 | Tragic 83.2% |
| Choctaw | 0.3 /100 | #260 | Tragic 83.1% |
| Inupiat | 0.2 /100 | #261 | Tragic 83.1% |
| Immigrants | Armenia | 0.2 /100 | #262 | Tragic 83.1% |
| Immigrants | Congo | 0.2 /100 | #263 | Tragic 83.1% |
| Bangladeshis | 0.2 /100 | #264 | Tragic 83.1% |
| West Indians | 0.2 /100 | #265 | Tragic 83.1% |
| Kiowa | 0.2 /100 | #266 | Tragic 83.1% |
| Trinidadians and Tobagonians | 0.2 /100 | #267 | Tragic 83.0% |