Immigrants from Israel vs Choctaw GED/Equivalency
COMPARE
Immigrants from Israel
Choctaw
GED/Equivalency
GED/Equivalency Comparison
Immigrants from Israel
Choctaw
88.2%
GED/EQUIVALENCY
99.6/ 100
METRIC RATING
39th/ 347
METRIC RANK
83.1%
GED/EQUIVALENCY
0.3/ 100
METRIC RATING
260th/ 347
METRIC RANK
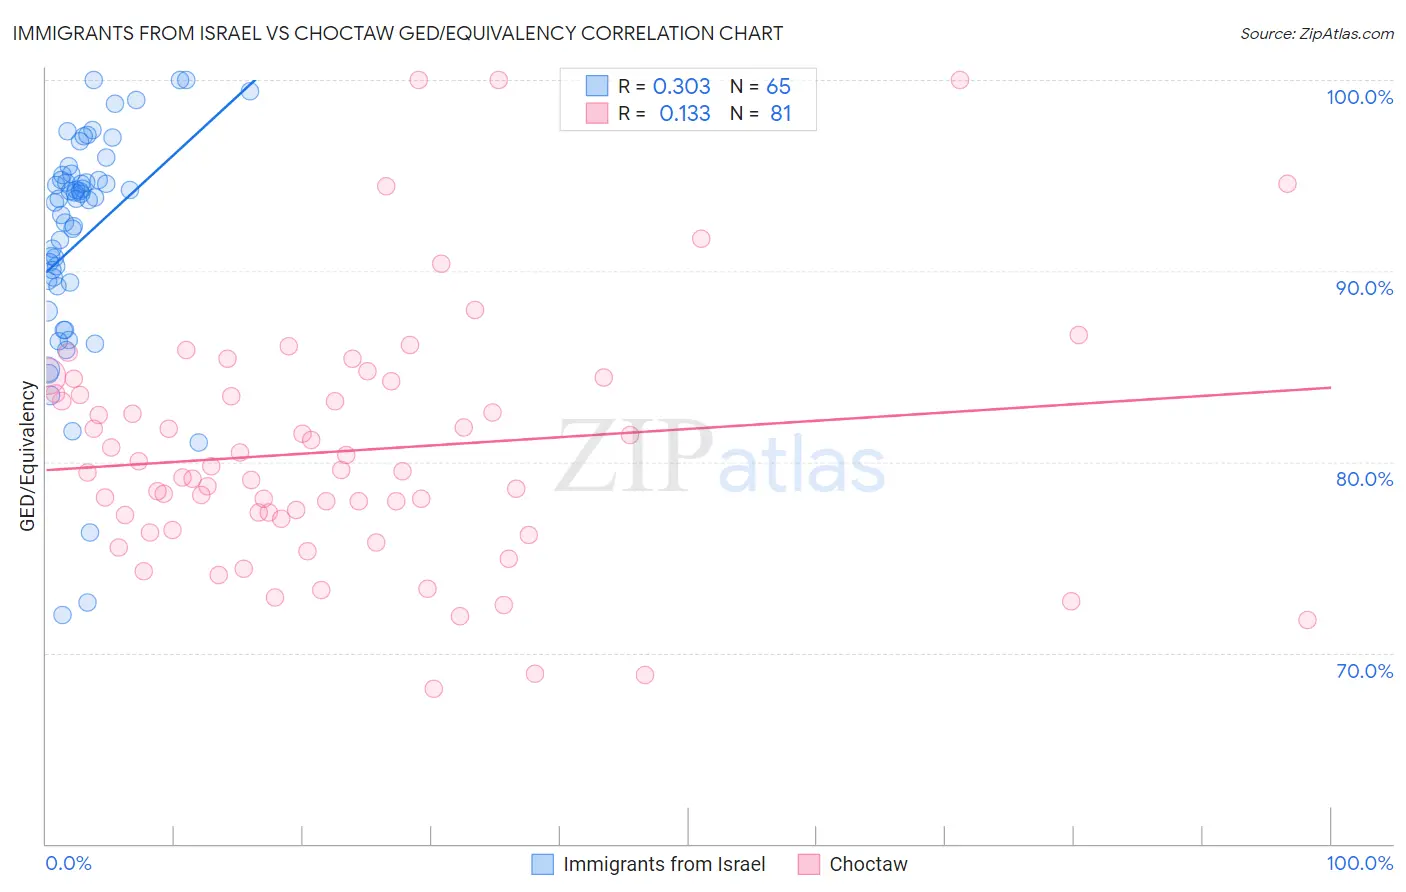
Immigrants from Israel vs Choctaw GED/Equivalency Correlation Chart
The statistical analysis conducted on geographies consisting of 210,029,020 people shows a mild positive correlation between the proportion of Immigrants from Israel and percentage of population with at least ged/equivalency education in the United States with a correlation coefficient (R) of 0.303 and weighted average of 88.2%. Similarly, the statistical analysis conducted on geographies consisting of 269,738,650 people shows a poor positive correlation between the proportion of Choctaw and percentage of population with at least ged/equivalency education in the United States with a correlation coefficient (R) of 0.133 and weighted average of 83.1%, a difference of 6.1%.
GED/Equivalency Correlation Summary
| Measurement | Immigrants from Israel | Choctaw |
| Minimum | 72.0% | 68.1% |
| Maximum | 100.0% | 100.0% |
| Range | 28.0% | 31.9% |
| Mean | 91.7% | 80.6% |
| Median | 93.8% | 79.5% |
| Interquartile 25% (IQ1) | 89.3% | 76.7% |
| Interquartile 75% (IQ3) | 94.9% | 83.9% |
| Interquartile Range (IQR) | 5.6% | 7.2% |
| Standard Deviation (Sample) | 6.0% | 6.5% |
| Standard Deviation (Population) | 6.0% | 6.5% |
Similar Demographics by GED/Equivalency
Demographics Similar to Immigrants from Israel by GED/Equivalency
In terms of ged/equivalency, the demographic groups most similar to Immigrants from Israel are Italian (88.2%, a difference of 0.020%), Finnish (88.2%, a difference of 0.030%), Cambodian (88.2%, a difference of 0.060%), Immigrants from Scotland (88.2%, a difference of 0.070%), and Burmese (88.3%, a difference of 0.090%).
| Demographics | Rating | Rank | GED/Equivalency |
| Danes | 99.8 /100 | #32 | Exceptional 88.4% |
| Immigrants | Sweden | 99.7 /100 | #33 | Exceptional 88.4% |
| Immigrants | Japan | 99.7 /100 | #34 | Exceptional 88.4% |
| Immigrants | South Central Asia | 99.7 /100 | #35 | Exceptional 88.4% |
| Immigrants | Belgium | 99.7 /100 | #36 | Exceptional 88.3% |
| Immigrants | Austria | 99.7 /100 | #37 | Exceptional 88.3% |
| Burmese | 99.7 /100 | #38 | Exceptional 88.3% |
| Immigrants | Israel | 99.6 /100 | #39 | Exceptional 88.2% |
| Italians | 99.6 /100 | #40 | Exceptional 88.2% |
| Finns | 99.6 /100 | #41 | Exceptional 88.2% |
| Cambodians | 99.6 /100 | #42 | Exceptional 88.2% |
| Immigrants | Scotland | 99.6 /100 | #43 | Exceptional 88.2% |
| Macedonians | 99.5 /100 | #44 | Exceptional 88.1% |
| Czechs | 99.5 /100 | #45 | Exceptional 88.1% |
| Immigrants | Switzerland | 99.5 /100 | #46 | Exceptional 88.1% |
Demographics Similar to Choctaw by GED/Equivalency
In terms of ged/equivalency, the demographic groups most similar to Choctaw are Immigrants from Vietnam (83.2%, a difference of 0.030%), Inupiat (83.1%, a difference of 0.050%), Immigrants from Armenia (83.1%, a difference of 0.060%), Immigrants from Congo (83.1%, a difference of 0.070%), and Bangladeshi (83.1%, a difference of 0.080%).
| Demographics | Rating | Rank | GED/Equivalency |
| Comanche | 0.7 /100 | #253 | Tragic 83.6% |
| Creek | 0.7 /100 | #254 | Tragic 83.6% |
| Colville | 0.5 /100 | #255 | Tragic 83.4% |
| Africans | 0.5 /100 | #256 | Tragic 83.4% |
| Jamaicans | 0.4 /100 | #257 | Tragic 83.3% |
| Malaysians | 0.4 /100 | #258 | Tragic 83.3% |
| Immigrants | Vietnam | 0.3 /100 | #259 | Tragic 83.2% |
| Choctaw | 0.3 /100 | #260 | Tragic 83.1% |
| Inupiat | 0.2 /100 | #261 | Tragic 83.1% |
| Immigrants | Armenia | 0.2 /100 | #262 | Tragic 83.1% |
| Immigrants | Congo | 0.2 /100 | #263 | Tragic 83.1% |
| Bangladeshis | 0.2 /100 | #264 | Tragic 83.1% |
| West Indians | 0.2 /100 | #265 | Tragic 83.1% |
| Kiowa | 0.2 /100 | #266 | Tragic 83.1% |
| Trinidadians and Tobagonians | 0.2 /100 | #267 | Tragic 83.0% |