Dutch West Indian vs Choctaw GED/Equivalency
COMPARE
Dutch West Indian
Choctaw
GED/Equivalency
GED/Equivalency Comparison
Dutch West Indians
Choctaw
81.6%
GED/EQUIVALENCY
0.0/ 100
METRIC RATING
301st/ 347
METRIC RANK
83.1%
GED/EQUIVALENCY
0.3/ 100
METRIC RATING
260th/ 347
METRIC RANK
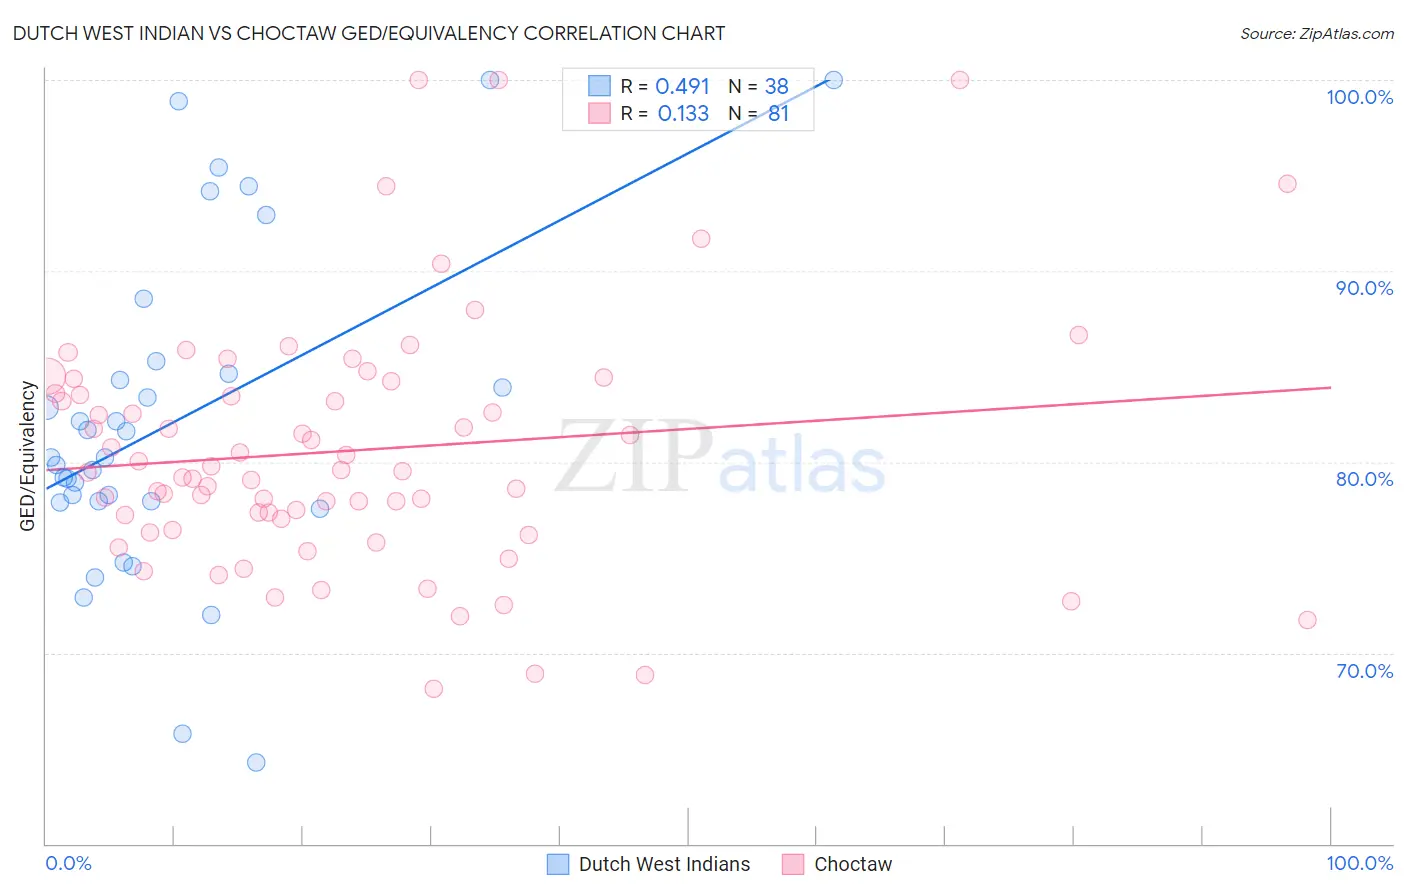
Dutch West Indian vs Choctaw GED/Equivalency Correlation Chart
The statistical analysis conducted on geographies consisting of 85,776,098 people shows a moderate positive correlation between the proportion of Dutch West Indians and percentage of population with at least ged/equivalency education in the United States with a correlation coefficient (R) of 0.491 and weighted average of 81.6%. Similarly, the statistical analysis conducted on geographies consisting of 269,738,650 people shows a poor positive correlation between the proportion of Choctaw and percentage of population with at least ged/equivalency education in the United States with a correlation coefficient (R) of 0.133 and weighted average of 83.1%, a difference of 1.9%.
GED/Equivalency Correlation Summary
| Measurement | Dutch West Indian | Choctaw |
| Minimum | 64.3% | 68.1% |
| Maximum | 100.0% | 100.0% |
| Range | 35.7% | 31.9% |
| Mean | 82.1% | 80.6% |
| Median | 80.2% | 79.5% |
| Interquartile 25% (IQ1) | 78.0% | 76.7% |
| Interquartile 75% (IQ3) | 84.6% | 83.9% |
| Interquartile Range (IQR) | 6.7% | 7.2% |
| Standard Deviation (Sample) | 8.5% | 6.5% |
| Standard Deviation (Population) | 8.4% | 6.5% |
Similar Demographics by GED/Equivalency
Demographics Similar to Dutch West Indians by GED/Equivalency
In terms of ged/equivalency, the demographic groups most similar to Dutch West Indians are Immigrants from Haiti (81.6%, a difference of 0.040%), Immigrants from Portugal (81.6%, a difference of 0.040%), Fijian (81.6%, a difference of 0.060%), Ecuadorian (81.7%, a difference of 0.13%), and Navajo (81.5%, a difference of 0.14%).
| Demographics | Rating | Rank | GED/Equivalency |
| Immigrants | St. Vincent and the Grenadines | 0.0 /100 | #294 | Tragic 82.0% |
| Nepalese | 0.0 /100 | #295 | Tragic 81.9% |
| Vietnamese | 0.0 /100 | #296 | Tragic 81.9% |
| Immigrants | Bangladesh | 0.0 /100 | #297 | Tragic 81.9% |
| Ute | 0.0 /100 | #298 | Tragic 81.8% |
| Ecuadorians | 0.0 /100 | #299 | Tragic 81.7% |
| Fijians | 0.0 /100 | #300 | Tragic 81.6% |
| Dutch West Indians | 0.0 /100 | #301 | Tragic 81.6% |
| Immigrants | Haiti | 0.0 /100 | #302 | Tragic 81.6% |
| Immigrants | Portugal | 0.0 /100 | #303 | Tragic 81.6% |
| Navajo | 0.0 /100 | #304 | Tragic 81.5% |
| Immigrants | Grenada | 0.0 /100 | #305 | Tragic 81.3% |
| Guyanese | 0.0 /100 | #306 | Tragic 81.3% |
| Immigrants | Dominica | 0.0 /100 | #307 | Tragic 81.1% |
| Puerto Ricans | 0.0 /100 | #308 | Tragic 81.1% |
Demographics Similar to Choctaw by GED/Equivalency
In terms of ged/equivalency, the demographic groups most similar to Choctaw are Immigrants from Vietnam (83.2%, a difference of 0.030%), Inupiat (83.1%, a difference of 0.050%), Immigrants from Armenia (83.1%, a difference of 0.060%), Immigrants from Congo (83.1%, a difference of 0.070%), and Bangladeshi (83.1%, a difference of 0.080%).
| Demographics | Rating | Rank | GED/Equivalency |
| Comanche | 0.7 /100 | #253 | Tragic 83.6% |
| Creek | 0.7 /100 | #254 | Tragic 83.6% |
| Colville | 0.5 /100 | #255 | Tragic 83.4% |
| Africans | 0.5 /100 | #256 | Tragic 83.4% |
| Jamaicans | 0.4 /100 | #257 | Tragic 83.3% |
| Malaysians | 0.4 /100 | #258 | Tragic 83.3% |
| Immigrants | Vietnam | 0.3 /100 | #259 | Tragic 83.2% |
| Choctaw | 0.3 /100 | #260 | Tragic 83.1% |
| Inupiat | 0.2 /100 | #261 | Tragic 83.1% |
| Immigrants | Armenia | 0.2 /100 | #262 | Tragic 83.1% |
| Immigrants | Congo | 0.2 /100 | #263 | Tragic 83.1% |
| Bangladeshis | 0.2 /100 | #264 | Tragic 83.1% |
| West Indians | 0.2 /100 | #265 | Tragic 83.1% |
| Kiowa | 0.2 /100 | #266 | Tragic 83.1% |
| Trinidadians and Tobagonians | 0.2 /100 | #267 | Tragic 83.0% |