White/Caucasian vs Tohono O'odham Disability Age 18 to 34
COMPARE
White/Caucasian
Tohono O'odham
Disability Age 18 to 34
Disability Age 18 to 34 Comparison
Whites/Caucasians
Tohono O'odham
7.6%
DISABILITY AGE 18 TO 34
0.0/ 100
METRIC RATING
288th/ 347
METRIC RANK
7.3%
DISABILITY AGE 18 TO 34
0.2/ 100
METRIC RATING
260th/ 347
METRIC RANK
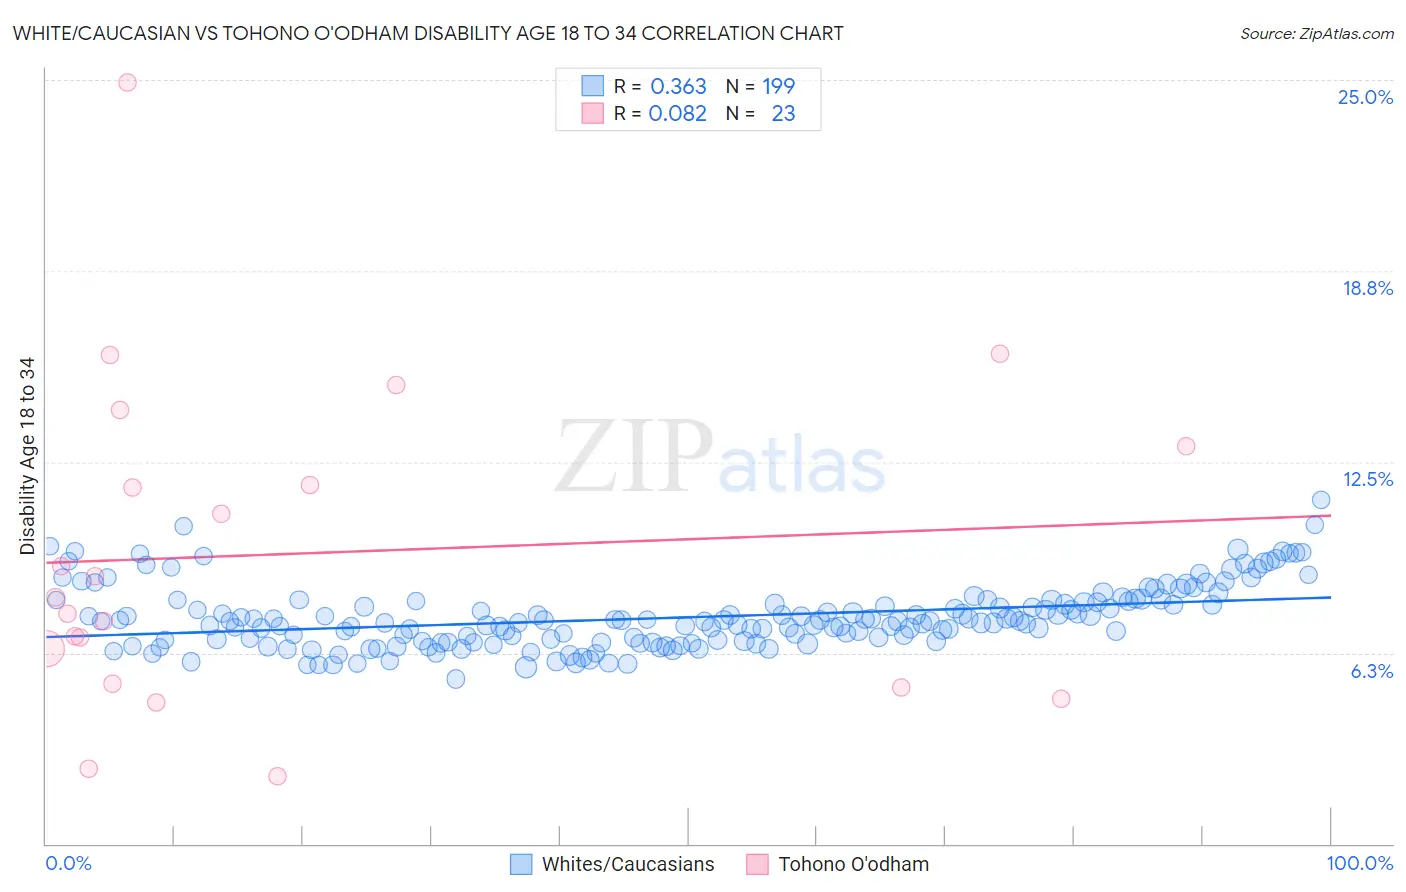
White/Caucasian vs Tohono O'odham Disability Age 18 to 34 Correlation Chart
The statistical analysis conducted on geographies consisting of 575,670,082 people shows a mild positive correlation between the proportion of Whites/Caucasians and percentage of population with a disability between the ages 18 and 35 in the United States with a correlation coefficient (R) of 0.363 and weighted average of 7.6%. Similarly, the statistical analysis conducted on geographies consisting of 58,690,000 people shows a slight positive correlation between the proportion of Tohono O'odham and percentage of population with a disability between the ages 18 and 35 in the United States with a correlation coefficient (R) of 0.082 and weighted average of 7.3%, a difference of 4.8%.
Disability Age 18 to 34 Correlation Summary
| Measurement | White/Caucasian | Tohono O'odham |
| Minimum | 5.4% | 2.2% |
| Maximum | 11.2% | 24.9% |
| Range | 5.8% | 22.7% |
| Mean | 7.4% | 9.5% |
| Median | 7.3% | 8.1% |
| Interquartile 25% (IQ1) | 6.6% | 5.2% |
| Interquartile 75% (IQ3) | 8.0% | 13.0% |
| Interquartile Range (IQR) | 1.3% | 7.8% |
| Standard Deviation (Sample) | 1.0% | 5.3% |
| Standard Deviation (Population) | 1.0% | 5.2% |
Similar Demographics by Disability Age 18 to 34
Demographics Similar to Whites/Caucasians by Disability Age 18 to 34
In terms of disability age 18 to 34, the demographic groups most similar to Whites/Caucasians are Norwegian (7.6%, a difference of 0.090%), Nonimmigrants (7.6%, a difference of 0.12%), Slovak (7.7%, a difference of 0.21%), Irish (7.7%, a difference of 0.26%), and Celtic (7.6%, a difference of 0.37%).
| Demographics | Rating | Rank | Disability Age 18 to 34 |
| Paiute | 0.0 /100 | #281 | Tragic 7.5% |
| Spanish | 0.0 /100 | #282 | Tragic 7.5% |
| Danes | 0.0 /100 | #283 | Tragic 7.5% |
| Hopi | 0.0 /100 | #284 | Tragic 7.5% |
| Swedes | 0.0 /100 | #285 | Tragic 7.5% |
| Celtics | 0.0 /100 | #286 | Tragic 7.6% |
| Norwegians | 0.0 /100 | #287 | Tragic 7.6% |
| Whites/Caucasians | 0.0 /100 | #288 | Tragic 7.6% |
| Immigrants | Nonimmigrants | 0.0 /100 | #289 | Tragic 7.6% |
| Slovaks | 0.0 /100 | #290 | Tragic 7.7% |
| Irish | 0.0 /100 | #291 | Tragic 7.7% |
| Blacks/African Americans | 0.0 /100 | #292 | Tragic 7.7% |
| Scandinavians | 0.0 /100 | #293 | Tragic 7.7% |
| Immigrants | Cabo Verde | 0.0 /100 | #294 | Tragic 7.7% |
| Tlingit-Haida | 0.0 /100 | #295 | Tragic 7.7% |
Demographics Similar to Tohono O'odham by Disability Age 18 to 34
In terms of disability age 18 to 34, the demographic groups most similar to Tohono O'odham are Somali (7.3%, a difference of 0.060%), Immigrants from Micronesia (7.3%, a difference of 0.12%), Northern European (7.3%, a difference of 0.17%), Canadian (7.3%, a difference of 0.20%), and British (7.3%, a difference of 0.49%).
| Demographics | Rating | Rank | Disability Age 18 to 34 |
| Croatians | 0.5 /100 | #253 | Tragic 7.2% |
| Indonesians | 0.4 /100 | #254 | Tragic 7.2% |
| Immigrants | Germany | 0.4 /100 | #255 | Tragic 7.2% |
| Immigrants | Laos | 0.4 /100 | #256 | Tragic 7.2% |
| Czechs | 0.3 /100 | #257 | Tragic 7.2% |
| Immigrants | Micronesia | 0.3 /100 | #258 | Tragic 7.3% |
| Somalis | 0.2 /100 | #259 | Tragic 7.3% |
| Tohono O'odham | 0.2 /100 | #260 | Tragic 7.3% |
| Northern Europeans | 0.2 /100 | #261 | Tragic 7.3% |
| Canadians | 0.2 /100 | #262 | Tragic 7.3% |
| British | 0.2 /100 | #263 | Tragic 7.3% |
| Bermudans | 0.1 /100 | #264 | Tragic 7.3% |
| Slovenes | 0.1 /100 | #265 | Tragic 7.3% |
| German Russians | 0.1 /100 | #266 | Tragic 7.4% |
| Bangladeshis | 0.1 /100 | #267 | Tragic 7.4% |