White/Caucasian vs Bolivian Disability Age 18 to 34
COMPARE
White/Caucasian
Bolivian
Disability Age 18 to 34
Disability Age 18 to 34 Comparison
Whites/Caucasians
Bolivians
7.6%
DISABILITY AGE 18 TO 34
0.0/ 100
METRIC RATING
288th/ 347
METRIC RANK
5.8%
DISABILITY AGE 18 TO 34
99.9/ 100
METRIC RATING
40th/ 347
METRIC RANK
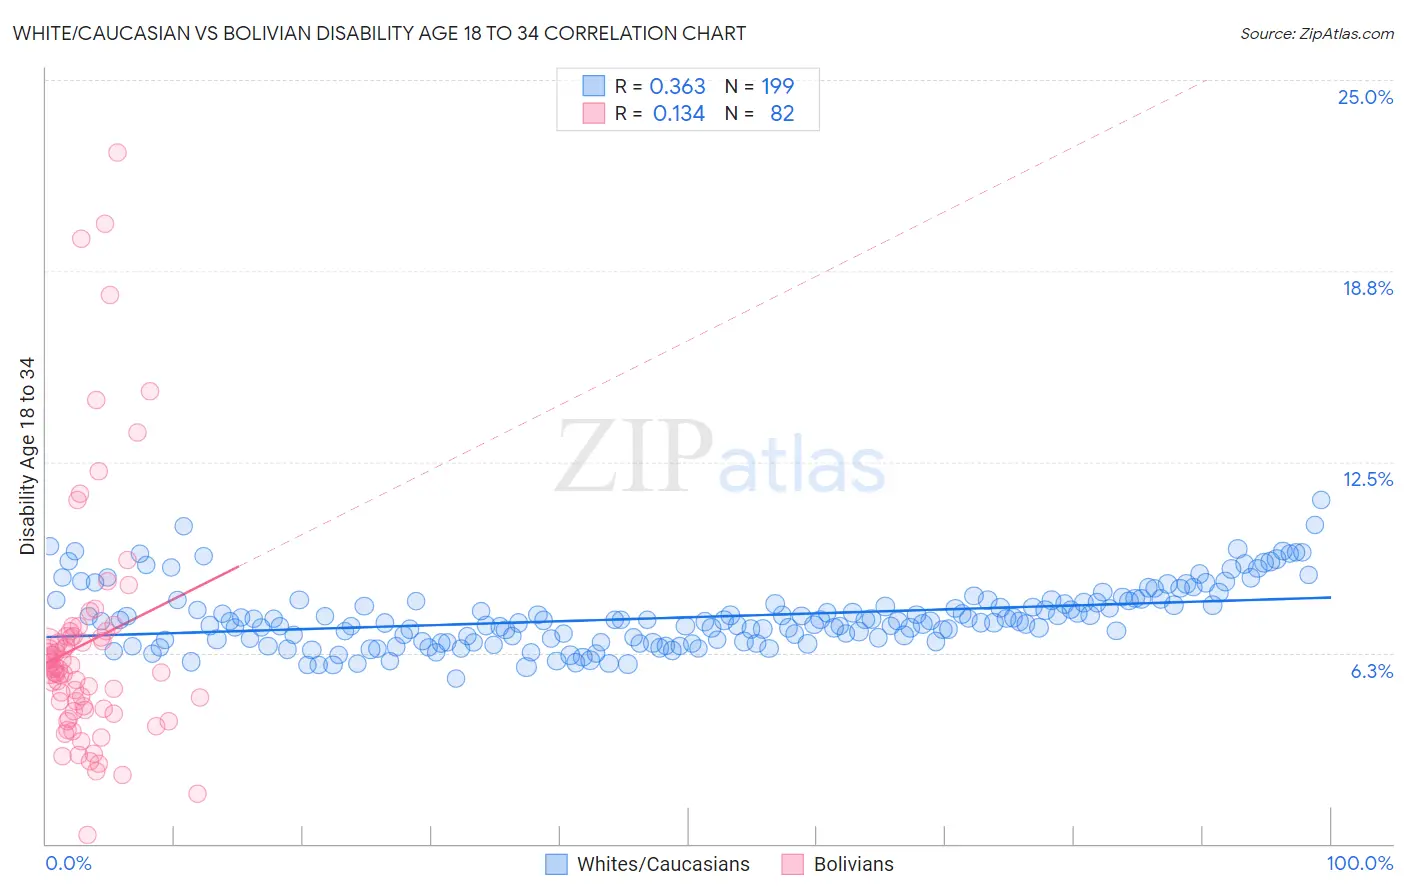
White/Caucasian vs Bolivian Disability Age 18 to 34 Correlation Chart
The statistical analysis conducted on geographies consisting of 575,670,082 people shows a mild positive correlation between the proportion of Whites/Caucasians and percentage of population with a disability between the ages 18 and 35 in the United States with a correlation coefficient (R) of 0.363 and weighted average of 7.6%. Similarly, the statistical analysis conducted on geographies consisting of 184,550,296 people shows a poor positive correlation between the proportion of Bolivians and percentage of population with a disability between the ages 18 and 35 in the United States with a correlation coefficient (R) of 0.134 and weighted average of 5.8%, a difference of 30.9%.
Disability Age 18 to 34 Correlation Summary
| Measurement | White/Caucasian | Bolivian |
| Minimum | 5.4% | 0.28% |
| Maximum | 11.2% | 22.6% |
| Range | 5.8% | 22.4% |
| Mean | 7.4% | 6.6% |
| Median | 7.3% | 5.7% |
| Interquartile 25% (IQ1) | 6.6% | 4.4% |
| Interquartile 75% (IQ3) | 8.0% | 6.8% |
| Interquartile Range (IQR) | 1.3% | 2.4% |
| Standard Deviation (Sample) | 1.0% | 4.1% |
| Standard Deviation (Population) | 1.0% | 4.0% |
Similar Demographics by Disability Age 18 to 34
Demographics Similar to Whites/Caucasians by Disability Age 18 to 34
In terms of disability age 18 to 34, the demographic groups most similar to Whites/Caucasians are Norwegian (7.6%, a difference of 0.090%), Nonimmigrants (7.6%, a difference of 0.12%), Slovak (7.7%, a difference of 0.21%), Irish (7.7%, a difference of 0.26%), and Celtic (7.6%, a difference of 0.37%).
| Demographics | Rating | Rank | Disability Age 18 to 34 |
| Paiute | 0.0 /100 | #281 | Tragic 7.5% |
| Spanish | 0.0 /100 | #282 | Tragic 7.5% |
| Danes | 0.0 /100 | #283 | Tragic 7.5% |
| Hopi | 0.0 /100 | #284 | Tragic 7.5% |
| Swedes | 0.0 /100 | #285 | Tragic 7.5% |
| Celtics | 0.0 /100 | #286 | Tragic 7.6% |
| Norwegians | 0.0 /100 | #287 | Tragic 7.6% |
| Whites/Caucasians | 0.0 /100 | #288 | Tragic 7.6% |
| Immigrants | Nonimmigrants | 0.0 /100 | #289 | Tragic 7.6% |
| Slovaks | 0.0 /100 | #290 | Tragic 7.7% |
| Irish | 0.0 /100 | #291 | Tragic 7.7% |
| Blacks/African Americans | 0.0 /100 | #292 | Tragic 7.7% |
| Scandinavians | 0.0 /100 | #293 | Tragic 7.7% |
| Immigrants | Cabo Verde | 0.0 /100 | #294 | Tragic 7.7% |
| Tlingit-Haida | 0.0 /100 | #295 | Tragic 7.7% |
Demographics Similar to Bolivians by Disability Age 18 to 34
In terms of disability age 18 to 34, the demographic groups most similar to Bolivians are Asian (5.8%, a difference of 0.080%), Nicaraguan (5.8%, a difference of 0.18%), Immigrants from South America (5.8%, a difference of 0.38%), Colombian (5.9%, a difference of 0.40%), and Armenian (5.8%, a difference of 0.41%).
| Demographics | Rating | Rank | Disability Age 18 to 34 |
| Argentineans | 99.9 /100 | #33 | Exceptional 5.8% |
| Venezuelans | 99.9 /100 | #34 | Exceptional 5.8% |
| Immigrants | Lithuania | 99.9 /100 | #35 | Exceptional 5.8% |
| Ecuadorians | 99.9 /100 | #36 | Exceptional 5.8% |
| Armenians | 99.9 /100 | #37 | Exceptional 5.8% |
| Immigrants | South America | 99.9 /100 | #38 | Exceptional 5.8% |
| Asians | 99.9 /100 | #39 | Exceptional 5.8% |
| Bolivians | 99.9 /100 | #40 | Exceptional 5.8% |
| Nicaraguans | 99.9 /100 | #41 | Exceptional 5.8% |
| Colombians | 99.8 /100 | #42 | Exceptional 5.9% |
| South Americans | 99.8 /100 | #43 | Exceptional 5.9% |
| Immigrants | Asia | 99.8 /100 | #44 | Exceptional 5.9% |
| Immigrants | Peru | 99.8 /100 | #45 | Exceptional 5.9% |
| Immigrants | Korea | 99.8 /100 | #46 | Exceptional 5.9% |
| Immigrants | Egypt | 99.8 /100 | #47 | Exceptional 5.9% |