White/Caucasian vs Yakama Disability Age 18 to 34
COMPARE
White/Caucasian
Yakama
Disability Age 18 to 34
Disability Age 18 to 34 Comparison
Whites/Caucasians
Yakama
7.6%
DISABILITY AGE 18 TO 34
0.0/ 100
METRIC RATING
288th/ 347
METRIC RANK
9.0%
DISABILITY AGE 18 TO 34
0.0/ 100
METRIC RATING
342nd/ 347
METRIC RANK
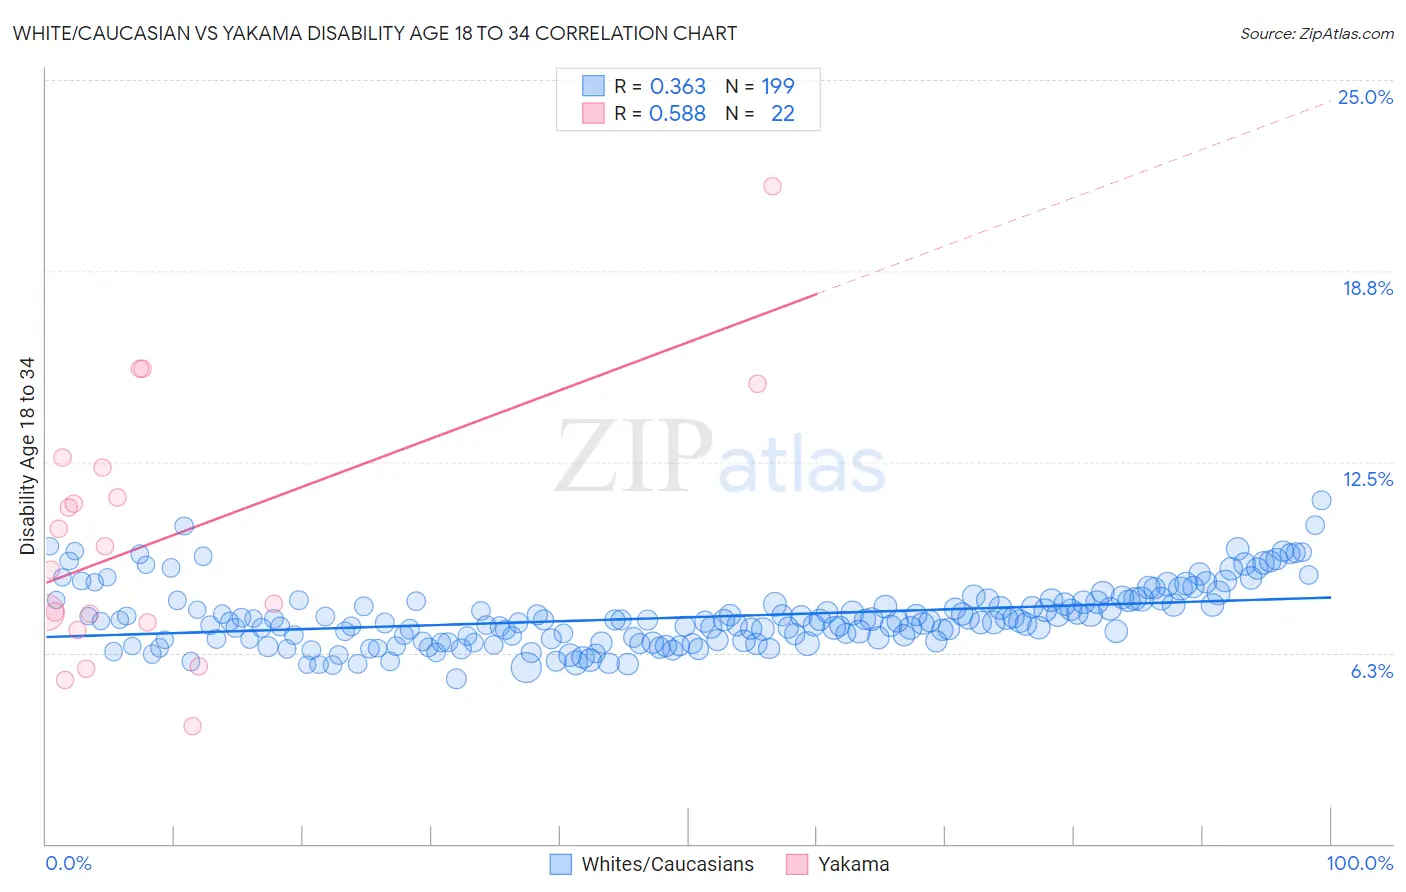
White/Caucasian vs Yakama Disability Age 18 to 34 Correlation Chart
The statistical analysis conducted on geographies consisting of 575,670,082 people shows a mild positive correlation between the proportion of Whites/Caucasians and percentage of population with a disability between the ages 18 and 35 in the United States with a correlation coefficient (R) of 0.363 and weighted average of 7.6%. Similarly, the statistical analysis conducted on geographies consisting of 19,906,145 people shows a substantial positive correlation between the proportion of Yakama and percentage of population with a disability between the ages 18 and 35 in the United States with a correlation coefficient (R) of 0.588 and weighted average of 9.0%, a difference of 17.5%.
Disability Age 18 to 34 Correlation Summary
| Measurement | White/Caucasian | Yakama |
| Minimum | 5.4% | 3.9% |
| Maximum | 11.2% | 21.5% |
| Range | 5.8% | 17.7% |
| Mean | 7.4% | 10.0% |
| Median | 7.3% | 9.3% |
| Interquartile 25% (IQ1) | 6.6% | 7.3% |
| Interquartile 75% (IQ3) | 8.0% | 12.3% |
| Interquartile Range (IQR) | 1.3% | 5.1% |
| Standard Deviation (Sample) | 1.0% | 4.2% |
| Standard Deviation (Population) | 1.0% | 4.1% |
Similar Demographics by Disability Age 18 to 34
Demographics Similar to Whites/Caucasians by Disability Age 18 to 34
In terms of disability age 18 to 34, the demographic groups most similar to Whites/Caucasians are Norwegian (7.6%, a difference of 0.090%), Nonimmigrants (7.6%, a difference of 0.12%), Slovak (7.7%, a difference of 0.21%), Irish (7.7%, a difference of 0.26%), and Celtic (7.6%, a difference of 0.37%).
| Demographics | Rating | Rank | Disability Age 18 to 34 |
| Paiute | 0.0 /100 | #281 | Tragic 7.5% |
| Spanish | 0.0 /100 | #282 | Tragic 7.5% |
| Danes | 0.0 /100 | #283 | Tragic 7.5% |
| Hopi | 0.0 /100 | #284 | Tragic 7.5% |
| Swedes | 0.0 /100 | #285 | Tragic 7.5% |
| Celtics | 0.0 /100 | #286 | Tragic 7.6% |
| Norwegians | 0.0 /100 | #287 | Tragic 7.6% |
| Whites/Caucasians | 0.0 /100 | #288 | Tragic 7.6% |
| Immigrants | Nonimmigrants | 0.0 /100 | #289 | Tragic 7.6% |
| Slovaks | 0.0 /100 | #290 | Tragic 7.7% |
| Irish | 0.0 /100 | #291 | Tragic 7.7% |
| Blacks/African Americans | 0.0 /100 | #292 | Tragic 7.7% |
| Scandinavians | 0.0 /100 | #293 | Tragic 7.7% |
| Immigrants | Cabo Verde | 0.0 /100 | #294 | Tragic 7.7% |
| Tlingit-Haida | 0.0 /100 | #295 | Tragic 7.7% |
Demographics Similar to Yakama by Disability Age 18 to 34
In terms of disability age 18 to 34, the demographic groups most similar to Yakama are Chippewa (9.0%, a difference of 0.010%), Chickasaw (9.0%, a difference of 0.050%), Choctaw (9.0%, a difference of 0.14%), Creek (9.0%, a difference of 0.39%), and Kiowa (8.8%, a difference of 1.6%).
| Demographics | Rating | Rank | Disability Age 18 to 34 |
| Apache | 0.0 /100 | #333 | Tragic 8.4% |
| Dutch West Indians | 0.0 /100 | #334 | Tragic 8.4% |
| Seminole | 0.0 /100 | #335 | Tragic 8.4% |
| Immigrants | Azores | 0.0 /100 | #336 | Tragic 8.5% |
| Ottawa | 0.0 /100 | #337 | Tragic 8.6% |
| Cherokee | 0.0 /100 | #338 | Tragic 8.7% |
| Kiowa | 0.0 /100 | #339 | Tragic 8.8% |
| Choctaw | 0.0 /100 | #340 | Tragic 9.0% |
| Chickasaw | 0.0 /100 | #341 | Tragic 9.0% |
| Yakama | 0.0 /100 | #342 | Tragic 9.0% |
| Chippewa | 0.0 /100 | #343 | Tragic 9.0% |
| Creek | 0.0 /100 | #344 | Tragic 9.0% |
| Alaskan Athabascans | 0.0 /100 | #345 | Tragic 9.4% |
| Houma | 0.0 /100 | #346 | Tragic 9.7% |
| Yuman | 0.0 /100 | #347 | Tragic 10.6% |