White/Caucasian vs Salvadoran Disability Age 18 to 34
COMPARE
White/Caucasian
Salvadoran
Disability Age 18 to 34
Disability Age 18 to 34 Comparison
Whites/Caucasians
Salvadorans
7.6%
DISABILITY AGE 18 TO 34
0.0/ 100
METRIC RATING
288th/ 347
METRIC RANK
6.0%
DISABILITY AGE 18 TO 34
99.6/ 100
METRIC RATING
63rd/ 347
METRIC RANK
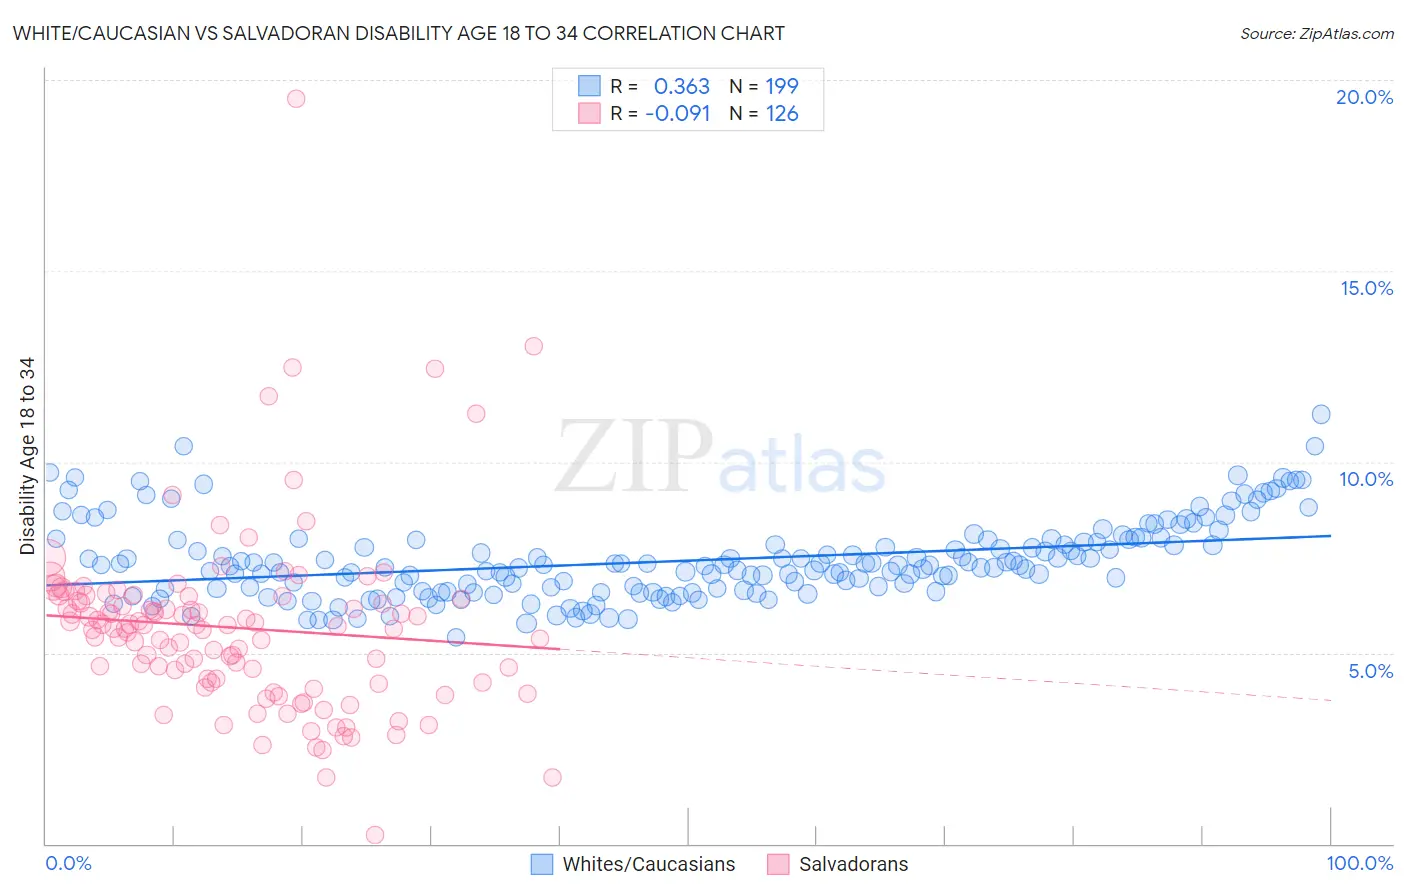
White/Caucasian vs Salvadoran Disability Age 18 to 34 Correlation Chart
The statistical analysis conducted on geographies consisting of 575,670,082 people shows a mild positive correlation between the proportion of Whites/Caucasians and percentage of population with a disability between the ages 18 and 35 in the United States with a correlation coefficient (R) of 0.363 and weighted average of 7.6%. Similarly, the statistical analysis conducted on geographies consisting of 398,205,845 people shows a slight negative correlation between the proportion of Salvadorans and percentage of population with a disability between the ages 18 and 35 in the United States with a correlation coefficient (R) of -0.091 and weighted average of 6.0%, a difference of 27.8%.
Disability Age 18 to 34 Correlation Summary
| Measurement | White/Caucasian | Salvadoran |
| Minimum | 5.4% | 0.22% |
| Maximum | 11.2% | 19.5% |
| Range | 5.8% | 19.3% |
| Mean | 7.4% | 5.7% |
| Median | 7.3% | 5.7% |
| Interquartile 25% (IQ1) | 6.6% | 4.2% |
| Interquartile 75% (IQ3) | 8.0% | 6.5% |
| Interquartile Range (IQR) | 1.3% | 2.2% |
| Standard Deviation (Sample) | 1.0% | 2.4% |
| Standard Deviation (Population) | 1.0% | 2.4% |
Similar Demographics by Disability Age 18 to 34
Demographics Similar to Whites/Caucasians by Disability Age 18 to 34
In terms of disability age 18 to 34, the demographic groups most similar to Whites/Caucasians are Norwegian (7.6%, a difference of 0.090%), Nonimmigrants (7.6%, a difference of 0.12%), Slovak (7.7%, a difference of 0.21%), Irish (7.7%, a difference of 0.26%), and Celtic (7.6%, a difference of 0.37%).
| Demographics | Rating | Rank | Disability Age 18 to 34 |
| Paiute | 0.0 /100 | #281 | Tragic 7.5% |
| Spanish | 0.0 /100 | #282 | Tragic 7.5% |
| Danes | 0.0 /100 | #283 | Tragic 7.5% |
| Hopi | 0.0 /100 | #284 | Tragic 7.5% |
| Swedes | 0.0 /100 | #285 | Tragic 7.5% |
| Celtics | 0.0 /100 | #286 | Tragic 7.6% |
| Norwegians | 0.0 /100 | #287 | Tragic 7.6% |
| Whites/Caucasians | 0.0 /100 | #288 | Tragic 7.6% |
| Immigrants | Nonimmigrants | 0.0 /100 | #289 | Tragic 7.6% |
| Slovaks | 0.0 /100 | #290 | Tragic 7.7% |
| Irish | 0.0 /100 | #291 | Tragic 7.7% |
| Blacks/African Americans | 0.0 /100 | #292 | Tragic 7.7% |
| Scandinavians | 0.0 /100 | #293 | Tragic 7.7% |
| Immigrants | Cabo Verde | 0.0 /100 | #294 | Tragic 7.7% |
| Tlingit-Haida | 0.0 /100 | #295 | Tragic 7.7% |
Demographics Similar to Salvadorans by Disability Age 18 to 34
In terms of disability age 18 to 34, the demographic groups most similar to Salvadorans are Taiwanese (6.0%, a difference of 0.010%), Peruvian (6.0%, a difference of 0.050%), British West Indian (6.0%, a difference of 0.080%), Trinidadian and Tobagonian (6.0%, a difference of 0.15%), and Burmese (6.0%, a difference of 0.29%).
| Demographics | Rating | Rank | Disability Age 18 to 34 |
| Paraguayans | 99.7 /100 | #56 | Exceptional 5.9% |
| Immigrants | Haiti | 99.7 /100 | #57 | Exceptional 5.9% |
| Immigrants | Serbia | 99.7 /100 | #58 | Exceptional 5.9% |
| Immigrants | Caribbean | 99.6 /100 | #59 | Exceptional 6.0% |
| Immigrants | Sri Lanka | 99.6 /100 | #60 | Exceptional 6.0% |
| British West Indians | 99.6 /100 | #61 | Exceptional 6.0% |
| Peruvians | 99.6 /100 | #62 | Exceptional 6.0% |
| Salvadorans | 99.6 /100 | #63 | Exceptional 6.0% |
| Taiwanese | 99.6 /100 | #64 | Exceptional 6.0% |
| Trinidadians and Tobagonians | 99.5 /100 | #65 | Exceptional 6.0% |
| Burmese | 99.5 /100 | #66 | Exceptional 6.0% |
| Immigrants | North Macedonia | 99.5 /100 | #67 | Exceptional 6.0% |
| Immigrants | Poland | 99.5 /100 | #68 | Exceptional 6.0% |
| Immigrants | West Indies | 99.4 /100 | #69 | Exceptional 6.0% |
| Immigrants | Greece | 99.4 /100 | #70 | Exceptional 6.0% |