White/Caucasian vs Filipino Disability Age 18 to 34
COMPARE
White/Caucasian
Filipino
Disability Age 18 to 34
Disability Age 18 to 34 Comparison
Whites/Caucasians
Filipinos
7.6%
DISABILITY AGE 18 TO 34
0.0/ 100
METRIC RATING
288th/ 347
METRIC RANK
5.4%
DISABILITY AGE 18 TO 34
100.0/ 100
METRIC RATING
6th/ 347
METRIC RANK
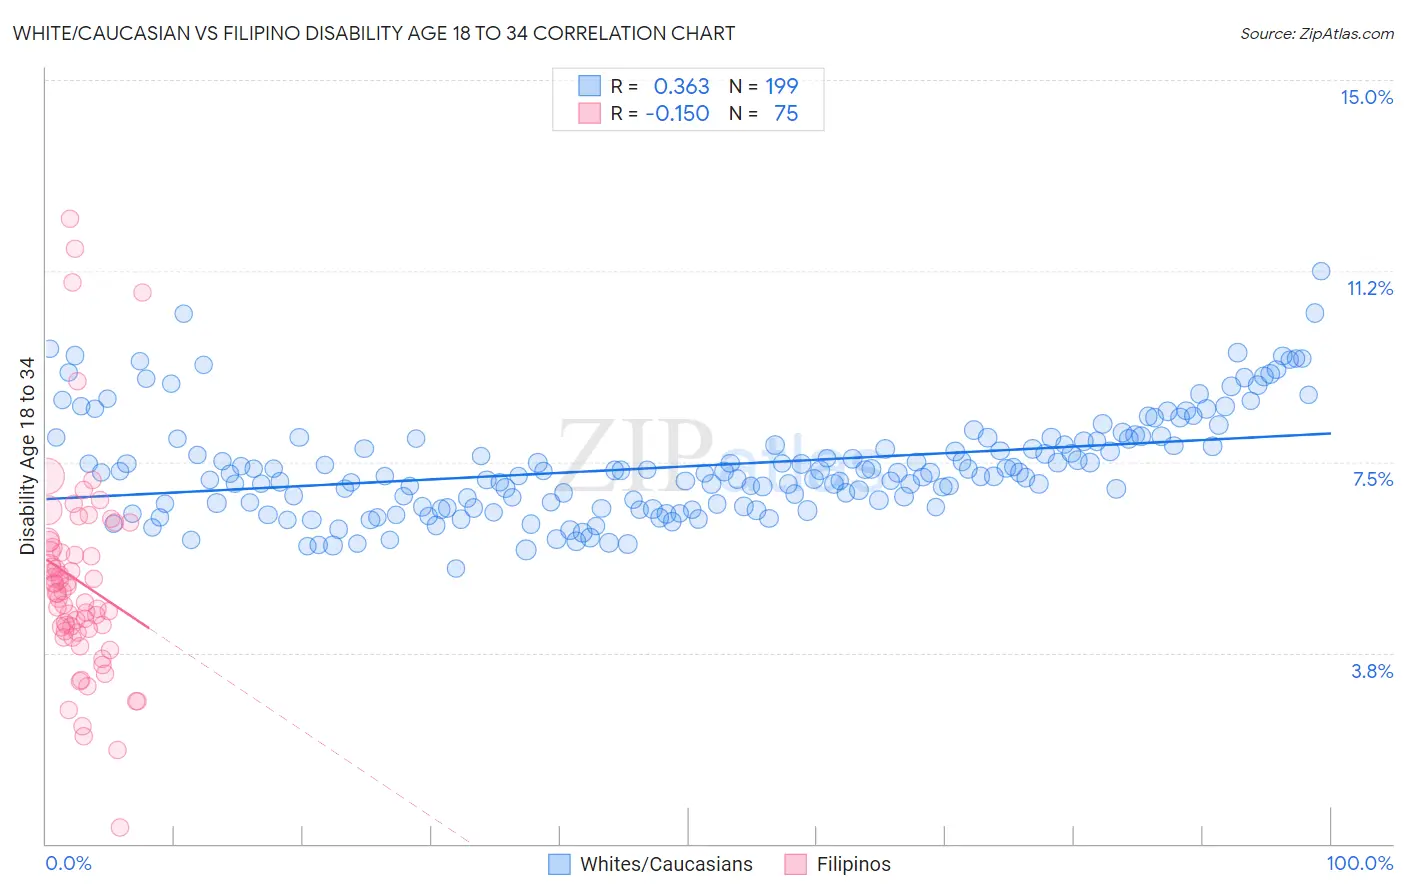
White/Caucasian vs Filipino Disability Age 18 to 34 Correlation Chart
The statistical analysis conducted on geographies consisting of 575,670,082 people shows a mild positive correlation between the proportion of Whites/Caucasians and percentage of population with a disability between the ages 18 and 35 in the United States with a correlation coefficient (R) of 0.363 and weighted average of 7.6%. Similarly, the statistical analysis conducted on geographies consisting of 253,991,143 people shows a poor negative correlation between the proportion of Filipinos and percentage of population with a disability between the ages 18 and 35 in the United States with a correlation coefficient (R) of -0.150 and weighted average of 5.4%, a difference of 40.3%.
Disability Age 18 to 34 Correlation Summary
| Measurement | White/Caucasian | Filipino |
| Minimum | 5.4% | 0.31% |
| Maximum | 11.2% | 12.3% |
| Range | 5.8% | 12.0% |
| Mean | 7.4% | 5.2% |
| Median | 7.3% | 4.9% |
| Interquartile 25% (IQ1) | 6.6% | 4.2% |
| Interquartile 75% (IQ3) | 8.0% | 5.8% |
| Interquartile Range (IQR) | 1.3% | 1.6% |
| Standard Deviation (Sample) | 1.0% | 2.0% |
| Standard Deviation (Population) | 1.0% | 2.0% |
Similar Demographics by Disability Age 18 to 34
Demographics Similar to Whites/Caucasians by Disability Age 18 to 34
In terms of disability age 18 to 34, the demographic groups most similar to Whites/Caucasians are Norwegian (7.6%, a difference of 0.090%), Nonimmigrants (7.6%, a difference of 0.12%), Slovak (7.7%, a difference of 0.21%), Irish (7.7%, a difference of 0.26%), and Celtic (7.6%, a difference of 0.37%).
| Demographics | Rating | Rank | Disability Age 18 to 34 |
| Paiute | 0.0 /100 | #281 | Tragic 7.5% |
| Spanish | 0.0 /100 | #282 | Tragic 7.5% |
| Danes | 0.0 /100 | #283 | Tragic 7.5% |
| Hopi | 0.0 /100 | #284 | Tragic 7.5% |
| Swedes | 0.0 /100 | #285 | Tragic 7.5% |
| Celtics | 0.0 /100 | #286 | Tragic 7.6% |
| Norwegians | 0.0 /100 | #287 | Tragic 7.6% |
| Whites/Caucasians | 0.0 /100 | #288 | Tragic 7.6% |
| Immigrants | Nonimmigrants | 0.0 /100 | #289 | Tragic 7.6% |
| Slovaks | 0.0 /100 | #290 | Tragic 7.7% |
| Irish | 0.0 /100 | #291 | Tragic 7.7% |
| Blacks/African Americans | 0.0 /100 | #292 | Tragic 7.7% |
| Scandinavians | 0.0 /100 | #293 | Tragic 7.7% |
| Immigrants | Cabo Verde | 0.0 /100 | #294 | Tragic 7.7% |
| Tlingit-Haida | 0.0 /100 | #295 | Tragic 7.7% |
Demographics Similar to Filipinos by Disability Age 18 to 34
In terms of disability age 18 to 34, the demographic groups most similar to Filipinos are Immigrants from China (5.4%, a difference of 0.070%), Immigrants from Guyana (5.5%, a difference of 0.64%), Guyanese (5.5%, a difference of 1.1%), Immigrants from Taiwan (5.4%, a difference of 1.3%), and Immigrants from Uzbekistan (5.5%, a difference of 1.3%).
| Demographics | Rating | Rank | Disability Age 18 to 34 |
| Immigrants | Armenia | 100.0 /100 | #1 | Exceptional 5.0% |
| Immigrants | Hong Kong | 100.0 /100 | #2 | Exceptional 5.2% |
| Immigrants | Grenada | 100.0 /100 | #3 | Exceptional 5.3% |
| Immigrants | Cuba | 100.0 /100 | #4 | Exceptional 5.4% |
| Immigrants | Taiwan | 100.0 /100 | #5 | Exceptional 5.4% |
| Filipinos | 100.0 /100 | #6 | Exceptional 5.4% |
| Immigrants | China | 100.0 /100 | #7 | Exceptional 5.4% |
| Immigrants | Guyana | 100.0 /100 | #8 | Exceptional 5.5% |
| Guyanese | 100.0 /100 | #9 | Exceptional 5.5% |
| Immigrants | Uzbekistan | 100.0 /100 | #10 | Exceptional 5.5% |
| Vietnamese | 100.0 /100 | #11 | Exceptional 5.5% |
| Immigrants | St. Vincent and the Grenadines | 100.0 /100 | #12 | Exceptional 5.5% |
| Immigrants | Iran | 100.0 /100 | #13 | Exceptional 5.5% |
| Indians (Asian) | 100.0 /100 | #14 | Exceptional 5.5% |
| Immigrants | India | 100.0 /100 | #15 | Exceptional 5.6% |