White/Caucasian vs Spanish American Disability Age 18 to 34
COMPARE
White/Caucasian
Spanish American
Disability Age 18 to 34
Disability Age 18 to 34 Comparison
Whites/Caucasians
Spanish Americans
7.6%
DISABILITY AGE 18 TO 34
0.0/ 100
METRIC RATING
288th/ 347
METRIC RANK
7.9%
DISABILITY AGE 18 TO 34
0.0/ 100
METRIC RATING
312th/ 347
METRIC RANK
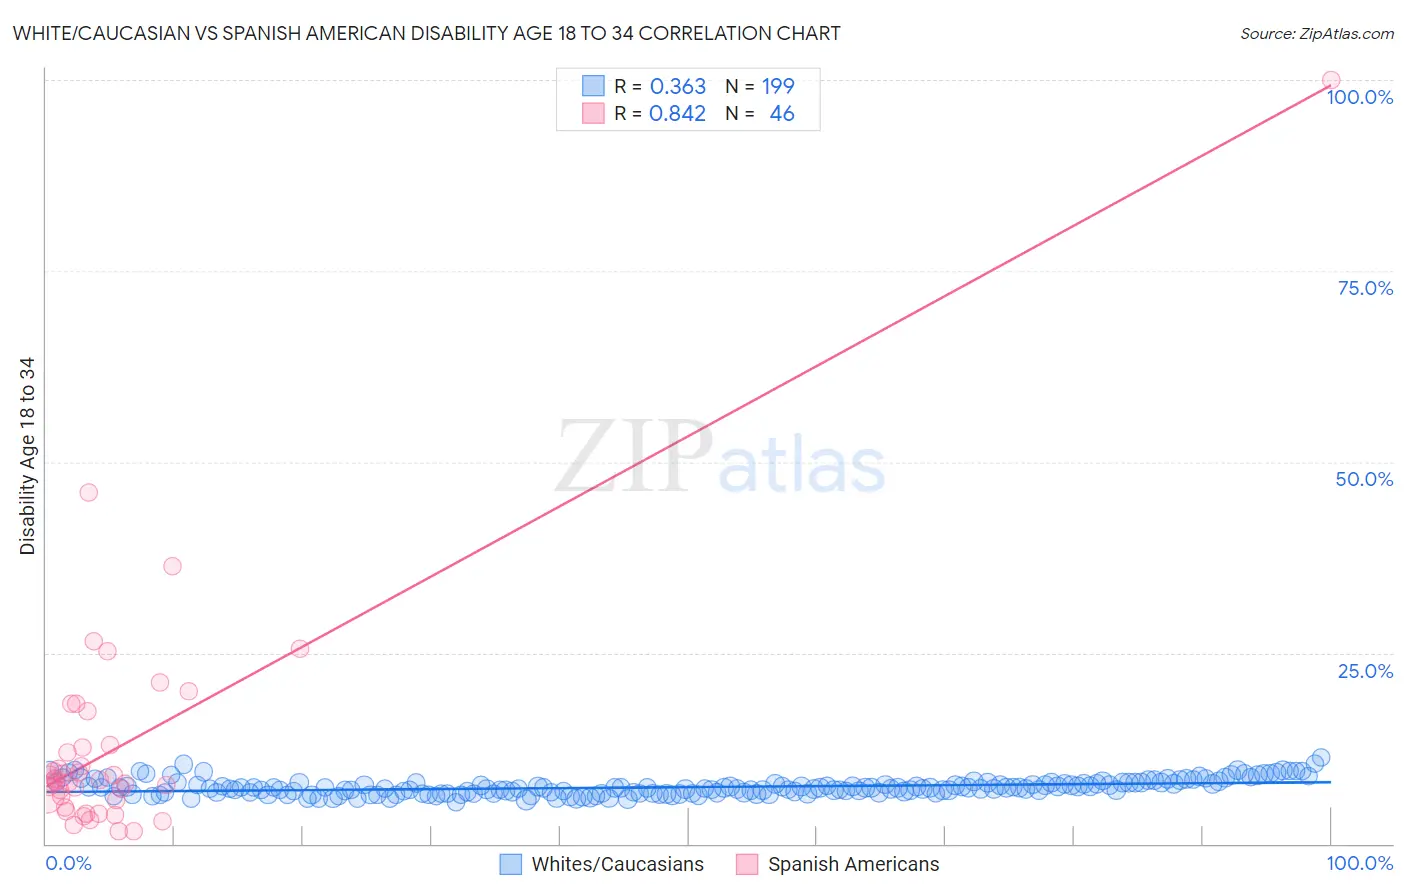
White/Caucasian vs Spanish American Disability Age 18 to 34 Correlation Chart
The statistical analysis conducted on geographies consisting of 575,670,082 people shows a mild positive correlation between the proportion of Whites/Caucasians and percentage of population with a disability between the ages 18 and 35 in the United States with a correlation coefficient (R) of 0.363 and weighted average of 7.6%. Similarly, the statistical analysis conducted on geographies consisting of 103,121,849 people shows a very strong positive correlation between the proportion of Spanish Americans and percentage of population with a disability between the ages 18 and 35 in the United States with a correlation coefficient (R) of 0.842 and weighted average of 7.9%, a difference of 3.4%.
Disability Age 18 to 34 Correlation Summary
| Measurement | White/Caucasian | Spanish American |
| Minimum | 5.4% | 1.6% |
| Maximum | 11.2% | 100.0% |
| Range | 5.8% | 98.4% |
| Mean | 7.4% | 13.0% |
| Median | 7.3% | 8.3% |
| Interquartile 25% (IQ1) | 6.6% | 5.8% |
| Interquartile 75% (IQ3) | 8.0% | 13.0% |
| Interquartile Range (IQR) | 1.3% | 7.2% |
| Standard Deviation (Sample) | 1.0% | 16.0% |
| Standard Deviation (Population) | 1.0% | 15.8% |
Similar Demographics by Disability Age 18 to 34
Demographics Similar to Whites/Caucasians by Disability Age 18 to 34
In terms of disability age 18 to 34, the demographic groups most similar to Whites/Caucasians are Norwegian (7.6%, a difference of 0.090%), Nonimmigrants (7.6%, a difference of 0.12%), Slovak (7.7%, a difference of 0.21%), Irish (7.7%, a difference of 0.26%), and Celtic (7.6%, a difference of 0.37%).
| Demographics | Rating | Rank | Disability Age 18 to 34 |
| Paiute | 0.0 /100 | #281 | Tragic 7.5% |
| Spanish | 0.0 /100 | #282 | Tragic 7.5% |
| Danes | 0.0 /100 | #283 | Tragic 7.5% |
| Hopi | 0.0 /100 | #284 | Tragic 7.5% |
| Swedes | 0.0 /100 | #285 | Tragic 7.5% |
| Celtics | 0.0 /100 | #286 | Tragic 7.6% |
| Norwegians | 0.0 /100 | #287 | Tragic 7.6% |
| Whites/Caucasians | 0.0 /100 | #288 | Tragic 7.6% |
| Immigrants | Nonimmigrants | 0.0 /100 | #289 | Tragic 7.6% |
| Slovaks | 0.0 /100 | #290 | Tragic 7.7% |
| Irish | 0.0 /100 | #291 | Tragic 7.7% |
| Blacks/African Americans | 0.0 /100 | #292 | Tragic 7.7% |
| Scandinavians | 0.0 /100 | #293 | Tragic 7.7% |
| Immigrants | Cabo Verde | 0.0 /100 | #294 | Tragic 7.7% |
| Tlingit-Haida | 0.0 /100 | #295 | Tragic 7.7% |
Demographics Similar to Spanish Americans by Disability Age 18 to 34
In terms of disability age 18 to 34, the demographic groups most similar to Spanish Americans are Iroquois (7.9%, a difference of 0.040%), French (7.9%, a difference of 0.36%), Colville (7.9%, a difference of 0.48%), Finnish (7.8%, a difference of 1.1%), and Alaska Native (7.8%, a difference of 1.2%).
| Demographics | Rating | Rank | Disability Age 18 to 34 |
| Menominee | 0.0 /100 | #305 | Tragic 7.8% |
| English | 0.0 /100 | #306 | Tragic 7.8% |
| Scotch-Irish | 0.0 /100 | #307 | Tragic 7.8% |
| Pennsylvania Germans | 0.0 /100 | #308 | Tragic 7.8% |
| Alaska Natives | 0.0 /100 | #309 | Tragic 7.8% |
| Finns | 0.0 /100 | #310 | Tragic 7.8% |
| French | 0.0 /100 | #311 | Tragic 7.9% |
| Spanish Americans | 0.0 /100 | #312 | Tragic 7.9% |
| Iroquois | 0.0 /100 | #313 | Tragic 7.9% |
| Colville | 0.0 /100 | #314 | Tragic 7.9% |
| Americans | 0.0 /100 | #315 | Tragic 8.0% |
| Puerto Ricans | 0.0 /100 | #316 | Tragic 8.0% |
| Hmong | 0.0 /100 | #317 | Tragic 8.1% |
| French Canadians | 0.0 /100 | #318 | Tragic 8.1% |
| Aleuts | 0.0 /100 | #319 | Tragic 8.1% |