White/Caucasian vs Okinawan Disability Age 18 to 34
COMPARE
White/Caucasian
Okinawan
Disability Age 18 to 34
Disability Age 18 to 34 Comparison
Whites/Caucasians
Okinawans
7.6%
DISABILITY AGE 18 TO 34
0.0/ 100
METRIC RATING
288th/ 347
METRIC RANK
5.9%
DISABILITY AGE 18 TO 34
99.7/ 100
METRIC RATING
52nd/ 347
METRIC RANK
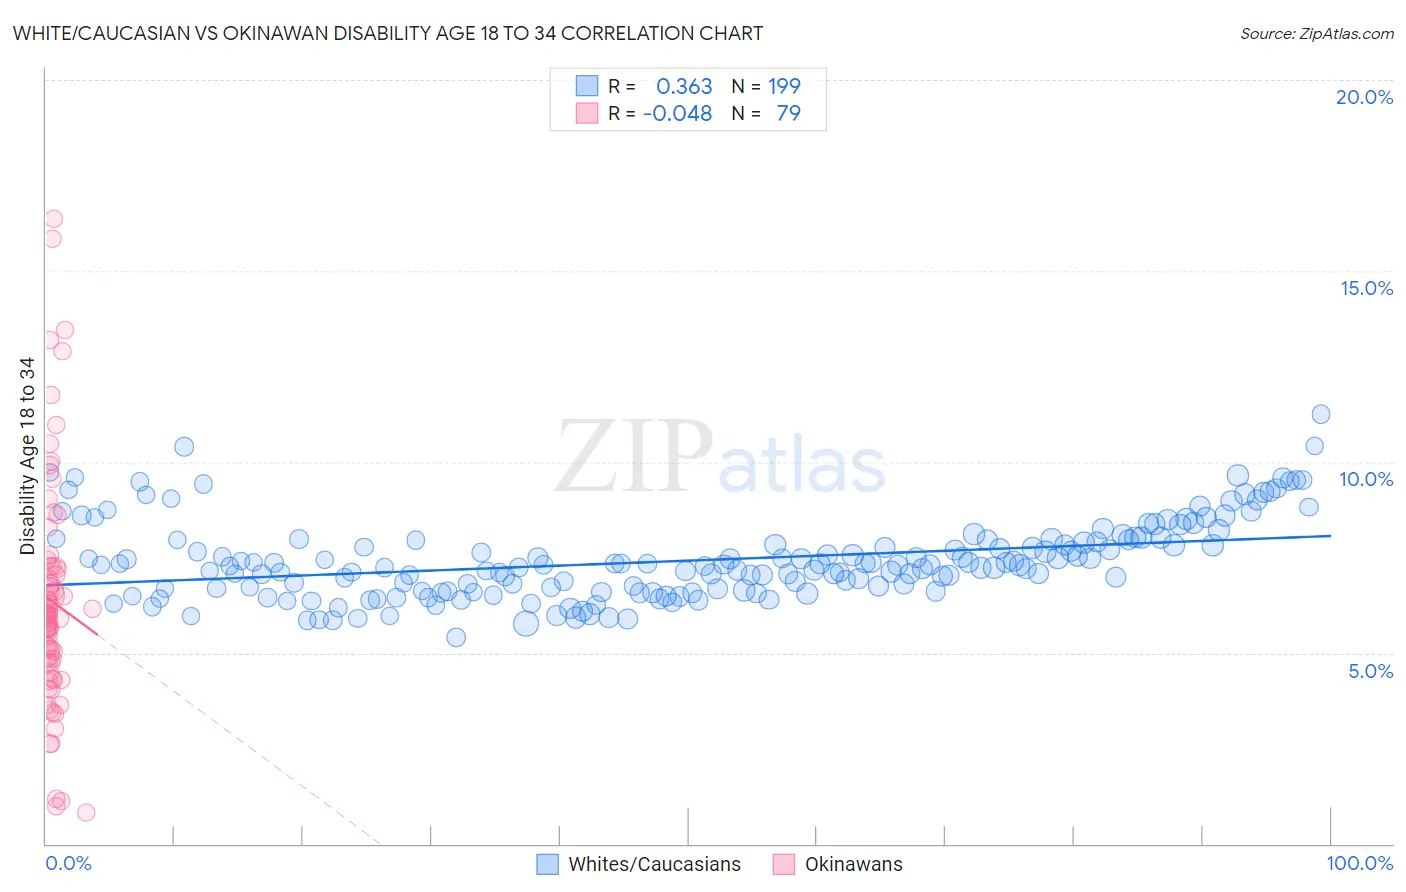
White/Caucasian vs Okinawan Disability Age 18 to 34 Correlation Chart
The statistical analysis conducted on geographies consisting of 575,670,082 people shows a mild positive correlation between the proportion of Whites/Caucasians and percentage of population with a disability between the ages 18 and 35 in the United States with a correlation coefficient (R) of 0.363 and weighted average of 7.6%. Similarly, the statistical analysis conducted on geographies consisting of 73,761,709 people shows no correlation between the proportion of Okinawans and percentage of population with a disability between the ages 18 and 35 in the United States with a correlation coefficient (R) of -0.048 and weighted average of 5.9%, a difference of 29.1%.
Disability Age 18 to 34 Correlation Summary
| Measurement | White/Caucasian | Okinawan |
| Minimum | 5.4% | 0.81% |
| Maximum | 11.2% | 16.4% |
| Range | 5.8% | 15.6% |
| Mean | 7.4% | 6.3% |
| Median | 7.3% | 6.0% |
| Interquartile 25% (IQ1) | 6.6% | 4.7% |
| Interquartile 75% (IQ3) | 8.0% | 7.3% |
| Interquartile Range (IQR) | 1.3% | 2.5% |
| Standard Deviation (Sample) | 1.0% | 3.0% |
| Standard Deviation (Population) | 1.0% | 3.0% |
Similar Demographics by Disability Age 18 to 34
Demographics Similar to Whites/Caucasians by Disability Age 18 to 34
In terms of disability age 18 to 34, the demographic groups most similar to Whites/Caucasians are Norwegian (7.6%, a difference of 0.090%), Nonimmigrants (7.6%, a difference of 0.12%), Slovak (7.7%, a difference of 0.21%), Irish (7.7%, a difference of 0.26%), and Celtic (7.6%, a difference of 0.37%).
| Demographics | Rating | Rank | Disability Age 18 to 34 |
| Paiute | 0.0 /100 | #281 | Tragic 7.5% |
| Spanish | 0.0 /100 | #282 | Tragic 7.5% |
| Danes | 0.0 /100 | #283 | Tragic 7.5% |
| Hopi | 0.0 /100 | #284 | Tragic 7.5% |
| Swedes | 0.0 /100 | #285 | Tragic 7.5% |
| Celtics | 0.0 /100 | #286 | Tragic 7.6% |
| Norwegians | 0.0 /100 | #287 | Tragic 7.6% |
| Whites/Caucasians | 0.0 /100 | #288 | Tragic 7.6% |
| Immigrants | Nonimmigrants | 0.0 /100 | #289 | Tragic 7.6% |
| Slovaks | 0.0 /100 | #290 | Tragic 7.7% |
| Irish | 0.0 /100 | #291 | Tragic 7.7% |
| Blacks/African Americans | 0.0 /100 | #292 | Tragic 7.7% |
| Scandinavians | 0.0 /100 | #293 | Tragic 7.7% |
| Immigrants | Cabo Verde | 0.0 /100 | #294 | Tragic 7.7% |
| Tlingit-Haida | 0.0 /100 | #295 | Tragic 7.7% |
Demographics Similar to Okinawans by Disability Age 18 to 34
In terms of disability age 18 to 34, the demographic groups most similar to Okinawans are Egyptian (5.9%, a difference of 0.13%), Immigrants from El Salvador (5.9%, a difference of 0.14%), Immigrants from Indonesia (5.9%, a difference of 0.14%), Immigrants from Belarus (5.9%, a difference of 0.18%), and Immigrants from Malaysia (5.9%, a difference of 0.19%).
| Demographics | Rating | Rank | Disability Age 18 to 34 |
| Immigrants | Peru | 99.8 /100 | #45 | Exceptional 5.9% |
| Immigrants | Korea | 99.8 /100 | #46 | Exceptional 5.9% |
| Immigrants | Egypt | 99.8 /100 | #47 | Exceptional 5.9% |
| Immigrants | Trinidad and Tobago | 99.8 /100 | #48 | Exceptional 5.9% |
| Immigrants | Belarus | 99.8 /100 | #49 | Exceptional 5.9% |
| Immigrants | El Salvador | 99.8 /100 | #50 | Exceptional 5.9% |
| Egyptians | 99.8 /100 | #51 | Exceptional 5.9% |
| Okinawans | 99.7 /100 | #52 | Exceptional 5.9% |
| Immigrants | Indonesia | 99.7 /100 | #53 | Exceptional 5.9% |
| Immigrants | Malaysia | 99.7 /100 | #54 | Exceptional 5.9% |
| Immigrants | Spain | 99.7 /100 | #55 | Exceptional 5.9% |
| Paraguayans | 99.7 /100 | #56 | Exceptional 5.9% |
| Immigrants | Haiti | 99.7 /100 | #57 | Exceptional 5.9% |
| Immigrants | Serbia | 99.7 /100 | #58 | Exceptional 5.9% |
| Immigrants | Caribbean | 99.6 /100 | #59 | Exceptional 6.0% |