White/Caucasian vs Uruguayan Disability Age 18 to 34
COMPARE
White/Caucasian
Uruguayan
Disability Age 18 to 34
Disability Age 18 to 34 Comparison
Whites/Caucasians
Uruguayans
7.6%
DISABILITY AGE 18 TO 34
0.0/ 100
METRIC RATING
288th/ 347
METRIC RANK
6.2%
DISABILITY AGE 18 TO 34
97.3/ 100
METRIC RATING
97th/ 347
METRIC RANK
White/Caucasian vs Uruguayan Disability Age 18 to 34 Correlation Chart
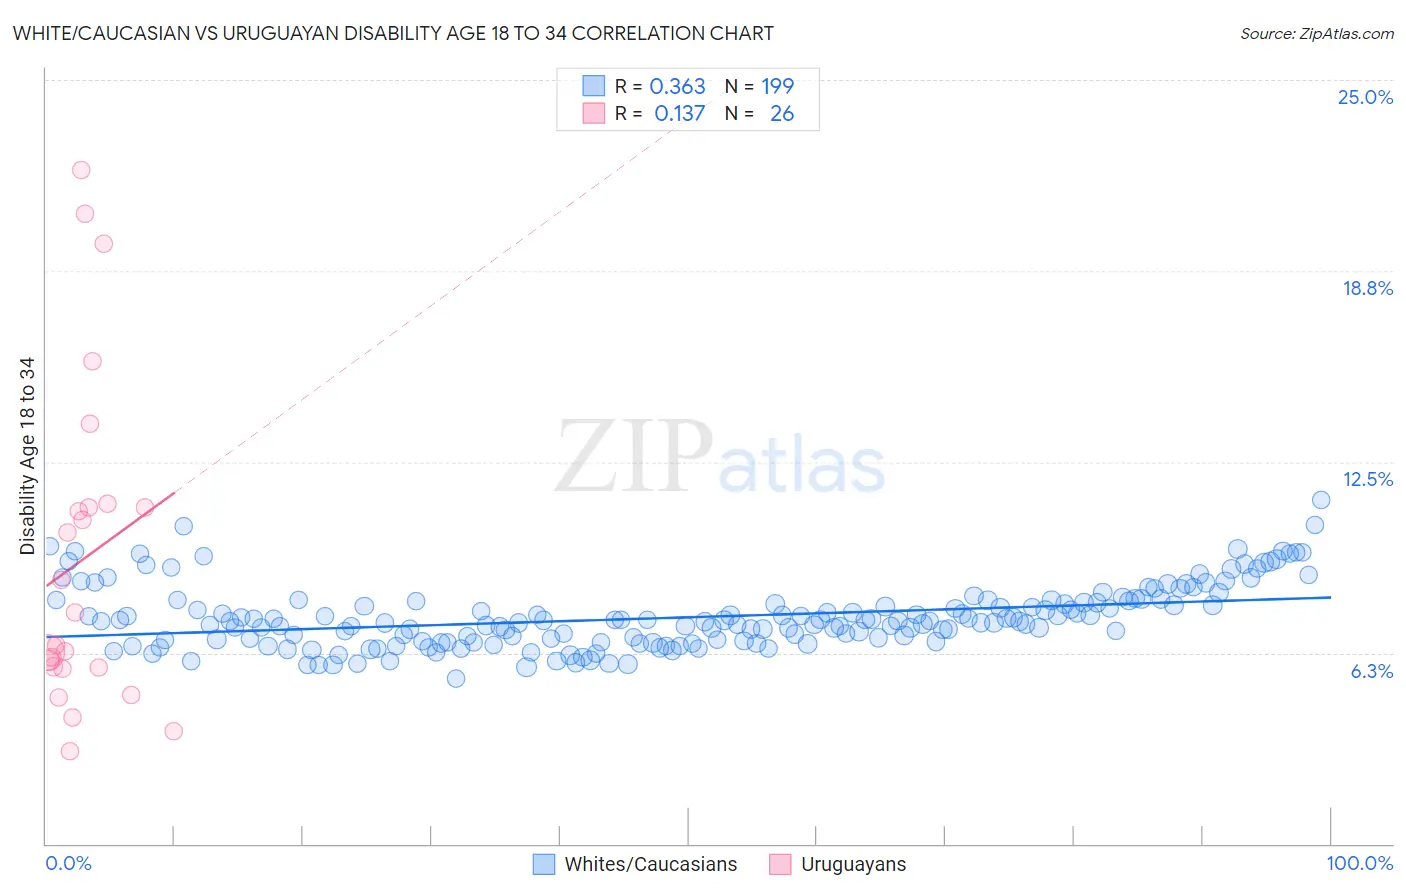
The statistical analysis conducted on geographies consisting of 575,670,082 people shows a mild positive correlation between the proportion of Whites/Caucasians and percentage of population with a disability between the ages 18 and 35 in the United States with a correlation coefficient (R) of 0.363 and weighted average of 7.6%. Similarly, the statistical analysis conducted on geographies consisting of 144,733,495 people shows a poor positive correlation between the proportion of Uruguayans and percentage of population with a disability between the ages 18 and 35 in the United States with a correlation coefficient (R) of 0.137 and weighted average of 6.2%, a difference of 23.4%.
Disability Age 18 to 34 Correlation Summary
| Measurement | White/Caucasian | Uruguayan |
| Minimum | 5.4% | 3.0% |
| Maximum | 11.2% | 22.1% |
| Range | 5.8% | 19.0% |
| Mean | 7.4% | 9.3% |
| Median | 7.3% | 7.0% |
| Interquartile 25% (IQ1) | 6.6% | 5.8% |
| Interquartile 75% (IQ3) | 8.0% | 11.0% |
| Interquartile Range (IQR) | 1.3% | 5.2% |
| Standard Deviation (Sample) | 1.0% | 5.3% |
| Standard Deviation (Population) | 1.0% | 5.2% |
Similar Demographics by Disability Age 18 to 34
Demographics Similar to Whites/Caucasians by Disability Age 18 to 34
In terms of disability age 18 to 34, the demographic groups most similar to Whites/Caucasians are Norwegian (7.6%, a difference of 0.090%), Nonimmigrants (7.6%, a difference of 0.12%), Slovak (7.7%, a difference of 0.21%), Irish (7.7%, a difference of 0.26%), and Celtic (7.6%, a difference of 0.37%).
| Demographics | Rating | Rank | Disability Age 18 to 34 |
| Paiute | 0.0 /100 | #281 | Tragic 7.5% |
| Spanish | 0.0 /100 | #282 | Tragic 7.5% |
| Danes | 0.0 /100 | #283 | Tragic 7.5% |
| Hopi | 0.0 /100 | #284 | Tragic 7.5% |
| Swedes | 0.0 /100 | #285 | Tragic 7.5% |
| Celtics | 0.0 /100 | #286 | Tragic 7.6% |
| Norwegians | 0.0 /100 | #287 | Tragic 7.6% |
| Whites/Caucasians | 0.0 /100 | #288 | Tragic 7.6% |
| Immigrants | Nonimmigrants | 0.0 /100 | #289 | Tragic 7.6% |
| Slovaks | 0.0 /100 | #290 | Tragic 7.7% |
| Irish | 0.0 /100 | #291 | Tragic 7.7% |
| Blacks/African Americans | 0.0 /100 | #292 | Tragic 7.7% |
| Scandinavians | 0.0 /100 | #293 | Tragic 7.7% |
| Immigrants | Cabo Verde | 0.0 /100 | #294 | Tragic 7.7% |
| Tlingit-Haida | 0.0 /100 | #295 | Tragic 7.7% |
Demographics Similar to Uruguayans by Disability Age 18 to 34
In terms of disability age 18 to 34, the demographic groups most similar to Uruguayans are Immigrants from Syria (6.2%, a difference of 0.040%), Immigrants from Uruguay (6.2%, a difference of 0.080%), Central American (6.2%, a difference of 0.13%), Immigrants from Kazakhstan (6.2%, a difference of 0.16%), and Immigrants (6.2%, a difference of 0.21%).
| Demographics | Rating | Rank | Disability Age 18 to 34 |
| Immigrants | Vietnam | 97.7 /100 | #90 | Exceptional 6.2% |
| Immigrants | Philippines | 97.6 /100 | #91 | Exceptional 6.2% |
| Jordanians | 97.6 /100 | #92 | Exceptional 6.2% |
| Immigrants | Immigrants | 97.6 /100 | #93 | Exceptional 6.2% |
| Immigrants | Kazakhstan | 97.5 /100 | #94 | Exceptional 6.2% |
| Central Americans | 97.5 /100 | #95 | Exceptional 6.2% |
| Immigrants | Uruguay | 97.4 /100 | #96 | Exceptional 6.2% |
| Uruguayans | 97.3 /100 | #97 | Exceptional 6.2% |
| Immigrants | Syria | 97.2 /100 | #98 | Exceptional 6.2% |
| Immigrants | Ethiopia | 96.9 /100 | #99 | Exceptional 6.2% |
| Immigrants | Albania | 96.7 /100 | #100 | Exceptional 6.2% |
| Immigrants | Jamaica | 96.4 /100 | #101 | Exceptional 6.2% |
| Laotians | 96.4 /100 | #102 | Exceptional 6.2% |
| Immigrants | Bulgaria | 96.3 /100 | #103 | Exceptional 6.2% |
| Mongolians | 96.2 /100 | #104 | Exceptional 6.2% |