Jamaican vs Immigrants from Chile Female Disability
COMPARE
Jamaican
Immigrants from Chile
Female Disability
Female Disability Comparison
Jamaicans
Immigrants from Chile
12.7%
FEMALE DISABILITY
1.4/ 100
METRIC RATING
253rd/ 347
METRIC RANK
11.5%
FEMALE DISABILITY
99.8/ 100
METRIC RATING
70th/ 347
METRIC RANK
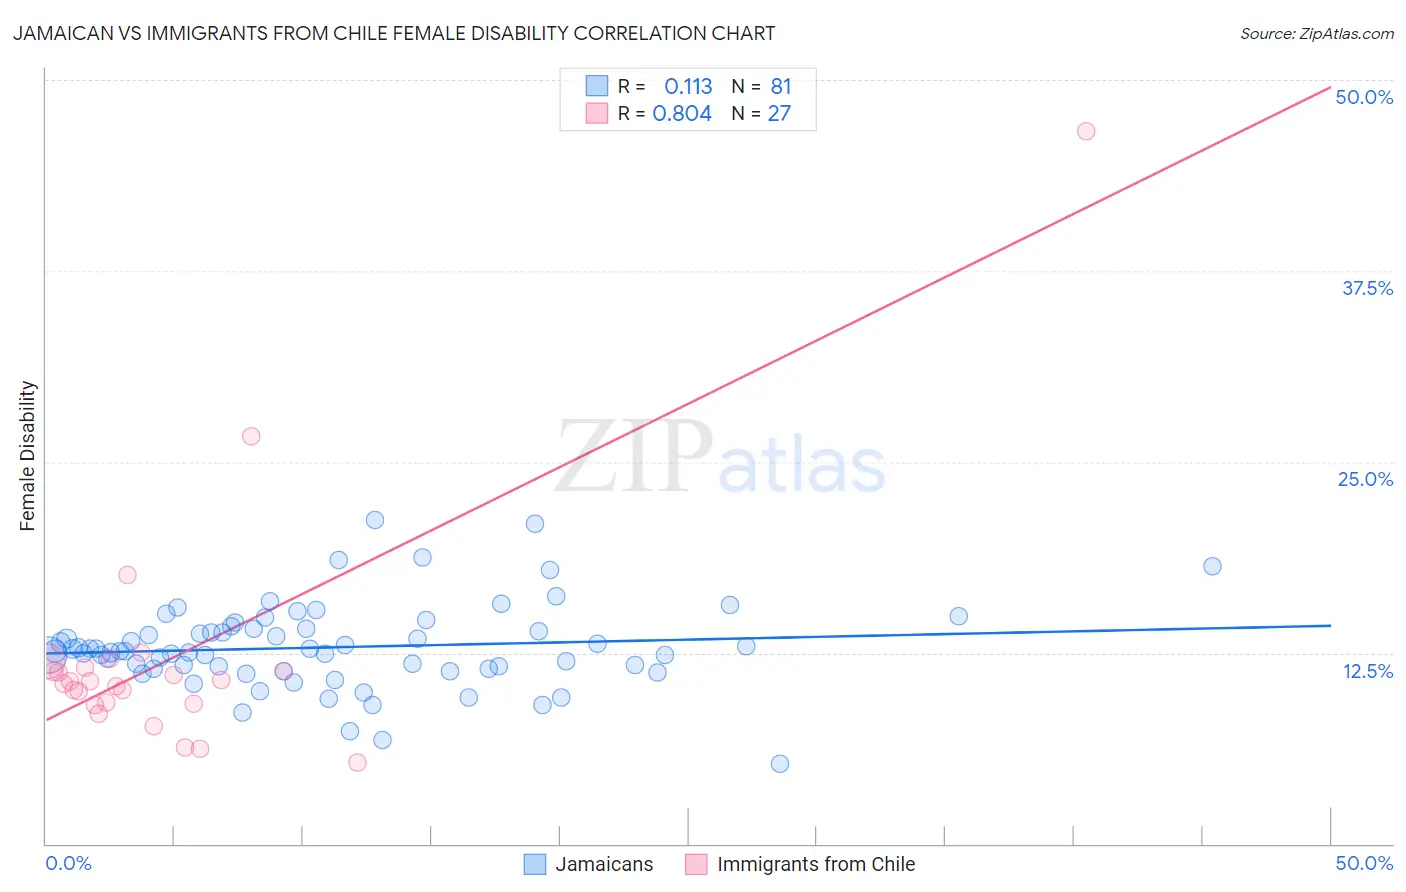
Jamaican vs Immigrants from Chile Female Disability Correlation Chart
The statistical analysis conducted on geographies consisting of 367,961,325 people shows a poor positive correlation between the proportion of Jamaicans and percentage of females with a disability in the United States with a correlation coefficient (R) of 0.113 and weighted average of 12.7%. Similarly, the statistical analysis conducted on geographies consisting of 218,627,850 people shows a very strong positive correlation between the proportion of Immigrants from Chile and percentage of females with a disability in the United States with a correlation coefficient (R) of 0.804 and weighted average of 11.5%, a difference of 10.5%.
Female Disability Correlation Summary
| Measurement | Jamaican | Immigrants from Chile |
| Minimum | 5.2% | 5.3% |
| Maximum | 21.2% | 46.7% |
| Range | 16.0% | 41.4% |
| Mean | 12.9% | 12.2% |
| Median | 12.6% | 10.6% |
| Interquartile 25% (IQ1) | 11.5% | 9.2% |
| Interquartile 75% (IQ3) | 14.1% | 11.5% |
| Interquartile Range (IQR) | 2.6% | 2.3% |
| Standard Deviation (Sample) | 2.8% | 7.9% |
| Standard Deviation (Population) | 2.7% | 7.8% |
Similar Demographics by Female Disability
Demographics Similar to Jamaicans by Female Disability
In terms of female disability, the demographic groups most similar to Jamaicans are Immigrants from Caribbean (12.7%, a difference of 0.010%), Hawaiian (12.7%, a difference of 0.030%), Crow (12.7%, a difference of 0.090%), Immigrants from Germany (12.7%, a difference of 0.11%), and Slovene (12.7%, a difference of 0.15%).
| Demographics | Rating | Rank | Female Disability |
| Spanish American Indians | 2.1 /100 | #246 | Tragic 12.6% |
| Menominee | 2.1 /100 | #247 | Tragic 12.6% |
| Carpatho Rusyns | 2.0 /100 | #248 | Tragic 12.6% |
| Immigrants | Congo | 1.8 /100 | #249 | Tragic 12.7% |
| Slovenes | 1.7 /100 | #250 | Tragic 12.7% |
| Crow | 1.6 /100 | #251 | Tragic 12.7% |
| Immigrants | Caribbean | 1.4 /100 | #252 | Tragic 12.7% |
| Jamaicans | 1.4 /100 | #253 | Tragic 12.7% |
| Hawaiians | 1.4 /100 | #254 | Tragic 12.7% |
| Immigrants | Germany | 1.3 /100 | #255 | Tragic 12.7% |
| British West Indians | 1.2 /100 | #256 | Tragic 12.7% |
| Liberians | 1.1 /100 | #257 | Tragic 12.7% |
| Aleuts | 1.1 /100 | #258 | Tragic 12.7% |
| Immigrants | Armenia | 1.0 /100 | #259 | Tragic 12.7% |
| Sub-Saharan Africans | 1.0 /100 | #260 | Tragic 12.7% |
Demographics Similar to Immigrants from Chile by Female Disability
In terms of female disability, the demographic groups most similar to Immigrants from Chile are Colombian (11.5%, a difference of 0.010%), Immigrants from Ireland (11.5%, a difference of 0.040%), Immigrants from Northern Africa (11.5%, a difference of 0.080%), Immigrants from Vietnam (11.5%, a difference of 0.10%), and Chilean (11.5%, a difference of 0.11%).
| Demographics | Rating | Rank | Female Disability |
| Immigrants | Colombia | 99.9 /100 | #63 | Exceptional 11.4% |
| Immigrants | El Salvador | 99.9 /100 | #64 | Exceptional 11.4% |
| Immigrants | South America | 99.9 /100 | #65 | Exceptional 11.4% |
| Salvadorans | 99.8 /100 | #66 | Exceptional 11.5% |
| Immigrants | Vietnam | 99.8 /100 | #67 | Exceptional 11.5% |
| Immigrants | Northern Africa | 99.8 /100 | #68 | Exceptional 11.5% |
| Colombians | 99.8 /100 | #69 | Exceptional 11.5% |
| Immigrants | Chile | 99.8 /100 | #70 | Exceptional 11.5% |
| Immigrants | Ireland | 99.8 /100 | #71 | Exceptional 11.5% |
| Chileans | 99.8 /100 | #72 | Exceptional 11.5% |
| Immigrants | Switzerland | 99.8 /100 | #73 | Exceptional 11.5% |
| Bhutanese | 99.8 /100 | #74 | Exceptional 11.5% |
| Immigrants | Lebanon | 99.7 /100 | #75 | Exceptional 11.5% |
| Immigrants | Eritrea | 99.7 /100 | #76 | Exceptional 11.5% |
| Immigrants | Afghanistan | 99.7 /100 | #77 | Exceptional 11.5% |