Italian vs Immigrants from Venezuela Disability Age 65 to 74
COMPARE
Italian
Immigrants from Venezuela
Disability Age 65 to 74
Disability Age 65 to 74 Comparison
Italians
Immigrants from Venezuela
22.0%
DISABILITY AGE 65 TO 74
97.9/ 100
METRIC RATING
90th/ 347
METRIC RANK
21.8%
DISABILITY AGE 65 TO 74
99.0/ 100
METRIC RATING
73rd/ 347
METRIC RANK
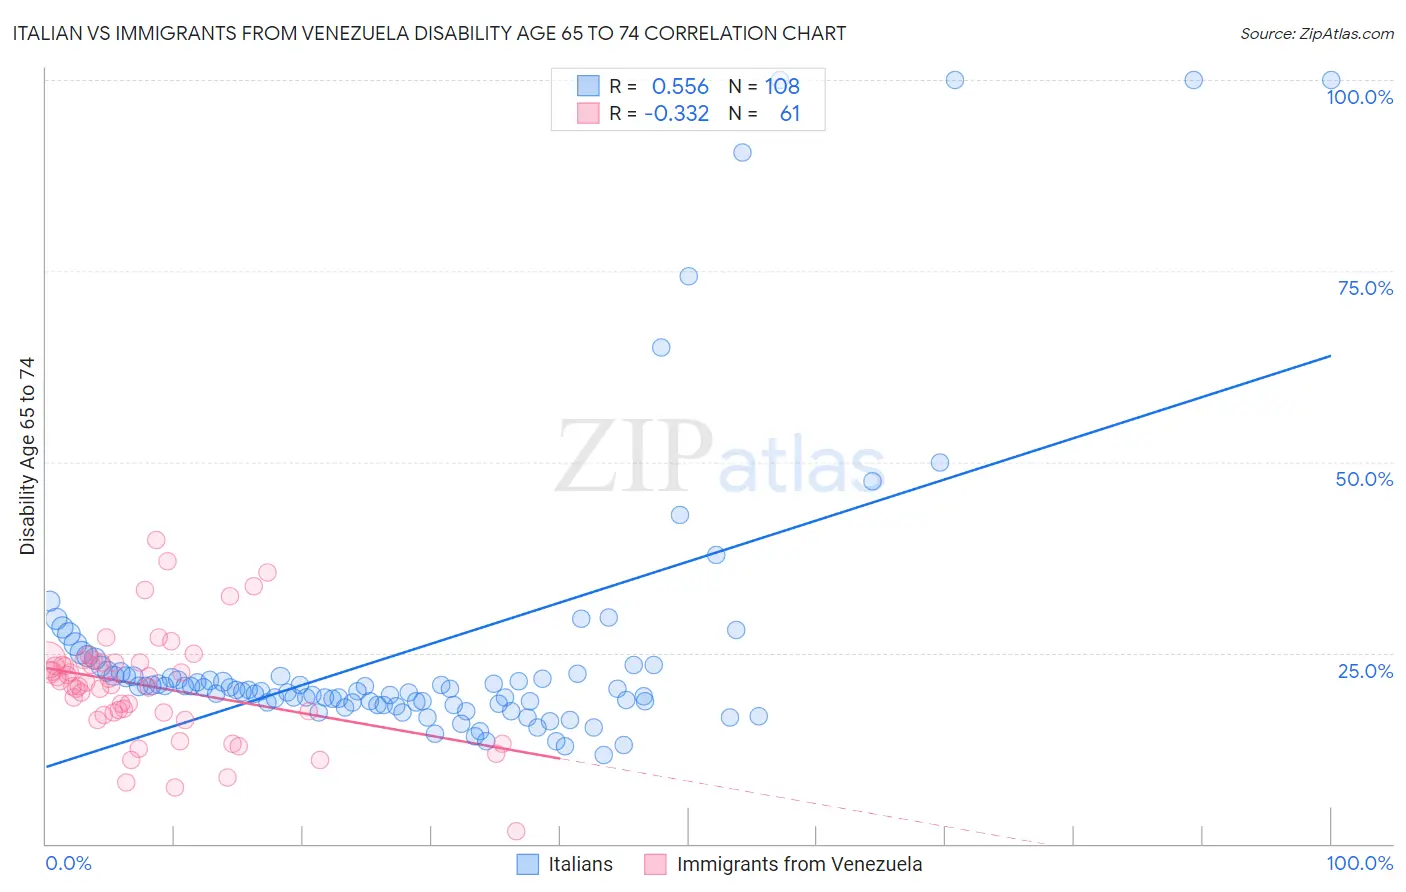
Italian vs Immigrants from Venezuela Disability Age 65 to 74 Correlation Chart
The statistical analysis conducted on geographies consisting of 572,372,600 people shows a substantial positive correlation between the proportion of Italians and percentage of population with a disability between the ages 65 and 75 in the United States with a correlation coefficient (R) of 0.556 and weighted average of 22.0%. Similarly, the statistical analysis conducted on geographies consisting of 287,548,772 people shows a mild negative correlation between the proportion of Immigrants from Venezuela and percentage of population with a disability between the ages 65 and 75 in the United States with a correlation coefficient (R) of -0.332 and weighted average of 21.8%, a difference of 1.2%.
Disability Age 65 to 74 Correlation Summary
| Measurement | Italian | Immigrants from Venezuela |
| Minimum | 11.6% | 1.6% |
| Maximum | 100.0% | 39.7% |
| Range | 88.4% | 38.1% |
| Mean | 25.4% | 20.6% |
| Median | 20.2% | 21.0% |
| Interquartile 25% (IQ1) | 18.3% | 17.0% |
| Interquartile 75% (IQ3) | 22.3% | 23.8% |
| Interquartile Range (IQR) | 4.0% | 6.8% |
| Standard Deviation (Sample) | 18.4% | 7.2% |
| Standard Deviation (Population) | 18.3% | 7.1% |
Demographics Similar to Italians and Immigrants from Venezuela by Disability Age 65 to 74
In terms of disability age 65 to 74, the demographic groups most similar to Italians are Immigrants from Kuwait (22.0%, a difference of 0.010%), Immigrants from Netherlands (22.0%, a difference of 0.020%), Chilean (22.0%, a difference of 0.020%), Australian (22.0%, a difference of 0.030%), and South African (21.9%, a difference of 0.37%). Similarly, the demographic groups most similar to Immigrants from Venezuela are Cambodian (21.8%, a difference of 0.010%), Mongolian (21.8%, a difference of 0.030%), Greek (21.8%, a difference of 0.040%), Immigrants from Poland (21.8%, a difference of 0.090%), and Immigrants from Eastern Europe (21.8%, a difference of 0.15%).
| Demographics | Rating | Rank | Disability Age 65 to 74 |
| Immigrants | Belarus | 99.2 /100 | #71 | Exceptional 21.7% |
| Immigrants | Hungary | 99.2 /100 | #72 | Exceptional 21.7% |
| Immigrants | Venezuela | 99.0 /100 | #73 | Exceptional 21.8% |
| Cambodians | 99.0 /100 | #74 | Exceptional 21.8% |
| Mongolians | 99.0 /100 | #75 | Exceptional 21.8% |
| Greeks | 99.0 /100 | #76 | Exceptional 21.8% |
| Immigrants | Poland | 99.0 /100 | #77 | Exceptional 21.8% |
| Immigrants | Eastern Europe | 99.0 /100 | #78 | Exceptional 21.8% |
| Venezuelans | 99.0 /100 | #79 | Exceptional 21.8% |
| Immigrants | Norway | 98.9 /100 | #80 | Exceptional 21.8% |
| Croatians | 98.9 /100 | #81 | Exceptional 21.8% |
| Immigrants | Indonesia | 98.7 /100 | #82 | Exceptional 21.9% |
| Immigrants | Brazil | 98.5 /100 | #83 | Exceptional 21.9% |
| Immigrants | Spain | 98.5 /100 | #84 | Exceptional 21.9% |
| Immigrants | Lebanon | 98.4 /100 | #85 | Exceptional 21.9% |
| South Africans | 98.4 /100 | #86 | Exceptional 21.9% |
| Australians | 98.0 /100 | #87 | Exceptional 22.0% |
| Immigrants | Netherlands | 97.9 /100 | #88 | Exceptional 22.0% |
| Immigrants | Kuwait | 97.9 /100 | #89 | Exceptional 22.0% |
| Italians | 97.9 /100 | #90 | Exceptional 22.0% |
| Chileans | 97.9 /100 | #91 | Exceptional 22.0% |