Alsatian vs Basque Disability Age Over 75
COMPARE
Alsatian
Basque
Disability Age Over 75
Disability Age Over 75 Comparison
Alsatians
Basques
47.3%
DISABILITY AGE OVER 75
51.9/ 100
METRIC RATING
173rd/ 347
METRIC RANK
47.6%
DISABILITY AGE OVER 75
30.9/ 100
METRIC RATING
188th/ 347
METRIC RANK
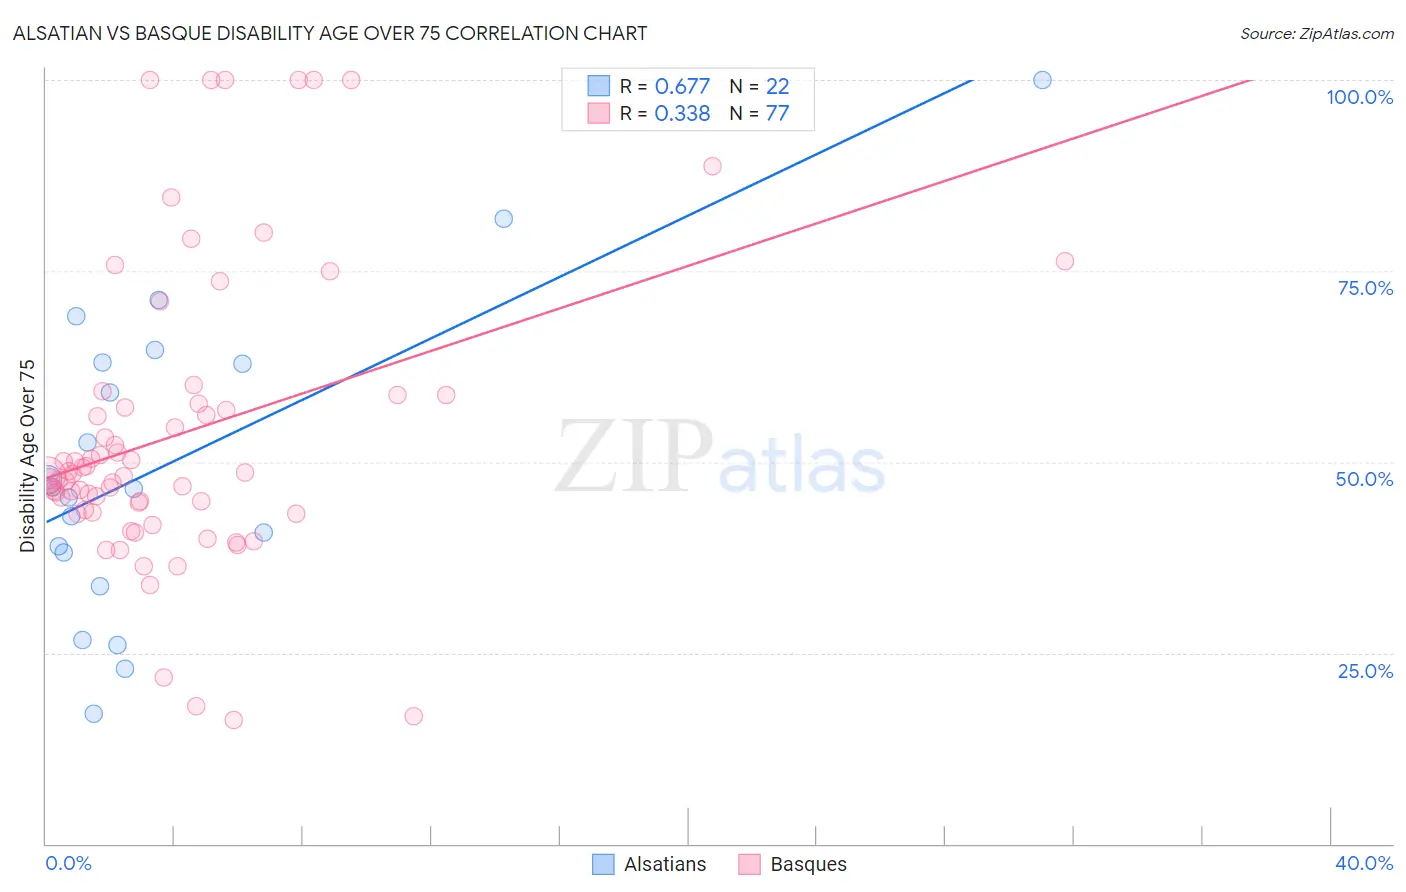
Alsatian vs Basque Disability Age Over 75 Correlation Chart
The statistical analysis conducted on geographies consisting of 82,676,036 people shows a significant positive correlation between the proportion of Alsatians and percentage of population with a disability over the age of 75 in the United States with a correlation coefficient (R) of 0.677 and weighted average of 47.3%. Similarly, the statistical analysis conducted on geographies consisting of 165,667,068 people shows a mild positive correlation between the proportion of Basques and percentage of population with a disability over the age of 75 in the United States with a correlation coefficient (R) of 0.338 and weighted average of 47.6%, a difference of 0.49%.
Disability Age Over 75 Correlation Summary
| Measurement | Alsatian | Basque |
| Minimum | 17.1% | 16.2% |
| Maximum | 100.0% | 100.0% |
| Range | 82.9% | 83.8% |
| Mean | 49.9% | 53.6% |
| Median | 46.6% | 48.2% |
| Interquartile 25% (IQ1) | 38.2% | 43.5% |
| Interquartile 75% (IQ3) | 63.0% | 58.2% |
| Interquartile Range (IQR) | 24.8% | 14.7% |
| Standard Deviation (Sample) | 20.2% | 19.2% |
| Standard Deviation (Population) | 19.8% | 19.1% |
Demographics Similar to Alsatians and Basques by Disability Age Over 75
In terms of disability age over 75, the demographic groups most similar to Alsatians are Scotch-Irish (47.3%, a difference of 0.010%), Immigrants from Africa (47.3%, a difference of 0.040%), White/Caucasian (47.3%, a difference of 0.040%), Immigrants from Haiti (47.3%, a difference of 0.050%), and German Russian (47.3%, a difference of 0.10%). Similarly, the demographic groups most similar to Basques are Immigrants from Kenya (47.6%, a difference of 0.0%), Immigrants from Sudan (47.5%, a difference of 0.020%), Sudanese (47.5%, a difference of 0.030%), Somali (47.6%, a difference of 0.040%), and Ghanaian (47.5%, a difference of 0.060%).
| Demographics | Rating | Rank | Disability Age Over 75 |
| German Russians | 56.2 /100 | #170 | Average 47.3% |
| Immigrants | Africa | 53.6 /100 | #171 | Average 47.3% |
| Scotch-Irish | 52.5 /100 | #172 | Average 47.3% |
| Alsatians | 51.9 /100 | #173 | Average 47.3% |
| Whites/Caucasians | 50.0 /100 | #174 | Average 47.3% |
| Immigrants | Haiti | 49.7 /100 | #175 | Average 47.3% |
| Ecuadorians | 46.7 /100 | #176 | Average 47.4% |
| Haitians | 44.6 /100 | #177 | Average 47.4% |
| Cubans | 42.1 /100 | #178 | Average 47.4% |
| Sierra Leoneans | 41.7 /100 | #179 | Average 47.4% |
| Immigrants | Ecuador | 41.7 /100 | #180 | Average 47.4% |
| Immigrants | Kazakhstan | 40.4 /100 | #181 | Average 47.4% |
| Immigrants | Moldova | 39.9 /100 | #182 | Fair 47.4% |
| Delaware | 39.1 /100 | #183 | Fair 47.5% |
| Immigrants | Nigeria | 34.0 /100 | #184 | Fair 47.5% |
| Ghanaians | 33.0 /100 | #185 | Fair 47.5% |
| Sudanese | 32.0 /100 | #186 | Fair 47.5% |
| Immigrants | Sudan | 31.8 /100 | #187 | Fair 47.5% |
| Basques | 30.9 /100 | #188 | Fair 47.6% |
| Immigrants | Kenya | 30.8 /100 | #189 | Fair 47.6% |
| Somalis | 29.5 /100 | #190 | Fair 47.6% |