Alsatian vs Immigrants from Western Europe Disability Age Over 75
COMPARE
Alsatian
Immigrants from Western Europe
Disability Age Over 75
Disability Age Over 75 Comparison
Alsatians
Immigrants from Western Europe
47.3%
DISABILITY AGE OVER 75
51.9/ 100
METRIC RATING
173rd/ 347
METRIC RANK
46.2%
DISABILITY AGE OVER 75
98.8/ 100
METRIC RATING
78th/ 347
METRIC RANK
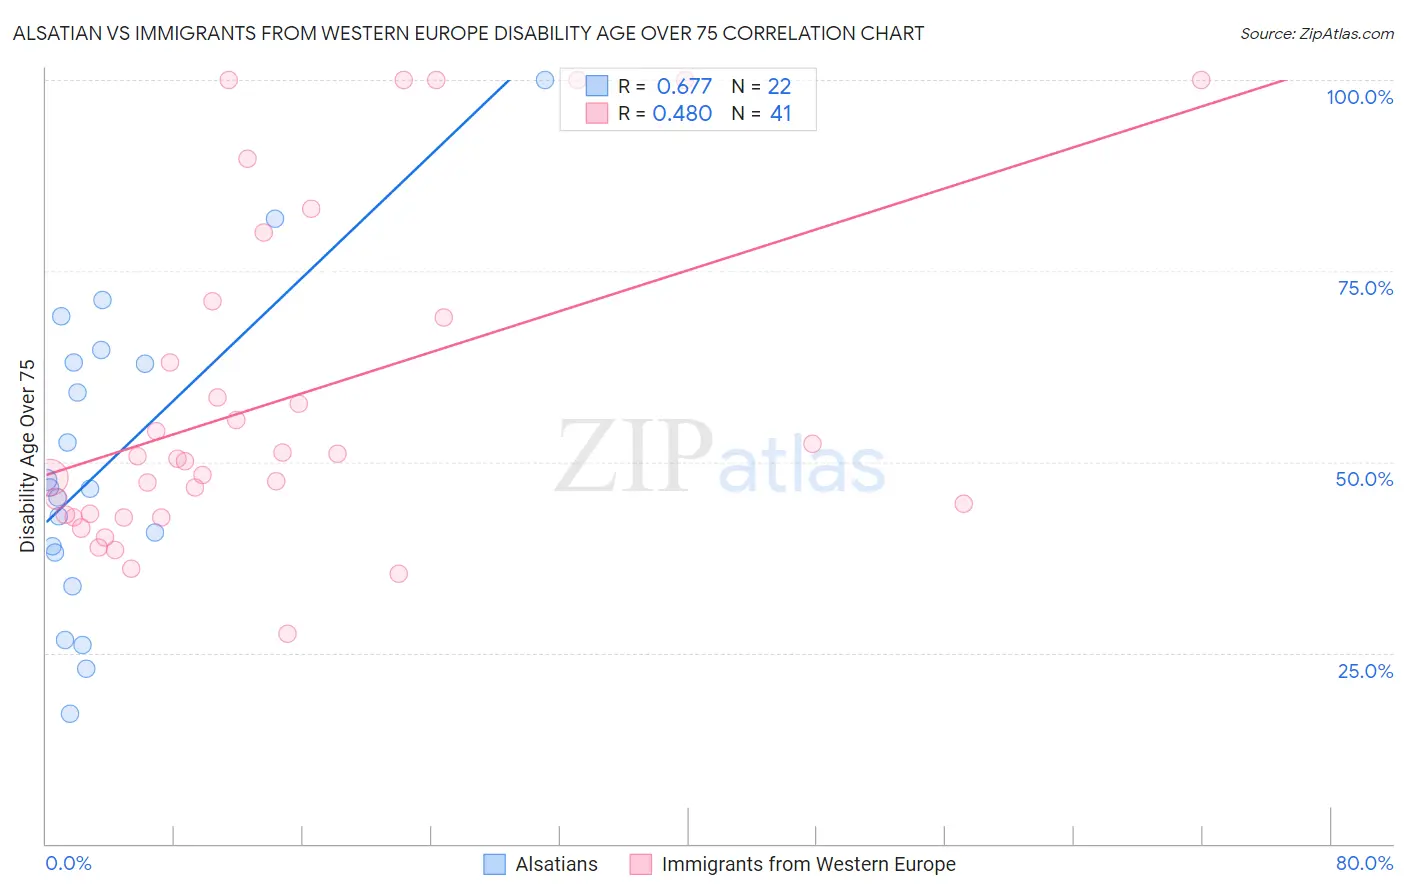
Alsatian vs Immigrants from Western Europe Disability Age Over 75 Correlation Chart
The statistical analysis conducted on geographies consisting of 82,676,036 people shows a significant positive correlation between the proportion of Alsatians and percentage of population with a disability over the age of 75 in the United States with a correlation coefficient (R) of 0.677 and weighted average of 47.3%. Similarly, the statistical analysis conducted on geographies consisting of 493,053,123 people shows a moderate positive correlation between the proportion of Immigrants from Western Europe and percentage of population with a disability over the age of 75 in the United States with a correlation coefficient (R) of 0.480 and weighted average of 46.2%, a difference of 2.5%.
Disability Age Over 75 Correlation Summary
| Measurement | Alsatian | Immigrants from Western Europe |
| Minimum | 17.1% | 27.5% |
| Maximum | 100.0% | 100.0% |
| Range | 82.9% | 72.5% |
| Mean | 49.9% | 58.2% |
| Median | 46.6% | 50.4% |
| Interquartile 25% (IQ1) | 38.2% | 42.9% |
| Interquartile 75% (IQ3) | 63.0% | 70.0% |
| Interquartile Range (IQR) | 24.8% | 27.1% |
| Standard Deviation (Sample) | 20.2% | 21.6% |
| Standard Deviation (Population) | 19.8% | 21.3% |
Similar Demographics by Disability Age Over 75
Demographics Similar to Alsatians by Disability Age Over 75
In terms of disability age over 75, the demographic groups most similar to Alsatians are Scotch-Irish (47.3%, a difference of 0.010%), Immigrants from Africa (47.3%, a difference of 0.040%), White/Caucasian (47.3%, a difference of 0.040%), Immigrants from Haiti (47.3%, a difference of 0.050%), and German Russian (47.3%, a difference of 0.10%).
| Demographics | Rating | Rank | Disability Age Over 75 |
| Immigrants | Sierra Leone | 64.4 /100 | #166 | Good 47.2% |
| Moroccans | 62.9 /100 | #167 | Good 47.2% |
| Kenyans | 58.8 /100 | #168 | Average 47.2% |
| Celtics | 58.7 /100 | #169 | Average 47.2% |
| German Russians | 56.2 /100 | #170 | Average 47.3% |
| Immigrants | Africa | 53.6 /100 | #171 | Average 47.3% |
| Scotch-Irish | 52.5 /100 | #172 | Average 47.3% |
| Alsatians | 51.9 /100 | #173 | Average 47.3% |
| Whites/Caucasians | 50.0 /100 | #174 | Average 47.3% |
| Immigrants | Haiti | 49.7 /100 | #175 | Average 47.3% |
| Ecuadorians | 46.7 /100 | #176 | Average 47.4% |
| Haitians | 44.6 /100 | #177 | Average 47.4% |
| Cubans | 42.1 /100 | #178 | Average 47.4% |
| Sierra Leoneans | 41.7 /100 | #179 | Average 47.4% |
| Immigrants | Ecuador | 41.7 /100 | #180 | Average 47.4% |
Demographics Similar to Immigrants from Western Europe by Disability Age Over 75
In terms of disability age over 75, the demographic groups most similar to Immigrants from Western Europe are Immigrants from Eastern Asia (46.2%, a difference of 0.010%), Swiss (46.2%, a difference of 0.040%), Soviet Union (46.2%, a difference of 0.040%), Slavic (46.1%, a difference of 0.050%), and New Zealander (46.2%, a difference of 0.050%).
| Demographics | Rating | Rank | Disability Age Over 75 |
| Immigrants | Sri Lanka | 99.2 /100 | #71 | Exceptional 46.1% |
| Immigrants | Hungary | 99.1 /100 | #72 | Exceptional 46.1% |
| Cambodians | 99.1 /100 | #73 | Exceptional 46.1% |
| Egyptians | 99.0 /100 | #74 | Exceptional 46.1% |
| Serbians | 99.0 /100 | #75 | Exceptional 46.1% |
| Slavs | 98.9 /100 | #76 | Exceptional 46.1% |
| Immigrants | Eastern Asia | 98.9 /100 | #77 | Exceptional 46.2% |
| Immigrants | Western Europe | 98.8 /100 | #78 | Exceptional 46.2% |
| Swiss | 98.8 /100 | #79 | Exceptional 46.2% |
| Soviet Union | 98.8 /100 | #80 | Exceptional 46.2% |
| New Zealanders | 98.8 /100 | #81 | Exceptional 46.2% |
| Immigrants | Latvia | 98.7 /100 | #82 | Exceptional 46.2% |
| Argentineans | 98.7 /100 | #83 | Exceptional 46.2% |
| Immigrants | Jordan | 98.7 /100 | #84 | Exceptional 46.2% |
| Immigrants | Southern Europe | 98.6 /100 | #85 | Exceptional 46.2% |