Yuman vs Pakistani Householder Income Ages 45 - 64 years
COMPARE
Yuman
Pakistani
Householder Income Ages 45 - 64 years
Householder Income Ages 45 - 64 years Comparison
Yuman
Pakistanis
$82,139
HOUSEHOLDER INCOME AGES 45 - 64 YEARS
0.0/ 100
METRIC RATING
321st/ 347
METRIC RANK
$105,317
HOUSEHOLDER INCOME AGES 45 - 64 YEARS
92.4/ 100
METRIC RATING
125th/ 347
METRIC RANK
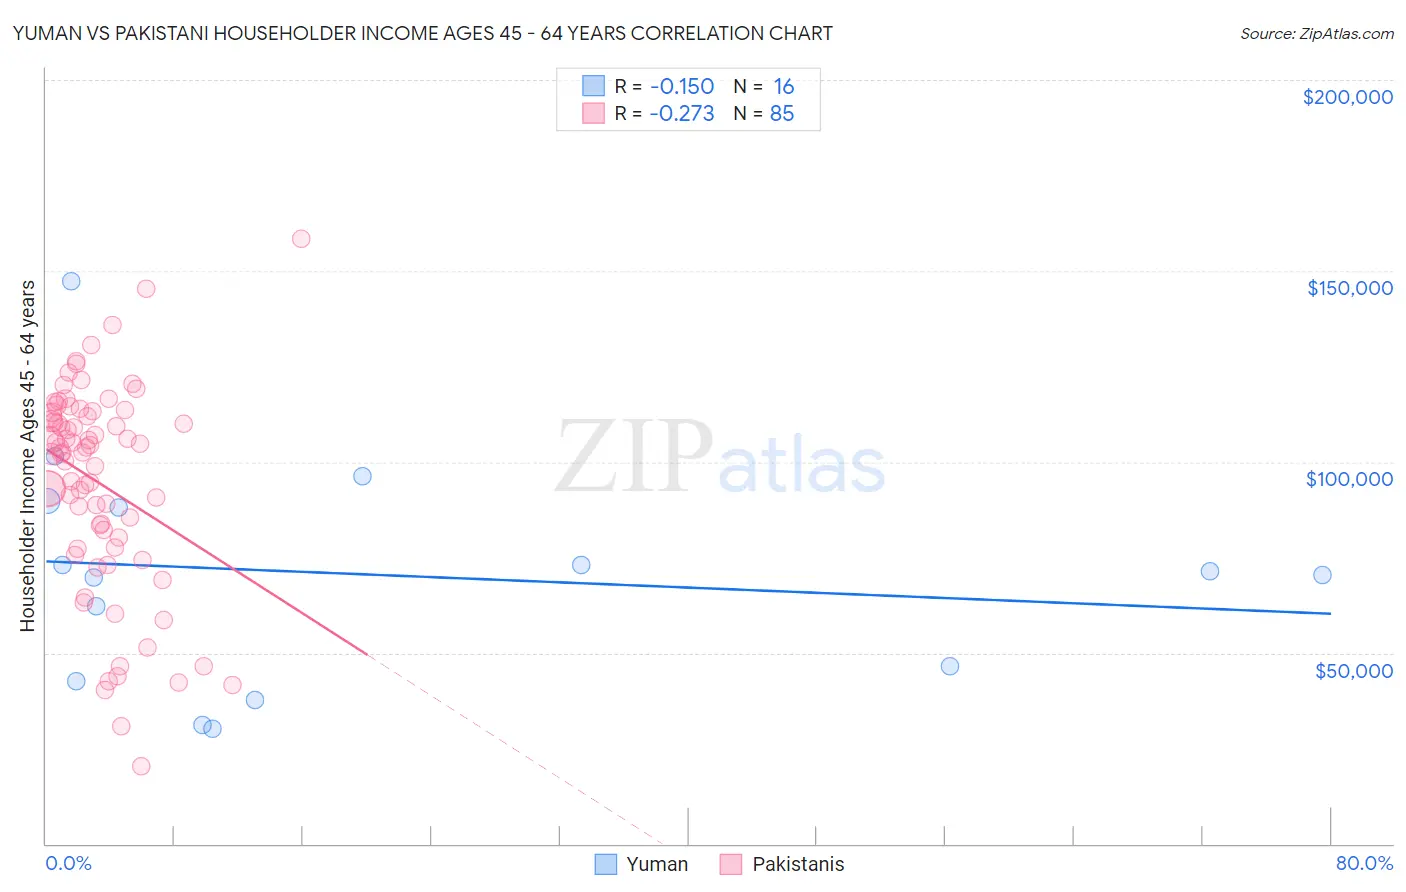
Yuman vs Pakistani Householder Income Ages 45 - 64 years Correlation Chart
The statistical analysis conducted on geographies consisting of 40,638,161 people shows a poor negative correlation between the proportion of Yuman and household income with householder between the ages 45 and 64 in the United States with a correlation coefficient (R) of -0.150 and weighted average of $82,139. Similarly, the statistical analysis conducted on geographies consisting of 334,898,404 people shows a weak negative correlation between the proportion of Pakistanis and household income with householder between the ages 45 and 64 in the United States with a correlation coefficient (R) of -0.273 and weighted average of $105,317, a difference of 28.2%.
Householder Income Ages 45 - 64 years Correlation Summary
| Measurement | Yuman | Pakistani |
| Minimum | $30,086 | $20,167 |
| Maximum | $147,152 | $158,417 |
| Range | $117,066 | $138,250 |
| Mean | $70,628 | $94,559 |
| Median | $70,888 | $102,574 |
| Interquartile 25% (IQ1) | $44,573 | $78,855 |
| Interquartile 75% (IQ3) | $88,954 | $112,512 |
| Interquartile Range (IQR) | $44,381 | $33,657 |
| Standard Deviation (Sample) | $30,431 | $26,997 |
| Standard Deviation (Population) | $29,465 | $26,838 |
Similar Demographics by Householder Income Ages 45 - 64 years
Demographics Similar to Yuman by Householder Income Ages 45 - 64 years
In terms of householder income ages 45 - 64 years, the demographic groups most similar to Yuman are Apache ($82,184, a difference of 0.050%), Chickasaw ($82,193, a difference of 0.070%), Choctaw ($82,287, a difference of 0.18%), Colville ($82,474, a difference of 0.41%), and Immigrants from Caribbean ($82,513, a difference of 0.46%).
| Demographics | Rating | Rank | Householder Income Ages 45 - 64 years |
| Immigrants | Honduras | 0.0 /100 | #314 | Tragic $82,697 |
| Paiute | 0.0 /100 | #315 | Tragic $82,629 |
| Immigrants | Caribbean | 0.0 /100 | #316 | Tragic $82,513 |
| Colville | 0.0 /100 | #317 | Tragic $82,474 |
| Choctaw | 0.0 /100 | #318 | Tragic $82,287 |
| Chickasaw | 0.0 /100 | #319 | Tragic $82,193 |
| Apache | 0.0 /100 | #320 | Tragic $82,184 |
| Yuman | 0.0 /100 | #321 | Tragic $82,139 |
| Sioux | 0.0 /100 | #322 | Tragic $81,750 |
| Bahamians | 0.0 /100 | #323 | Tragic $81,369 |
| Yup'ik | 0.0 /100 | #324 | Tragic $81,000 |
| Immigrants | Cuba | 0.0 /100 | #325 | Tragic $80,662 |
| Dominicans | 0.0 /100 | #326 | Tragic $80,623 |
| Seminole | 0.0 /100 | #327 | Tragic $80,077 |
| Natives/Alaskans | 0.0 /100 | #328 | Tragic $79,816 |
Demographics Similar to Pakistanis by Householder Income Ages 45 - 64 years
In terms of householder income ages 45 - 64 years, the demographic groups most similar to Pakistanis are Portuguese ($105,309, a difference of 0.010%), Immigrants from Saudi Arabia ($105,249, a difference of 0.060%), Immigrants from Northern Africa ($105,430, a difference of 0.11%), Native Hawaiian ($105,149, a difference of 0.16%), and Peruvian ($105,070, a difference of 0.23%).
| Demographics | Rating | Rank | Householder Income Ages 45 - 64 years |
| Immigrants | Western Asia | 95.0 /100 | #118 | Exceptional $106,217 |
| Immigrants | Jordan | 94.9 /100 | #119 | Exceptional $106,164 |
| Immigrants | South Eastern Asia | 94.8 /100 | #120 | Exceptional $106,109 |
| Poles | 94.4 /100 | #121 | Exceptional $105,952 |
| Immigrants | North Macedonia | 94.2 /100 | #122 | Exceptional $105,892 |
| Danes | 93.4 /100 | #123 | Exceptional $105,619 |
| Immigrants | Northern Africa | 92.8 /100 | #124 | Exceptional $105,430 |
| Pakistanis | 92.4 /100 | #125 | Exceptional $105,317 |
| Portuguese | 92.4 /100 | #126 | Exceptional $105,309 |
| Immigrants | Saudi Arabia | 92.2 /100 | #127 | Exceptional $105,249 |
| Native Hawaiians | 91.8 /100 | #128 | Exceptional $105,149 |
| Peruvians | 91.5 /100 | #129 | Exceptional $105,070 |
| Immigrants | Zimbabwe | 91.2 /100 | #130 | Exceptional $104,992 |
| Immigrants | Syria | 90.7 /100 | #131 | Exceptional $104,858 |
| Lebanese | 90.1 /100 | #132 | Exceptional $104,734 |