Immigrants from Sierra Leone vs Pakistani Disability
COMPARE
Immigrants from Sierra Leone
Pakistani
Disability
Disability Comparison
Immigrants from Sierra Leone
Pakistanis
11.1%
DISABILITY
99.0/ 100
METRIC RATING
84th/ 347
METRIC RANK
11.7%
DISABILITY
54.7/ 100
METRIC RATING
166th/ 347
METRIC RANK
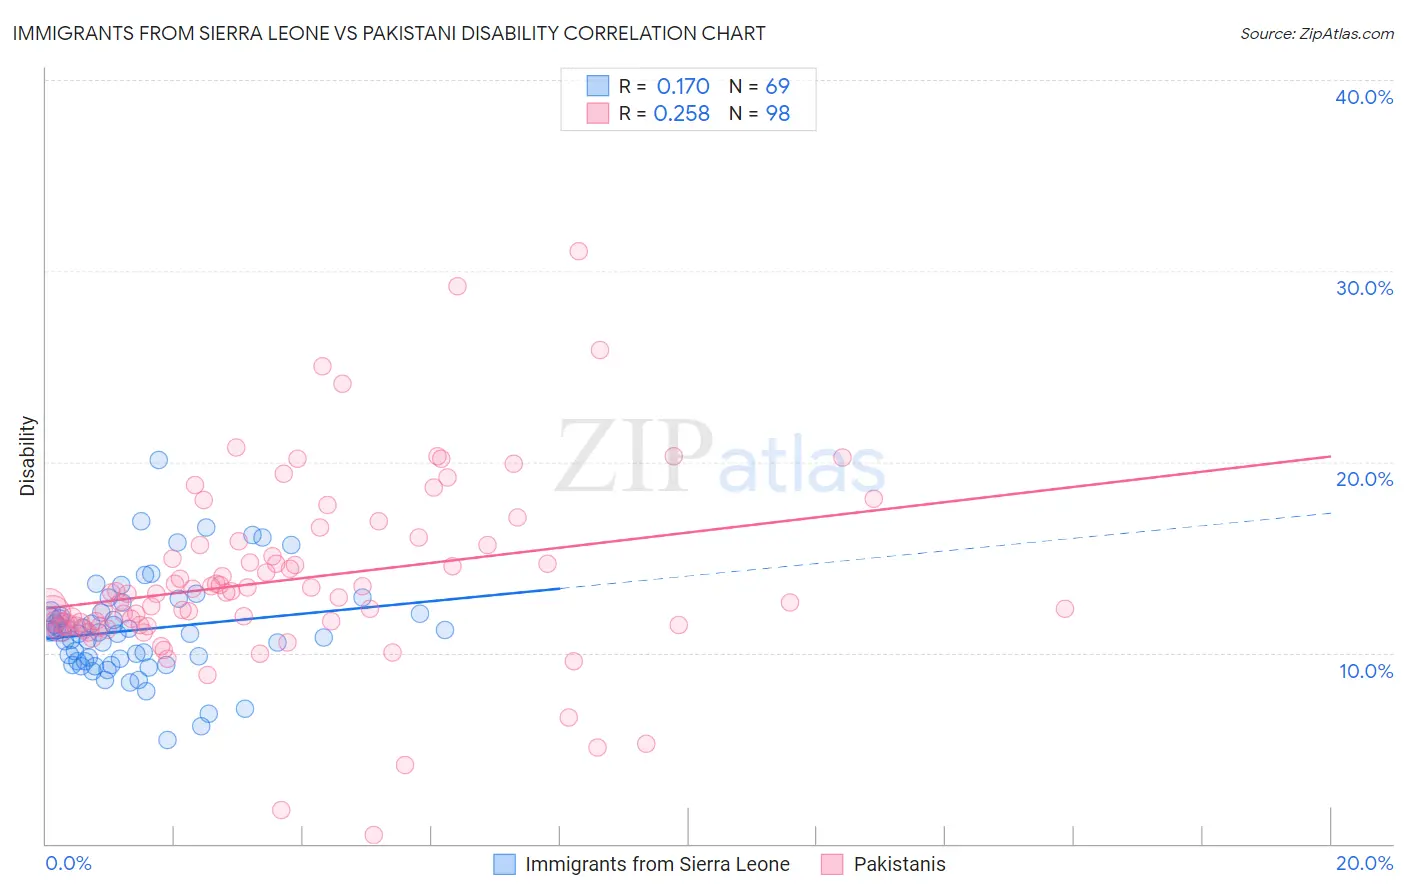
Immigrants from Sierra Leone vs Pakistani Disability Correlation Chart
The statistical analysis conducted on geographies consisting of 101,651,633 people shows a poor positive correlation between the proportion of Immigrants from Sierra Leone and percentage of population with a disability in the United States with a correlation coefficient (R) of 0.170 and weighted average of 11.1%. Similarly, the statistical analysis conducted on geographies consisting of 335,302,131 people shows a weak positive correlation between the proportion of Pakistanis and percentage of population with a disability in the United States with a correlation coefficient (R) of 0.258 and weighted average of 11.7%, a difference of 5.2%.
Disability Correlation Summary
| Measurement | Immigrants from Sierra Leone | Pakistani |
| Minimum | 5.4% | 0.46% |
| Maximum | 20.1% | 31.1% |
| Range | 14.7% | 30.6% |
| Mean | 11.2% | 13.9% |
| Median | 11.1% | 13.1% |
| Interquartile 25% (IQ1) | 9.6% | 11.5% |
| Interquartile 75% (IQ3) | 12.1% | 15.7% |
| Interquartile Range (IQR) | 2.6% | 4.2% |
| Standard Deviation (Sample) | 2.6% | 4.9% |
| Standard Deviation (Population) | 2.6% | 4.8% |
Similar Demographics by Disability
Demographics Similar to Immigrants from Sierra Leone by Disability
In terms of disability, the demographic groups most similar to Immigrants from Sierra Leone are Immigrants from Switzerland (11.1%, a difference of 0.010%), Chilean (11.1%, a difference of 0.050%), Immigrants from Poland (11.1%, a difference of 0.090%), Immigrants from Belarus (11.1%, a difference of 0.15%), and Immigrants from Russia (11.1%, a difference of 0.15%).
| Demographics | Rating | Rank | Disability |
| Immigrants | Belgium | 99.3 /100 | #77 | Exceptional 11.0% |
| Immigrants | Cameroon | 99.3 /100 | #78 | Exceptional 11.1% |
| Immigrants | Jordan | 99.3 /100 | #79 | Exceptional 11.1% |
| Immigrants | Ireland | 99.3 /100 | #80 | Exceptional 11.1% |
| Immigrants | Poland | 99.1 /100 | #81 | Exceptional 11.1% |
| Chileans | 99.1 /100 | #82 | Exceptional 11.1% |
| Immigrants | Switzerland | 99.0 /100 | #83 | Exceptional 11.1% |
| Immigrants | Sierra Leone | 99.0 /100 | #84 | Exceptional 11.1% |
| Immigrants | Belarus | 98.9 /100 | #85 | Exceptional 11.1% |
| Immigrants | Russia | 98.9 /100 | #86 | Exceptional 11.1% |
| Palestinians | 98.9 /100 | #87 | Exceptional 11.1% |
| Immigrants | Romania | 98.5 /100 | #88 | Exceptional 11.2% |
| Immigrants | South Africa | 98.2 /100 | #89 | Exceptional 11.2% |
| Immigrants | Brazil | 98.1 /100 | #90 | Exceptional 11.2% |
| Immigrants | Western Asia | 98.1 /100 | #91 | Exceptional 11.2% |
Demographics Similar to Pakistanis by Disability
In terms of disability, the demographic groups most similar to Pakistanis are Estonian (11.7%, a difference of 0.010%), Immigrants from Latin America (11.7%, a difference of 0.030%), Immigrants from Austria (11.7%, a difference of 0.060%), Immigrants from Albania (11.7%, a difference of 0.080%), and Cuban (11.7%, a difference of 0.090%).
| Demographics | Rating | Rank | Disability |
| Guatemalans | 65.1 /100 | #159 | Good 11.6% |
| Immigrants | Barbados | 64.2 /100 | #160 | Good 11.6% |
| Immigrants | Cuba | 62.8 /100 | #161 | Good 11.6% |
| Immigrants | Haiti | 59.2 /100 | #162 | Average 11.7% |
| Immigrants | Trinidad and Tobago | 58.9 /100 | #163 | Average 11.7% |
| Syrians | 58.5 /100 | #164 | Average 11.7% |
| Cubans | 56.7 /100 | #165 | Average 11.7% |
| Pakistanis | 54.7 /100 | #166 | Average 11.7% |
| Estonians | 54.4 /100 | #167 | Average 11.7% |
| Immigrants | Latin America | 54.1 /100 | #168 | Average 11.7% |
| Immigrants | Austria | 53.4 /100 | #169 | Average 11.7% |
| Immigrants | Albania | 52.8 /100 | #170 | Average 11.7% |
| Immigrants | Southern Europe | 52.8 /100 | #171 | Average 11.7% |
| Trinidadians and Tobagonians | 52.7 /100 | #172 | Average 11.7% |
| Maltese | 50.6 /100 | #173 | Average 11.7% |