Cree vs Pakistani Disability
COMPARE
Cree
Pakistani
Disability
Disability Comparison
Cree
Pakistanis
13.7%
DISABILITY
0.0/ 100
METRIC RATING
313th/ 347
METRIC RANK
11.7%
DISABILITY
54.7/ 100
METRIC RATING
166th/ 347
METRIC RANK
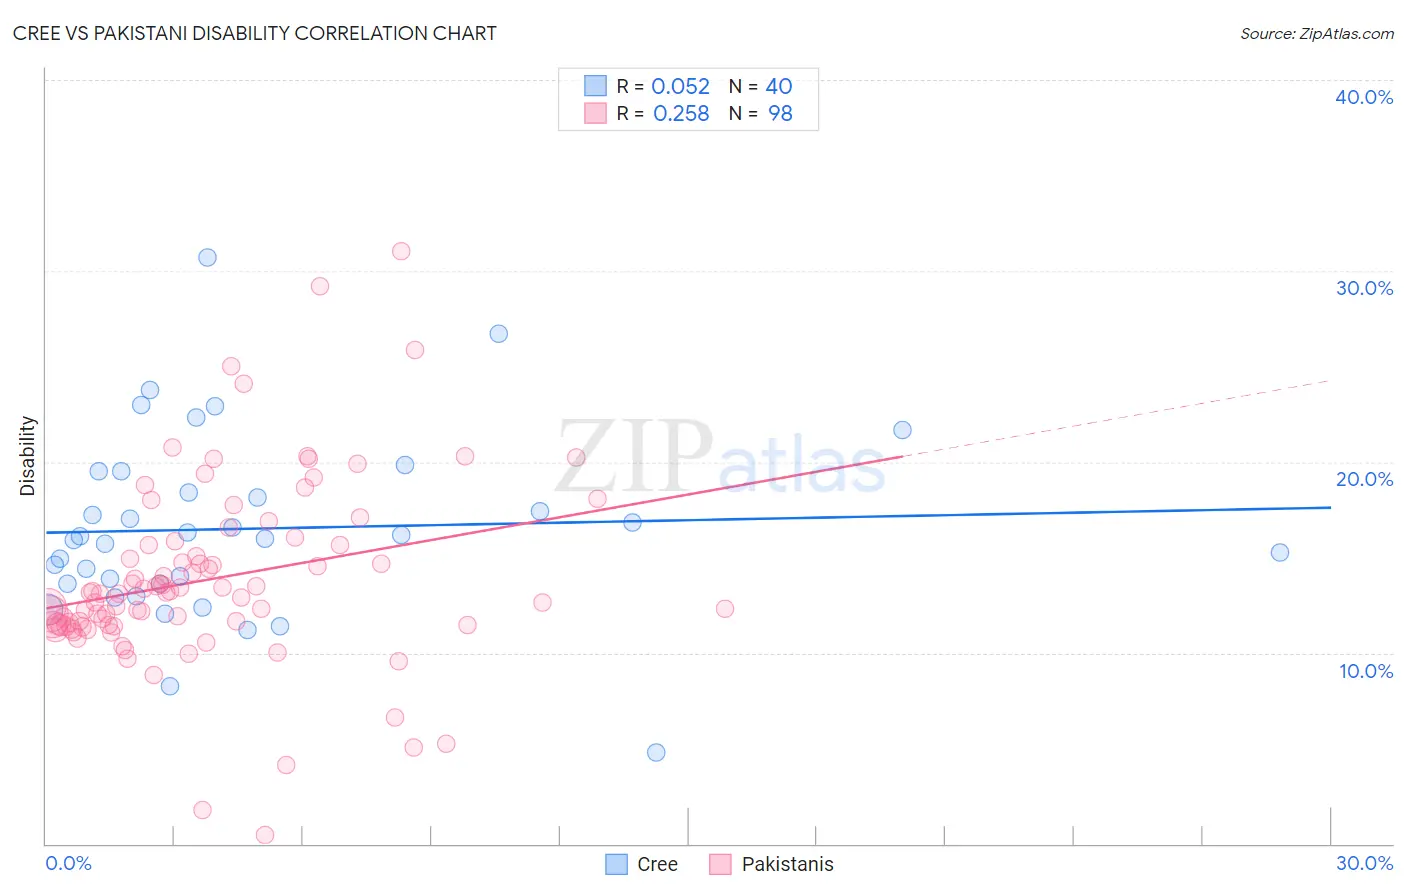
Cree vs Pakistani Disability Correlation Chart
The statistical analysis conducted on geographies consisting of 76,208,800 people shows a slight positive correlation between the proportion of Cree and percentage of population with a disability in the United States with a correlation coefficient (R) of 0.052 and weighted average of 13.7%. Similarly, the statistical analysis conducted on geographies consisting of 335,302,131 people shows a weak positive correlation between the proportion of Pakistanis and percentage of population with a disability in the United States with a correlation coefficient (R) of 0.258 and weighted average of 11.7%, a difference of 17.3%.
Disability Correlation Summary
| Measurement | Cree | Pakistani |
| Minimum | 4.8% | 0.46% |
| Maximum | 30.7% | 31.1% |
| Range | 25.9% | 30.6% |
| Mean | 16.5% | 13.9% |
| Median | 16.1% | 13.1% |
| Interquartile 25% (IQ1) | 13.6% | 11.5% |
| Interquartile 75% (IQ3) | 18.9% | 15.7% |
| Interquartile Range (IQR) | 5.3% | 4.2% |
| Standard Deviation (Sample) | 4.9% | 4.9% |
| Standard Deviation (Population) | 4.8% | 4.8% |
Similar Demographics by Disability
Demographics Similar to Cree by Disability
In terms of disability, the demographic groups most similar to Cree are Black/African American (13.7%, a difference of 0.040%), Puget Sound Salish (13.7%, a difference of 0.040%), Pima (13.7%, a difference of 0.070%), Immigrants from Cabo Verde (13.7%, a difference of 0.070%), and Spanish American (13.6%, a difference of 0.35%).
| Demographics | Rating | Rank | Disability |
| Cape Verdeans | 0.0 /100 | #306 | Tragic 13.5% |
| Shoshone | 0.0 /100 | #307 | Tragic 13.5% |
| French American Indians | 0.0 /100 | #308 | Tragic 13.5% |
| Tlingit-Haida | 0.0 /100 | #309 | Tragic 13.5% |
| Blackfeet | 0.0 /100 | #310 | Tragic 13.6% |
| Delaware | 0.0 /100 | #311 | Tragic 13.6% |
| Spanish Americans | 0.0 /100 | #312 | Tragic 13.6% |
| Cree | 0.0 /100 | #313 | Tragic 13.7% |
| Blacks/African Americans | 0.0 /100 | #314 | Tragic 13.7% |
| Puget Sound Salish | 0.0 /100 | #315 | Tragic 13.7% |
| Pima | 0.0 /100 | #316 | Tragic 13.7% |
| Immigrants | Cabo Verde | 0.0 /100 | #317 | Tragic 13.7% |
| Menominee | 0.0 /100 | #318 | Tragic 13.8% |
| Iroquois | 0.0 /100 | #319 | Tragic 13.8% |
| Apache | 0.0 /100 | #320 | Tragic 13.9% |
Demographics Similar to Pakistanis by Disability
In terms of disability, the demographic groups most similar to Pakistanis are Estonian (11.7%, a difference of 0.010%), Immigrants from Latin America (11.7%, a difference of 0.030%), Immigrants from Austria (11.7%, a difference of 0.060%), Immigrants from Albania (11.7%, a difference of 0.080%), and Cuban (11.7%, a difference of 0.090%).
| Demographics | Rating | Rank | Disability |
| Guatemalans | 65.1 /100 | #159 | Good 11.6% |
| Immigrants | Barbados | 64.2 /100 | #160 | Good 11.6% |
| Immigrants | Cuba | 62.8 /100 | #161 | Good 11.6% |
| Immigrants | Haiti | 59.2 /100 | #162 | Average 11.7% |
| Immigrants | Trinidad and Tobago | 58.9 /100 | #163 | Average 11.7% |
| Syrians | 58.5 /100 | #164 | Average 11.7% |
| Cubans | 56.7 /100 | #165 | Average 11.7% |
| Pakistanis | 54.7 /100 | #166 | Average 11.7% |
| Estonians | 54.4 /100 | #167 | Average 11.7% |
| Immigrants | Latin America | 54.1 /100 | #168 | Average 11.7% |
| Immigrants | Austria | 53.4 /100 | #169 | Average 11.7% |
| Immigrants | Albania | 52.8 /100 | #170 | Average 11.7% |
| Immigrants | Southern Europe | 52.8 /100 | #171 | Average 11.7% |
| Trinidadians and Tobagonians | 52.7 /100 | #172 | Average 11.7% |
| Maltese | 50.6 /100 | #173 | Average 11.7% |