Yuman vs Immigrants from South Central Asia In Labor Force | Age 20-24
COMPARE
Yuman
Immigrants from South Central Asia
In Labor Force | Age 20-24
In Labor Force | Age 20-24 Comparison
Yuman
Immigrants from South Central Asia
70.3%
IN LABOR FORCE | AGE 20-24
0.0/ 100
METRIC RATING
333rd/ 347
METRIC RANK
74.0%
IN LABOR FORCE | AGE 20-24
1.9/ 100
METRIC RATING
244th/ 347
METRIC RANK
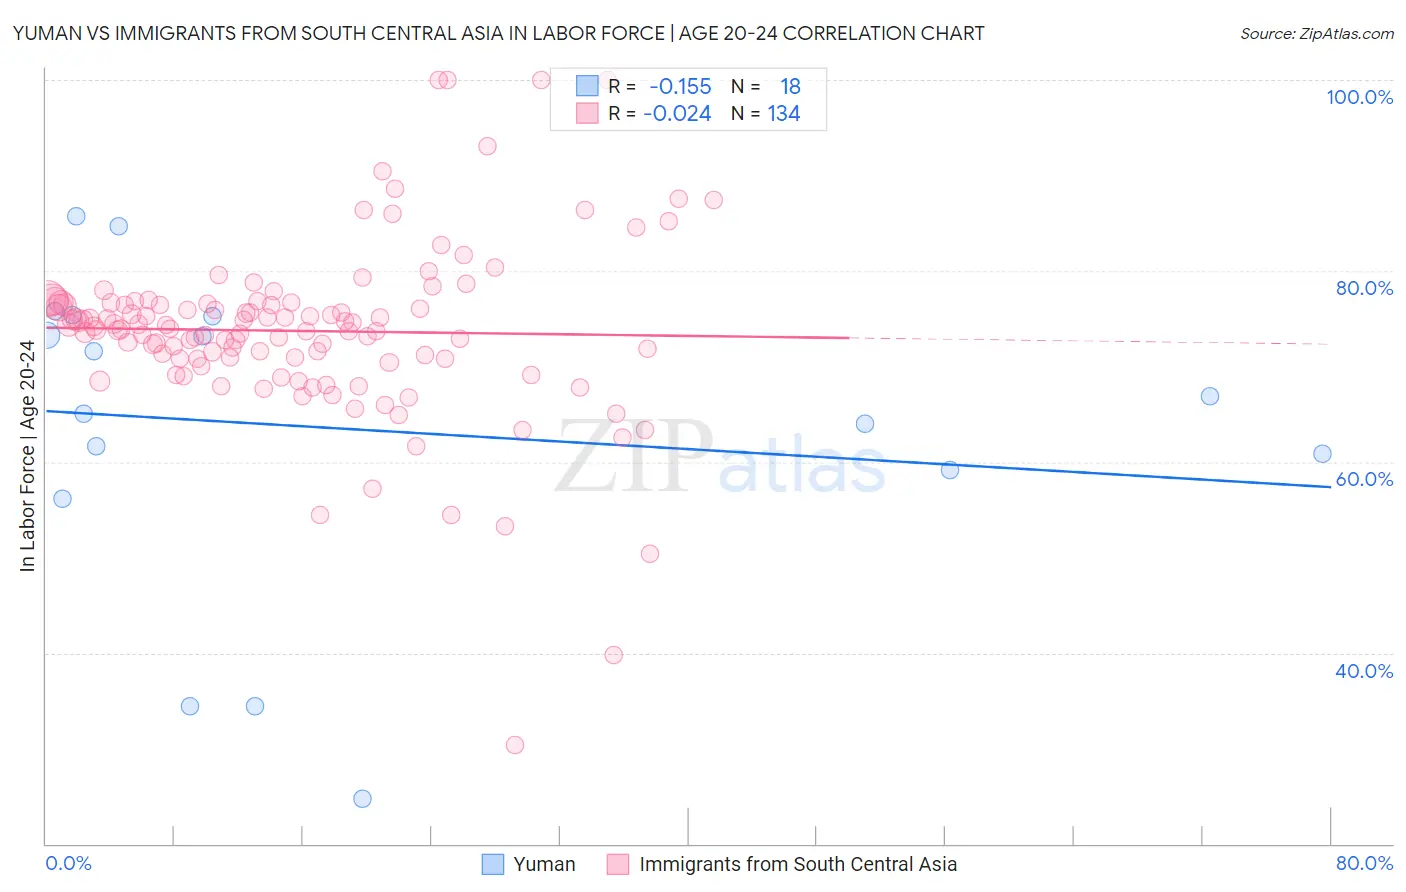
Yuman vs Immigrants from South Central Asia In Labor Force | Age 20-24 Correlation Chart
The statistical analysis conducted on geographies consisting of 40,677,141 people shows a poor negative correlation between the proportion of Yuman and labor force participation rate among population between the ages 20 and 24 in the United States with a correlation coefficient (R) of -0.155 and weighted average of 70.3%. Similarly, the statistical analysis conducted on geographies consisting of 472,891,637 people shows no correlation between the proportion of Immigrants from South Central Asia and labor force participation rate among population between the ages 20 and 24 in the United States with a correlation coefficient (R) of -0.024 and weighted average of 74.0%, a difference of 5.3%.
In Labor Force | Age 20-24 Correlation Summary
| Measurement | Yuman | Immigrants from South Central Asia |
| Minimum | 24.7% | 30.3% |
| Maximum | 85.7% | 100.0% |
| Range | 61.0% | 69.7% |
| Mean | 63.4% | 73.7% |
| Median | 66.0% | 74.1% |
| Interquartile 25% (IQ1) | 59.1% | 70.8% |
| Interquartile 75% (IQ3) | 75.2% | 76.6% |
| Interquartile Range (IQR) | 16.1% | 5.8% |
| Standard Deviation (Sample) | 17.0% | 9.4% |
| Standard Deviation (Population) | 16.5% | 9.3% |
Similar Demographics by In Labor Force | Age 20-24
Demographics Similar to Yuman by In Labor Force | Age 20-24
In terms of in labor force | age 20-24, the demographic groups most similar to Yuman are Immigrants from Uzbekistan (70.4%, a difference of 0.23%), British West Indian (70.0%, a difference of 0.41%), Immigrants from Bangladesh (70.6%, a difference of 0.53%), Vietnamese (70.6%, a difference of 0.55%), and Immigrants from Barbados (69.7%, a difference of 0.75%).
| Demographics | Rating | Rank | In Labor Force | Age 20-24 |
| Dominicans | 0.0 /100 | #326 | Tragic 71.1% |
| Immigrants | Trinidad and Tobago | 0.0 /100 | #327 | Tragic 71.1% |
| Immigrants | China | 0.0 /100 | #328 | Tragic 71.1% |
| Yup'ik | 0.0 /100 | #329 | Tragic 70.9% |
| Vietnamese | 0.0 /100 | #330 | Tragic 70.6% |
| Immigrants | Bangladesh | 0.0 /100 | #331 | Tragic 70.6% |
| Immigrants | Uzbekistan | 0.0 /100 | #332 | Tragic 70.4% |
| Yuman | 0.0 /100 | #333 | Tragic 70.3% |
| British West Indians | 0.0 /100 | #334 | Tragic 70.0% |
| Immigrants | Barbados | 0.0 /100 | #335 | Tragic 69.7% |
| Immigrants | Guyana | 0.0 /100 | #336 | Tragic 69.3% |
| Guyanese | 0.0 /100 | #337 | Tragic 69.2% |
| Pima | 0.0 /100 | #338 | Tragic 69.0% |
| Immigrants | Yemen | 0.0 /100 | #339 | Tragic 68.9% |
| Menominee | 0.0 /100 | #340 | Tragic 68.7% |
Demographics Similar to Immigrants from South Central Asia by In Labor Force | Age 20-24
In terms of in labor force | age 20-24, the demographic groups most similar to Immigrants from South Central Asia are Immigrants from Syria (74.0%, a difference of 0.010%), Turkish (73.9%, a difference of 0.030%), Immigrants from Senegal (74.0%, a difference of 0.040%), Thai (74.0%, a difference of 0.040%), and Immigrants from Panama (73.9%, a difference of 0.060%).
| Demographics | Rating | Rank | In Labor Force | Age 20-24 |
| Bermudans | 3.2 /100 | #237 | Tragic 74.1% |
| Immigrants | Japan | 3.0 /100 | #238 | Tragic 74.1% |
| Immigrants | Latin America | 2.7 /100 | #239 | Tragic 74.1% |
| Immigrants | Sri Lanka | 2.3 /100 | #240 | Tragic 74.0% |
| Immigrants | Senegal | 2.1 /100 | #241 | Tragic 74.0% |
| Thais | 2.1 /100 | #242 | Tragic 74.0% |
| Immigrants | Syria | 1.9 /100 | #243 | Tragic 74.0% |
| Immigrants | South Central Asia | 1.9 /100 | #244 | Tragic 74.0% |
| Turks | 1.8 /100 | #245 | Tragic 73.9% |
| Immigrants | Panama | 1.6 /100 | #246 | Tragic 73.9% |
| Colville | 1.5 /100 | #247 | Tragic 73.9% |
| Immigrants | Saudi Arabia | 1.5 /100 | #248 | Tragic 73.9% |
| Blacks/African Americans | 1.3 /100 | #249 | Tragic 73.9% |
| Immigrants | Belgium | 1.3 /100 | #250 | Tragic 73.9% |
| Immigrants | Egypt | 1.2 /100 | #251 | Tragic 73.8% |