Immigrants from Pakistan vs Immigrants from Europe Disability
COMPARE
Immigrants from Pakistan
Immigrants from Europe
Disability
Disability Comparison
Immigrants from Pakistan
Immigrants from Europe
10.4%
DISABILITY
100.0/ 100
METRIC RATING
19th/ 347
METRIC RANK
11.4%
DISABILITY
90.4/ 100
METRIC RATING
128th/ 347
METRIC RANK
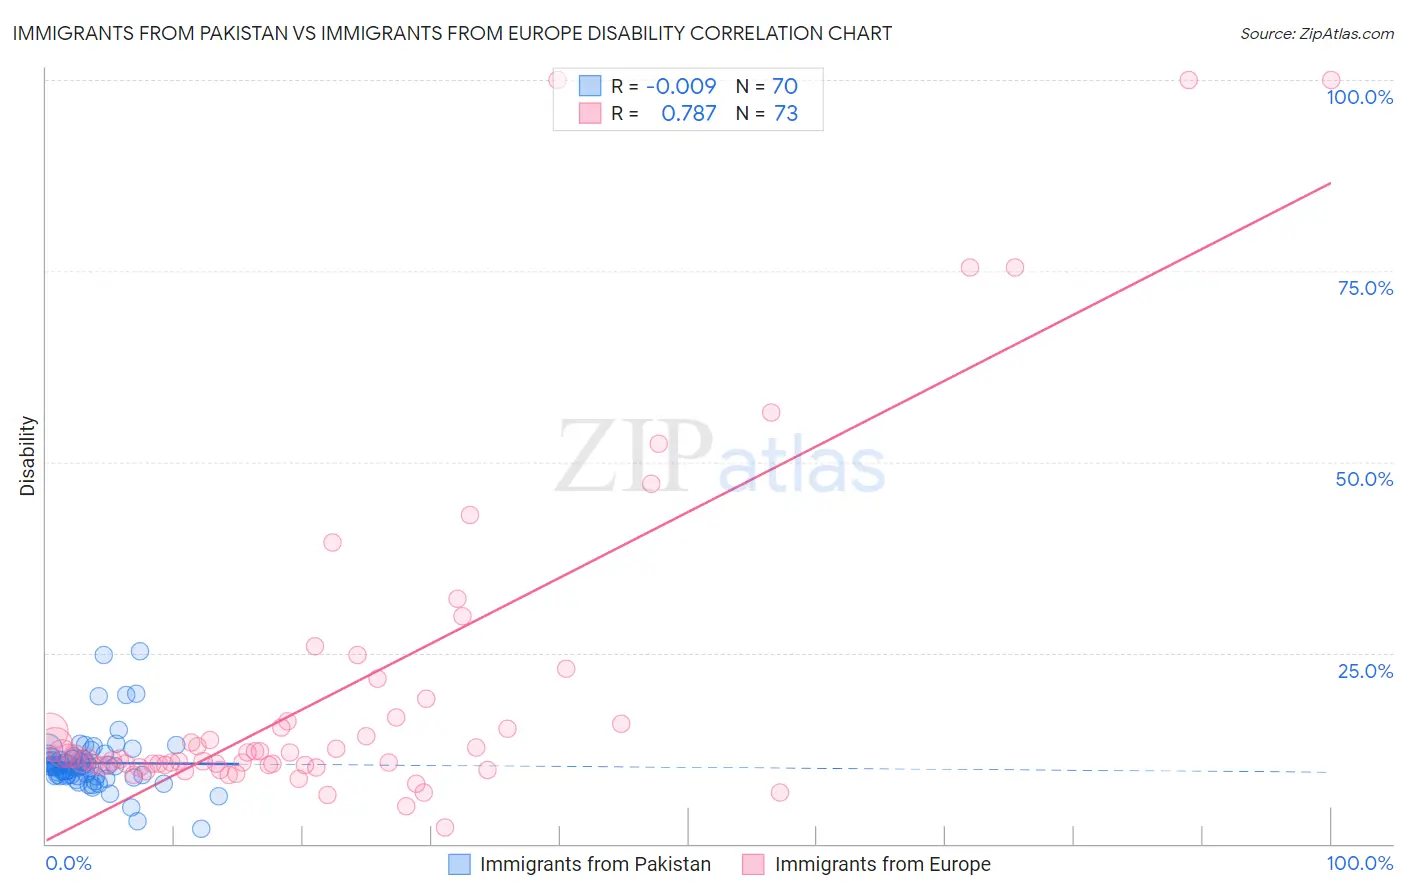
Immigrants from Pakistan vs Immigrants from Europe Disability Correlation Chart
The statistical analysis conducted on geographies consisting of 283,903,019 people shows no correlation between the proportion of Immigrants from Pakistan and percentage of population with a disability in the United States with a correlation coefficient (R) of -0.009 and weighted average of 10.4%. Similarly, the statistical analysis conducted on geographies consisting of 547,337,167 people shows a strong positive correlation between the proportion of Immigrants from Europe and percentage of population with a disability in the United States with a correlation coefficient (R) of 0.787 and weighted average of 11.4%, a difference of 10.0%.
Disability Correlation Summary
| Measurement | Immigrants from Pakistan | Immigrants from Europe |
| Minimum | 2.0% | 2.1% |
| Maximum | 25.2% | 100.0% |
| Range | 23.2% | 97.9% |
| Mean | 10.6% | 20.2% |
| Median | 10.1% | 11.4% |
| Interquartile 25% (IQ1) | 8.9% | 10.2% |
| Interquartile 75% (IQ3) | 11.2% | 16.3% |
| Interquartile Range (IQR) | 2.3% | 6.0% |
| Standard Deviation (Sample) | 3.8% | 22.0% |
| Standard Deviation (Population) | 3.8% | 21.8% |
Similar Demographics by Disability
Demographics Similar to Immigrants from Pakistan by Disability
In terms of disability, the demographic groups most similar to Immigrants from Pakistan are Burmese (10.4%, a difference of 0.010%), Immigrants from Venezuela (10.4%, a difference of 0.69%), Asian (10.4%, a difference of 0.72%), Immigrants from Sri Lanka (10.5%, a difference of 0.82%), and Immigrants from Iran (10.3%, a difference of 0.99%).
| Demographics | Rating | Rank | Disability |
| Immigrants | Israel | 100.0 /100 | #12 | Exceptional 10.1% |
| Immigrants | Eastern Asia | 100.0 /100 | #13 | Exceptional 10.2% |
| Immigrants | Korea | 100.0 /100 | #14 | Exceptional 10.2% |
| Okinawans | 100.0 /100 | #15 | Exceptional 10.3% |
| Indians (Asian) | 100.0 /100 | #16 | Exceptional 10.3% |
| Immigrants | Iran | 100.0 /100 | #17 | Exceptional 10.3% |
| Burmese | 100.0 /100 | #18 | Exceptional 10.4% |
| Immigrants | Pakistan | 100.0 /100 | #19 | Exceptional 10.4% |
| Immigrants | Venezuela | 100.0 /100 | #20 | Exceptional 10.4% |
| Asians | 100.0 /100 | #21 | Exceptional 10.4% |
| Immigrants | Sri Lanka | 100.0 /100 | #22 | Exceptional 10.5% |
| Immigrants | Asia | 100.0 /100 | #23 | Exceptional 10.5% |
| Venezuelans | 100.0 /100 | #24 | Exceptional 10.5% |
| Immigrants | Malaysia | 100.0 /100 | #25 | Exceptional 10.6% |
| Argentineans | 100.0 /100 | #26 | Exceptional 10.6% |
Demographics Similar to Immigrants from Europe by Disability
In terms of disability, the demographic groups most similar to Immigrants from Europe are Immigrants from Italy (11.4%, a difference of 0.0%), Macedonian (11.4%, a difference of 0.010%), Immigrants from Latvia (11.4%, a difference of 0.070%), Latvian (11.4%, a difference of 0.070%), and Immigrants from Croatia (11.4%, a difference of 0.080%).
| Demographics | Rating | Rank | Disability |
| Immigrants | Costa Rica | 93.4 /100 | #121 | Exceptional 11.4% |
| Brazilians | 93.3 /100 | #122 | Exceptional 11.4% |
| South Africans | 92.3 /100 | #123 | Exceptional 11.4% |
| South American Indians | 92.2 /100 | #124 | Exceptional 11.4% |
| Costa Ricans | 91.9 /100 | #125 | Exceptional 11.4% |
| Immigrants | Latvia | 90.9 /100 | #126 | Exceptional 11.4% |
| Immigrants | Italy | 90.4 /100 | #127 | Exceptional 11.4% |
| Immigrants | Europe | 90.4 /100 | #128 | Exceptional 11.4% |
| Macedonians | 90.3 /100 | #129 | Exceptional 11.4% |
| Latvians | 89.8 /100 | #130 | Excellent 11.4% |
| Immigrants | Croatia | 89.8 /100 | #131 | Excellent 11.4% |
| Immigrants | Africa | 89.3 /100 | #132 | Excellent 11.4% |
| Arabs | 89.1 /100 | #133 | Excellent 11.4% |
| Immigrants | Guyana | 88.3 /100 | #134 | Excellent 11.4% |
| Ugandans | 87.9 /100 | #135 | Excellent 11.4% |