Immigrants from the Azores vs Immigrants from Europe Disability
COMPARE
Immigrants from the Azores
Immigrants from Europe
Disability
Disability Comparison
Immigrants from the Azores
Immigrants from Europe
14.2%
DISABILITY
0.0/ 100
METRIC RATING
328th/ 347
METRIC RANK
11.4%
DISABILITY
90.4/ 100
METRIC RATING
128th/ 347
METRIC RANK
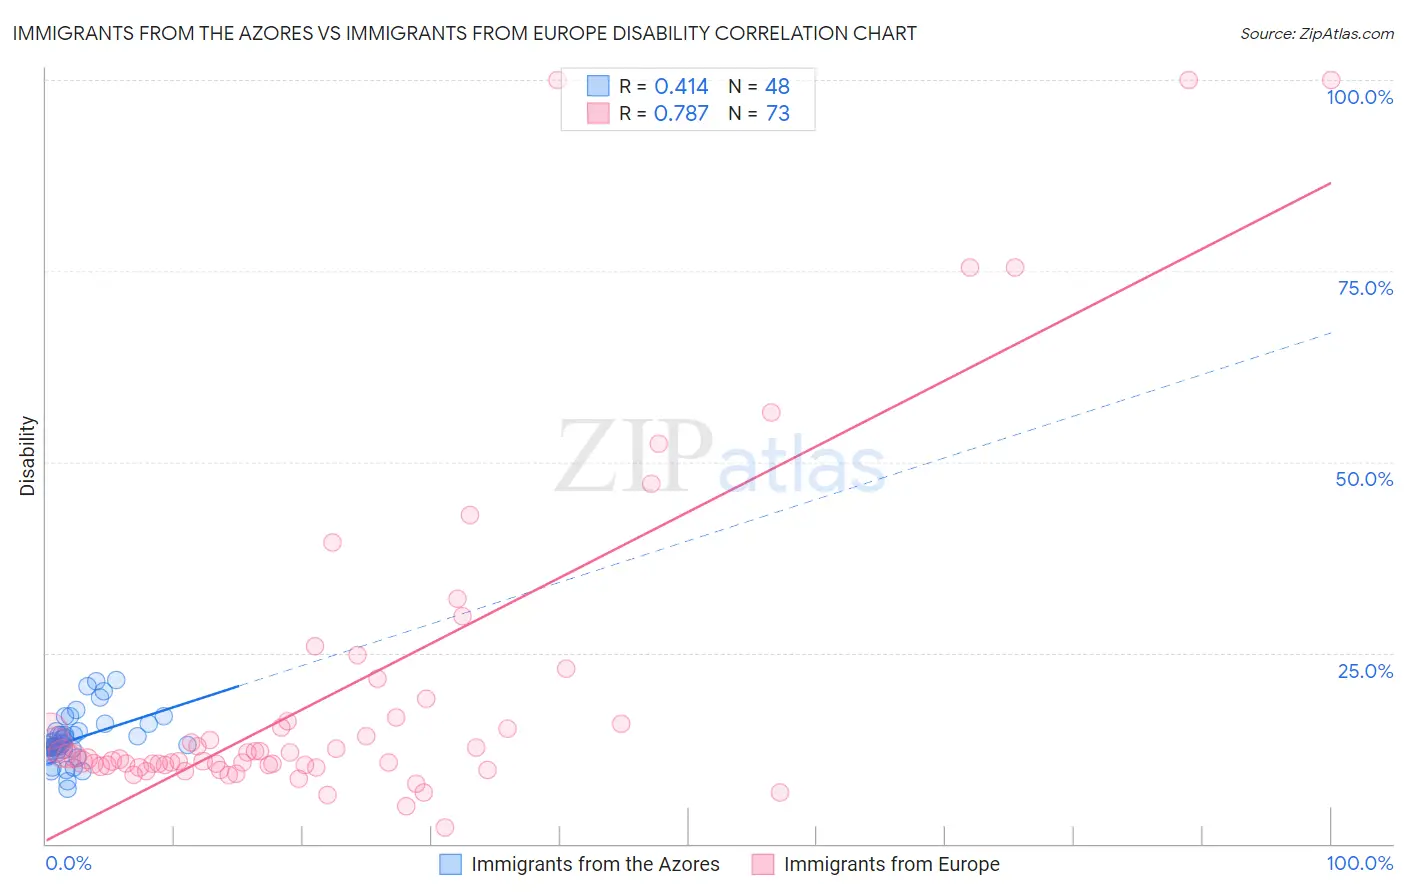
Immigrants from the Azores vs Immigrants from Europe Disability Correlation Chart
The statistical analysis conducted on geographies consisting of 46,257,178 people shows a moderate positive correlation between the proportion of Immigrants from the Azores and percentage of population with a disability in the United States with a correlation coefficient (R) of 0.414 and weighted average of 14.2%. Similarly, the statistical analysis conducted on geographies consisting of 547,337,167 people shows a strong positive correlation between the proportion of Immigrants from Europe and percentage of population with a disability in the United States with a correlation coefficient (R) of 0.787 and weighted average of 11.4%, a difference of 24.1%.
Disability Correlation Summary
| Measurement | Immigrants from the Azores | Immigrants from Europe |
| Minimum | 7.2% | 2.1% |
| Maximum | 21.5% | 100.0% |
| Range | 14.3% | 97.9% |
| Mean | 13.7% | 20.2% |
| Median | 13.1% | 11.4% |
| Interquartile 25% (IQ1) | 12.0% | 10.2% |
| Interquartile 75% (IQ3) | 14.8% | 16.3% |
| Interquartile Range (IQR) | 2.7% | 6.0% |
| Standard Deviation (Sample) | 3.2% | 22.0% |
| Standard Deviation (Population) | 3.1% | 21.8% |
Similar Demographics by Disability
Demographics Similar to Immigrants from the Azores by Disability
In terms of disability, the demographic groups most similar to Immigrants from the Azores are Ottawa (14.2%, a difference of 0.0%), Osage (14.2%, a difference of 0.020%), Native/Alaskan (14.2%, a difference of 0.060%), Chippewa (14.1%, a difference of 0.10%), and Potawatomi (14.2%, a difference of 0.12%).
| Demographics | Rating | Rank | Disability |
| Paiute | 0.0 /100 | #321 | Tragic 13.9% |
| Americans | 0.0 /100 | #322 | Tragic 13.9% |
| Comanche | 0.0 /100 | #323 | Tragic 14.1% |
| Chippewa | 0.0 /100 | #324 | Tragic 14.1% |
| Natives/Alaskans | 0.0 /100 | #325 | Tragic 14.2% |
| Osage | 0.0 /100 | #326 | Tragic 14.2% |
| Ottawa | 0.0 /100 | #327 | Tragic 14.2% |
| Immigrants | Azores | 0.0 /100 | #328 | Tragic 14.2% |
| Potawatomi | 0.0 /100 | #329 | Tragic 14.2% |
| Navajo | 0.0 /100 | #330 | Tragic 14.3% |
| Alaskan Athabascans | 0.0 /100 | #331 | Tragic 14.4% |
| Pueblo | 0.0 /100 | #332 | Tragic 14.4% |
| Cajuns | 0.0 /100 | #333 | Tragic 14.6% |
| Yuman | 0.0 /100 | #334 | Tragic 14.6% |
| Tohono O'odham | 0.0 /100 | #335 | Tragic 14.8% |
Demographics Similar to Immigrants from Europe by Disability
In terms of disability, the demographic groups most similar to Immigrants from Europe are Immigrants from Italy (11.4%, a difference of 0.0%), Macedonian (11.4%, a difference of 0.010%), Immigrants from Latvia (11.4%, a difference of 0.070%), Latvian (11.4%, a difference of 0.070%), and Immigrants from Croatia (11.4%, a difference of 0.080%).
| Demographics | Rating | Rank | Disability |
| Immigrants | Costa Rica | 93.4 /100 | #121 | Exceptional 11.4% |
| Brazilians | 93.3 /100 | #122 | Exceptional 11.4% |
| South Africans | 92.3 /100 | #123 | Exceptional 11.4% |
| South American Indians | 92.2 /100 | #124 | Exceptional 11.4% |
| Costa Ricans | 91.9 /100 | #125 | Exceptional 11.4% |
| Immigrants | Latvia | 90.9 /100 | #126 | Exceptional 11.4% |
| Immigrants | Italy | 90.4 /100 | #127 | Exceptional 11.4% |
| Immigrants | Europe | 90.4 /100 | #128 | Exceptional 11.4% |
| Macedonians | 90.3 /100 | #129 | Exceptional 11.4% |
| Latvians | 89.8 /100 | #130 | Excellent 11.4% |
| Immigrants | Croatia | 89.8 /100 | #131 | Excellent 11.4% |
| Immigrants | Africa | 89.3 /100 | #132 | Excellent 11.4% |
| Arabs | 89.1 /100 | #133 | Excellent 11.4% |
| Immigrants | Guyana | 88.3 /100 | #134 | Excellent 11.4% |
| Ugandans | 87.9 /100 | #135 | Excellent 11.4% |