African vs Immigrants from Europe Disability
COMPARE
African
Immigrants from Europe
Disability
Disability Comparison
Africans
Immigrants from Europe
13.0%
DISABILITY
0.0/ 100
METRIC RATING
287th/ 347
METRIC RANK
11.4%
DISABILITY
90.4/ 100
METRIC RATING
128th/ 347
METRIC RANK
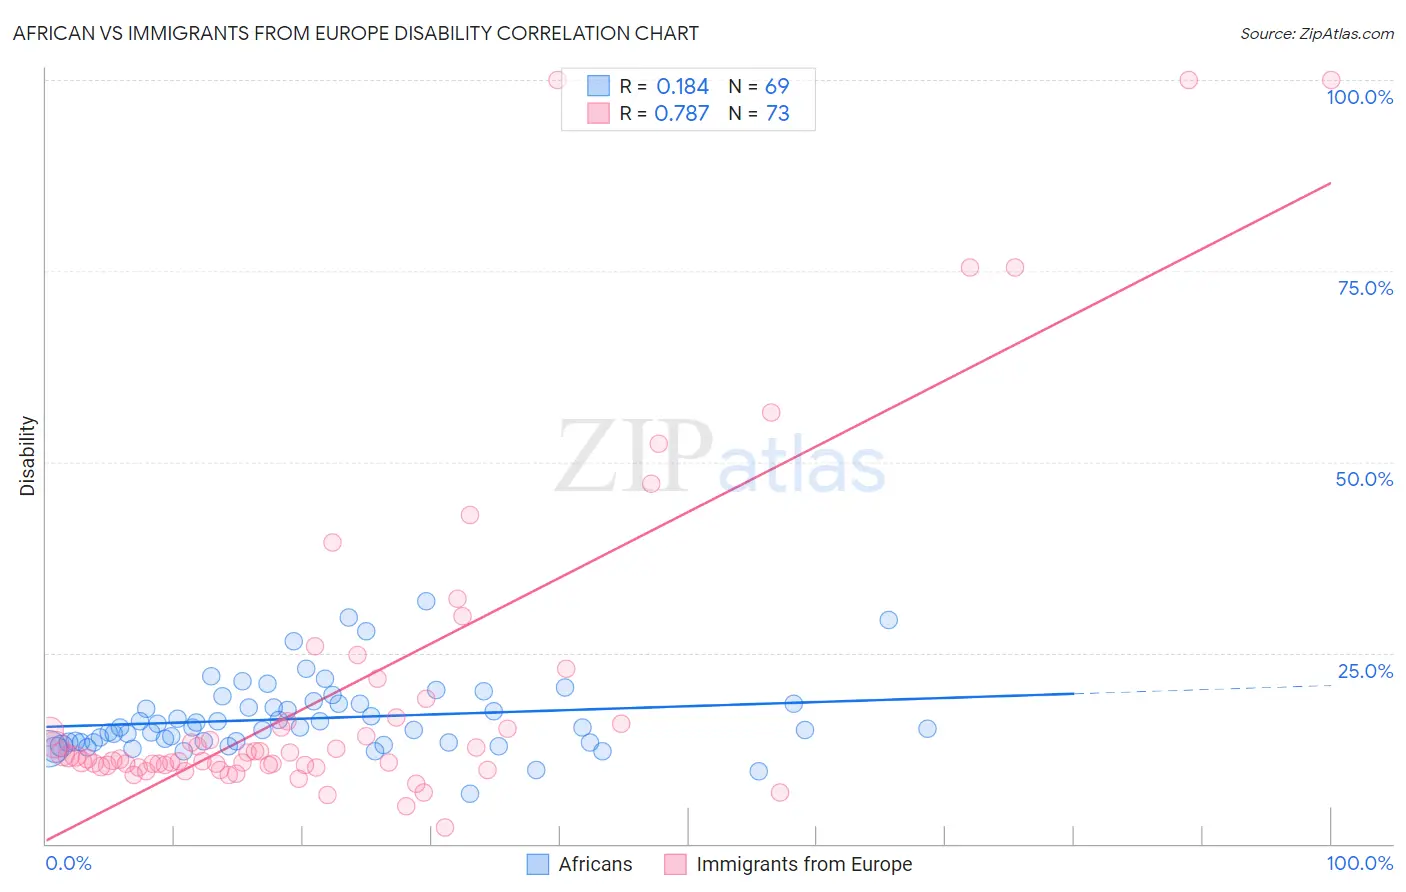
African vs Immigrants from Europe Disability Correlation Chart
The statistical analysis conducted on geographies consisting of 469,989,744 people shows a poor positive correlation between the proportion of Africans and percentage of population with a disability in the United States with a correlation coefficient (R) of 0.184 and weighted average of 13.0%. Similarly, the statistical analysis conducted on geographies consisting of 547,337,167 people shows a strong positive correlation between the proportion of Immigrants from Europe and percentage of population with a disability in the United States with a correlation coefficient (R) of 0.787 and weighted average of 11.4%, a difference of 14.0%.
Disability Correlation Summary
| Measurement | African | Immigrants from Europe |
| Minimum | 6.6% | 2.1% |
| Maximum | 31.8% | 100.0% |
| Range | 25.2% | 97.9% |
| Mean | 16.4% | 20.2% |
| Median | 15.2% | 11.4% |
| Interquartile 25% (IQ1) | 13.3% | 10.2% |
| Interquartile 75% (IQ3) | 18.3% | 16.3% |
| Interquartile Range (IQR) | 5.0% | 6.0% |
| Standard Deviation (Sample) | 4.7% | 22.0% |
| Standard Deviation (Population) | 4.7% | 21.8% |
Similar Demographics by Disability
Demographics Similar to Africans by Disability
In terms of disability, the demographic groups most similar to Africans are White/Caucasian (13.0%, a difference of 0.020%), Slovak (13.0%, a difference of 0.020%), Cheyenne (13.0%, a difference of 0.080%), Yaqui (13.1%, a difference of 0.31%), and English (13.0%, a difference of 0.41%).
| Demographics | Rating | Rank | Disability |
| Spanish | 0.0 /100 | #280 | Tragic 12.8% |
| Immigrants | Portugal | 0.0 /100 | #281 | Tragic 12.9% |
| Scottish | 0.0 /100 | #282 | Tragic 12.9% |
| Irish | 0.0 /100 | #283 | Tragic 12.9% |
| Welsh | 0.0 /100 | #284 | Tragic 12.9% |
| Crow | 0.0 /100 | #285 | Tragic 12.9% |
| English | 0.0 /100 | #286 | Tragic 13.0% |
| Africans | 0.0 /100 | #287 | Tragic 13.0% |
| Whites/Caucasians | 0.0 /100 | #288 | Tragic 13.0% |
| Slovaks | 0.0 /100 | #289 | Tragic 13.0% |
| Cheyenne | 0.0 /100 | #290 | Tragic 13.0% |
| Yaqui | 0.0 /100 | #291 | Tragic 13.1% |
| Aleuts | 0.0 /100 | #292 | Tragic 13.1% |
| Marshallese | 0.0 /100 | #293 | Tragic 13.1% |
| Celtics | 0.0 /100 | #294 | Tragic 13.1% |
Demographics Similar to Immigrants from Europe by Disability
In terms of disability, the demographic groups most similar to Immigrants from Europe are Immigrants from Italy (11.4%, a difference of 0.0%), Macedonian (11.4%, a difference of 0.010%), Immigrants from Latvia (11.4%, a difference of 0.070%), Latvian (11.4%, a difference of 0.070%), and Immigrants from Croatia (11.4%, a difference of 0.080%).
| Demographics | Rating | Rank | Disability |
| Immigrants | Costa Rica | 93.4 /100 | #121 | Exceptional 11.4% |
| Brazilians | 93.3 /100 | #122 | Exceptional 11.4% |
| South Africans | 92.3 /100 | #123 | Exceptional 11.4% |
| South American Indians | 92.2 /100 | #124 | Exceptional 11.4% |
| Costa Ricans | 91.9 /100 | #125 | Exceptional 11.4% |
| Immigrants | Latvia | 90.9 /100 | #126 | Exceptional 11.4% |
| Immigrants | Italy | 90.4 /100 | #127 | Exceptional 11.4% |
| Immigrants | Europe | 90.4 /100 | #128 | Exceptional 11.4% |
| Macedonians | 90.3 /100 | #129 | Exceptional 11.4% |
| Latvians | 89.8 /100 | #130 | Excellent 11.4% |
| Immigrants | Croatia | 89.8 /100 | #131 | Excellent 11.4% |
| Immigrants | Africa | 89.3 /100 | #132 | Excellent 11.4% |
| Arabs | 89.1 /100 | #133 | Excellent 11.4% |
| Immigrants | Guyana | 88.3 /100 | #134 | Excellent 11.4% |
| Ugandans | 87.9 /100 | #135 | Excellent 11.4% |