Turkish vs Barbadian Disability Age 5 to 17
COMPARE
Turkish
Barbadian
Disability Age 5 to 17
Disability Age 5 to 17 Comparison
Turks
Barbadians
5.1%
DISABILITY AGE 5 TO 17
99.9/ 100
METRIC RATING
51st/ 347
METRIC RANK
5.9%
DISABILITY AGE 5 TO 17
1.3/ 100
METRIC RATING
254th/ 347
METRIC RANK
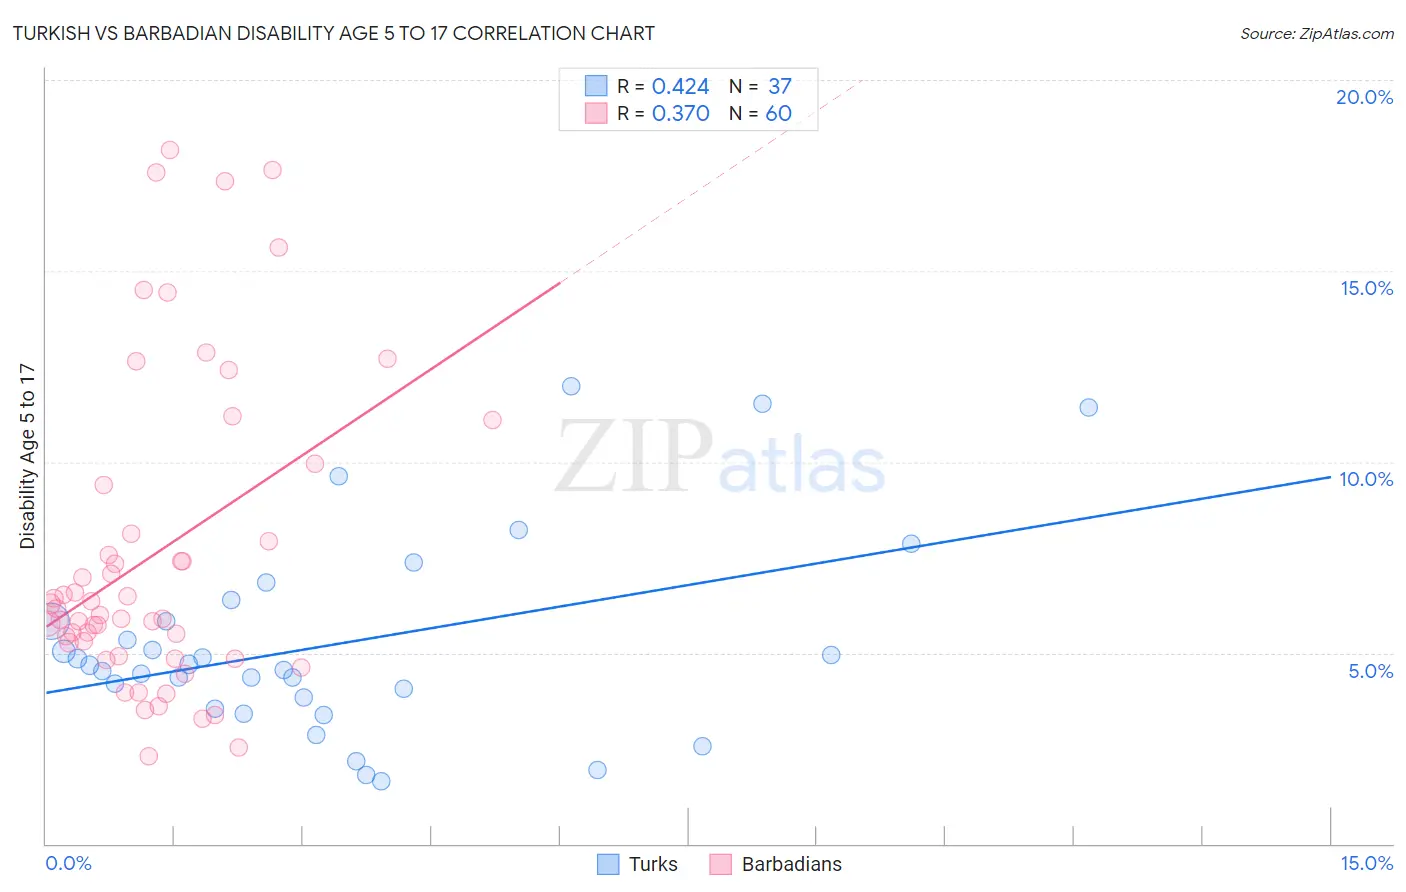
Turkish vs Barbadian Disability Age 5 to 17 Correlation Chart
The statistical analysis conducted on geographies consisting of 270,239,204 people shows a moderate positive correlation between the proportion of Turks and percentage of population with a disability between the ages 5 and 17 in the United States with a correlation coefficient (R) of 0.424 and weighted average of 5.1%. Similarly, the statistical analysis conducted on geographies consisting of 140,971,871 people shows a mild positive correlation between the proportion of Barbadians and percentage of population with a disability between the ages 5 and 17 in the United States with a correlation coefficient (R) of 0.370 and weighted average of 5.9%, a difference of 15.7%.
Disability Age 5 to 17 Correlation Summary
| Measurement | Turkish | Barbadian |
| Minimum | 1.7% | 2.3% |
| Maximum | 12.0% | 18.2% |
| Range | 10.3% | 15.9% |
| Mean | 5.3% | 7.6% |
| Median | 4.7% | 6.1% |
| Interquartile 25% (IQ1) | 3.7% | 5.1% |
| Interquartile 75% (IQ3) | 6.1% | 8.8% |
| Interquartile Range (IQR) | 2.4% | 3.7% |
| Standard Deviation (Sample) | 2.6% | 4.1% |
| Standard Deviation (Population) | 2.6% | 4.0% |
Similar Demographics by Disability Age 5 to 17
Demographics Similar to Turks by Disability Age 5 to 17
In terms of disability age 5 to 17, the demographic groups most similar to Turks are Immigrants from Fiji (5.1%, a difference of 0.090%), Immigrants from Lithuania (5.1%, a difference of 0.14%), Paraguayan (5.1%, a difference of 0.17%), Laotian (5.1%, a difference of 0.22%), and Immigrants from Turkey (5.1%, a difference of 0.23%).
| Demographics | Rating | Rank | Disability Age 5 to 17 |
| Egyptians | 100.0 /100 | #44 | Exceptional 5.0% |
| Tongans | 100.0 /100 | #45 | Exceptional 5.0% |
| Assyrians/Chaldeans/Syriacs | 100.0 /100 | #46 | Exceptional 5.0% |
| Vietnamese | 100.0 /100 | #47 | Exceptional 5.1% |
| Koreans | 100.0 /100 | #48 | Exceptional 5.1% |
| Immigrants | Western Asia | 100.0 /100 | #49 | Exceptional 5.1% |
| Argentineans | 99.9 /100 | #50 | Exceptional 5.1% |
| Turks | 99.9 /100 | #51 | Exceptional 5.1% |
| Immigrants | Fiji | 99.9 /100 | #52 | Exceptional 5.1% |
| Immigrants | Lithuania | 99.9 /100 | #53 | Exceptional 5.1% |
| Paraguayans | 99.9 /100 | #54 | Exceptional 5.1% |
| Laotians | 99.9 /100 | #55 | Exceptional 5.1% |
| Immigrants | Turkey | 99.9 /100 | #56 | Exceptional 5.1% |
| Immigrants | Poland | 99.9 /100 | #57 | Exceptional 5.1% |
| Immigrants | Ukraine | 99.9 /100 | #58 | Exceptional 5.1% |
Demographics Similar to Barbadians by Disability Age 5 to 17
In terms of disability age 5 to 17, the demographic groups most similar to Barbadians are Italian (5.9%, a difference of 0.070%), Scandinavian (5.9%, a difference of 0.10%), Honduran (5.9%, a difference of 0.17%), Immigrants from Cambodia (5.9%, a difference of 0.19%), and Polish (5.9%, a difference of 0.22%).
| Demographics | Rating | Rank | Disability Age 5 to 17 |
| Immigrants | Honduras | 1.8 /100 | #247 | Tragic 5.9% |
| British | 1.7 /100 | #248 | Tragic 5.9% |
| Immigrants | Ghana | 1.7 /100 | #249 | Tragic 5.9% |
| Poles | 1.5 /100 | #250 | Tragic 5.9% |
| Immigrants | Cambodia | 1.5 /100 | #251 | Tragic 5.9% |
| Hondurans | 1.5 /100 | #252 | Tragic 5.9% |
| Scandinavians | 1.4 /100 | #253 | Tragic 5.9% |
| Barbadians | 1.3 /100 | #254 | Tragic 5.9% |
| Italians | 1.2 /100 | #255 | Tragic 5.9% |
| Hopi | 1.0 /100 | #256 | Tragic 5.9% |
| Hispanics or Latinos | 1.0 /100 | #257 | Tragic 5.9% |
| Brazilians | 0.9 /100 | #258 | Tragic 5.9% |
| Slavs | 0.9 /100 | #259 | Tragic 5.9% |
| Somalis | 0.8 /100 | #260 | Tragic 5.9% |
| Immigrants | Middle Africa | 0.7 /100 | #261 | Tragic 5.9% |