Immigrants from Zimbabwe vs Barbadian Disability Age 5 to 17
COMPARE
Immigrants from Zimbabwe
Barbadian
Disability Age 5 to 17
Disability Age 5 to 17 Comparison
Immigrants from Zimbabwe
Barbadians
5.5%
DISABILITY AGE 5 TO 17
75.3/ 100
METRIC RATING
159th/ 347
METRIC RANK
5.9%
DISABILITY AGE 5 TO 17
1.3/ 100
METRIC RATING
254th/ 347
METRIC RANK
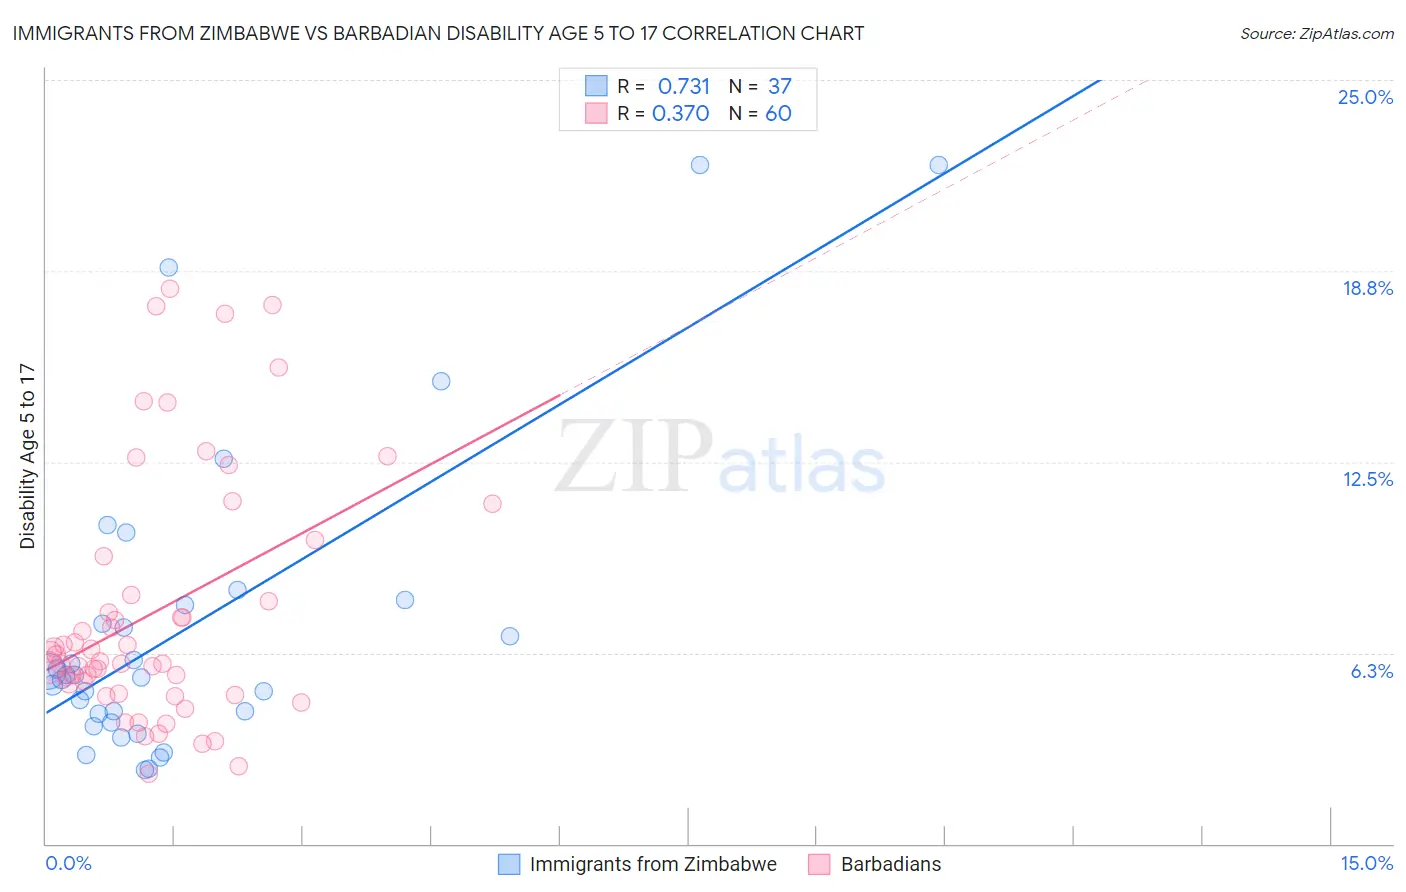
Immigrants from Zimbabwe vs Barbadian Disability Age 5 to 17 Correlation Chart
The statistical analysis conducted on geographies consisting of 117,554,818 people shows a strong positive correlation between the proportion of Immigrants from Zimbabwe and percentage of population with a disability between the ages 5 and 17 in the United States with a correlation coefficient (R) of 0.731 and weighted average of 5.5%. Similarly, the statistical analysis conducted on geographies consisting of 140,971,871 people shows a mild positive correlation between the proportion of Barbadians and percentage of population with a disability between the ages 5 and 17 in the United States with a correlation coefficient (R) of 0.370 and weighted average of 5.9%, a difference of 6.8%.
Disability Age 5 to 17 Correlation Summary
| Measurement | Immigrants from Zimbabwe | Barbadian |
| Minimum | 2.4% | 2.3% |
| Maximum | 22.2% | 18.2% |
| Range | 19.8% | 15.9% |
| Mean | 7.1% | 7.6% |
| Median | 5.5% | 6.1% |
| Interquartile 25% (IQ1) | 4.1% | 5.1% |
| Interquartile 75% (IQ3) | 7.9% | 8.8% |
| Interquartile Range (IQR) | 3.8% | 3.7% |
| Standard Deviation (Sample) | 5.0% | 4.1% |
| Standard Deviation (Population) | 5.0% | 4.0% |
Similar Demographics by Disability Age 5 to 17
Demographics Similar to Immigrants from Zimbabwe by Disability Age 5 to 17
In terms of disability age 5 to 17, the demographic groups most similar to Immigrants from Zimbabwe are Immigrants from Nepal (5.5%, a difference of 0.13%), South African (5.5%, a difference of 0.13%), Immigrants from Costa Rica (5.5%, a difference of 0.18%), Hawaiian (5.5%, a difference of 0.19%), and Immigrants from Ecuador (5.5%, a difference of 0.21%).
| Demographics | Rating | Rank | Disability Age 5 to 17 |
| Ute | 80.6 /100 | #152 | Excellent 5.5% |
| Ecuadorians | 79.7 /100 | #153 | Good 5.5% |
| Australians | 78.8 /100 | #154 | Good 5.5% |
| Immigrants | Ecuador | 78.3 /100 | #155 | Good 5.5% |
| Hawaiians | 78.0 /100 | #156 | Good 5.5% |
| Immigrants | Costa Rica | 77.9 /100 | #157 | Good 5.5% |
| Immigrants | Nepal | 77.1 /100 | #158 | Good 5.5% |
| Immigrants | Zimbabwe | 75.3 /100 | #159 | Good 5.5% |
| South Africans | 73.3 /100 | #160 | Good 5.5% |
| Immigrants | Saudi Arabia | 69.1 /100 | #161 | Good 5.5% |
| Zimbabweans | 67.2 /100 | #162 | Good 5.5% |
| Immigrants | Southern Europe | 64.0 /100 | #163 | Good 5.6% |
| Immigrants | Scotland | 61.9 /100 | #164 | Good 5.6% |
| Lebanese | 61.4 /100 | #165 | Good 5.6% |
| Greeks | 60.6 /100 | #166 | Good 5.6% |
Demographics Similar to Barbadians by Disability Age 5 to 17
In terms of disability age 5 to 17, the demographic groups most similar to Barbadians are Italian (5.9%, a difference of 0.070%), Scandinavian (5.9%, a difference of 0.10%), Honduran (5.9%, a difference of 0.17%), Immigrants from Cambodia (5.9%, a difference of 0.19%), and Polish (5.9%, a difference of 0.22%).
| Demographics | Rating | Rank | Disability Age 5 to 17 |
| Immigrants | Honduras | 1.8 /100 | #247 | Tragic 5.9% |
| British | 1.7 /100 | #248 | Tragic 5.9% |
| Immigrants | Ghana | 1.7 /100 | #249 | Tragic 5.9% |
| Poles | 1.5 /100 | #250 | Tragic 5.9% |
| Immigrants | Cambodia | 1.5 /100 | #251 | Tragic 5.9% |
| Hondurans | 1.5 /100 | #252 | Tragic 5.9% |
| Scandinavians | 1.4 /100 | #253 | Tragic 5.9% |
| Barbadians | 1.3 /100 | #254 | Tragic 5.9% |
| Italians | 1.2 /100 | #255 | Tragic 5.9% |
| Hopi | 1.0 /100 | #256 | Tragic 5.9% |
| Hispanics or Latinos | 1.0 /100 | #257 | Tragic 5.9% |
| Brazilians | 0.9 /100 | #258 | Tragic 5.9% |
| Slavs | 0.9 /100 | #259 | Tragic 5.9% |
| Somalis | 0.8 /100 | #260 | Tragic 5.9% |
| Immigrants | Middle Africa | 0.7 /100 | #261 | Tragic 5.9% |