Immigrants from Austria vs Barbadian Disability Age 5 to 17
COMPARE
Immigrants from Austria
Barbadian
Disability Age 5 to 17
Disability Age 5 to 17 Comparison
Immigrants from Austria
Barbadians
5.3%
DISABILITY AGE 5 TO 17
98.9/ 100
METRIC RATING
98th/ 347
METRIC RANK
5.9%
DISABILITY AGE 5 TO 17
1.3/ 100
METRIC RATING
254th/ 347
METRIC RANK
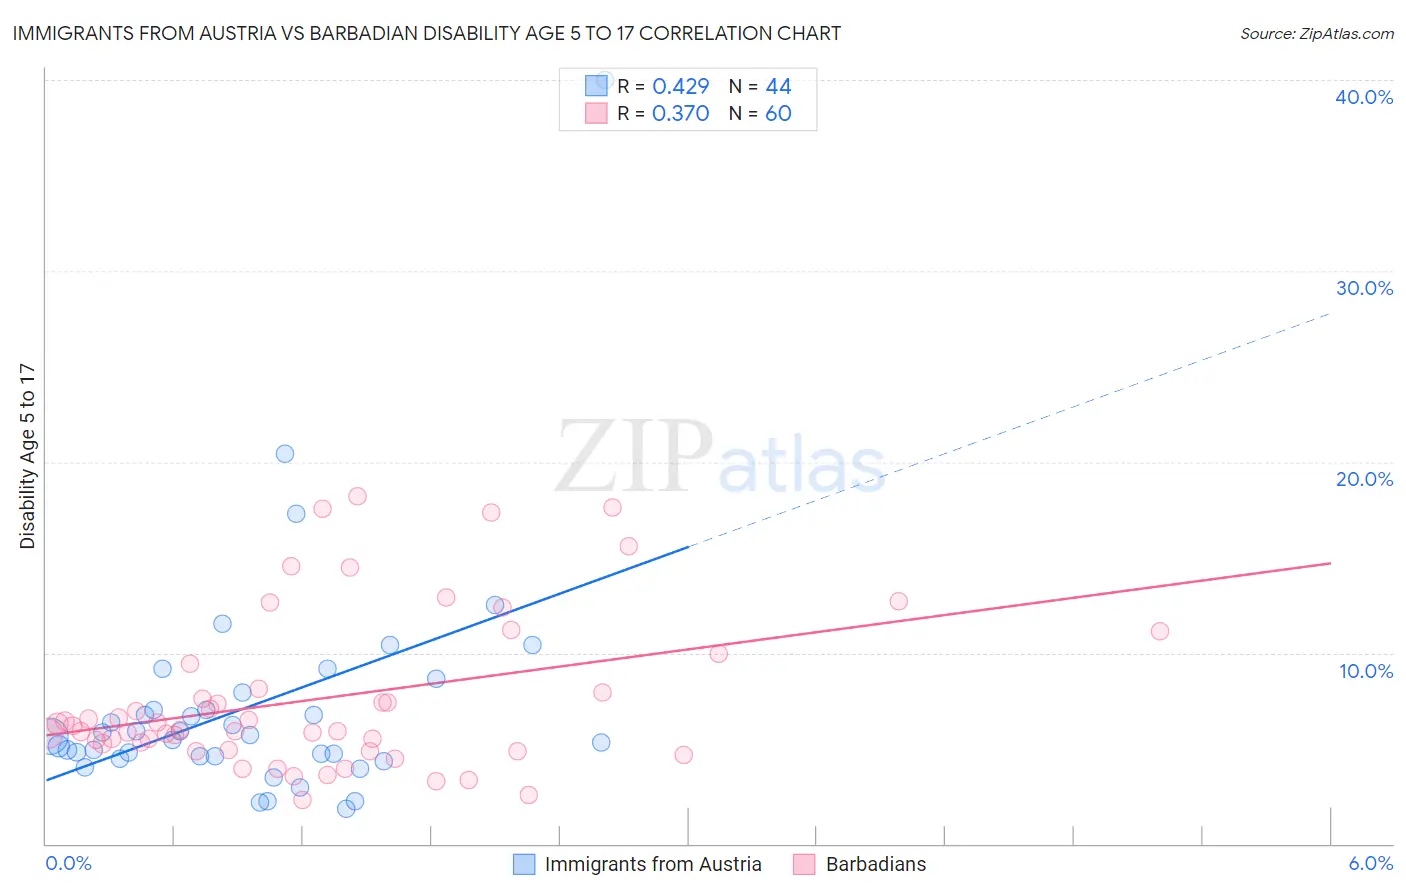
Immigrants from Austria vs Barbadian Disability Age 5 to 17 Correlation Chart
The statistical analysis conducted on geographies consisting of 166,993,239 people shows a moderate positive correlation between the proportion of Immigrants from Austria and percentage of population with a disability between the ages 5 and 17 in the United States with a correlation coefficient (R) of 0.429 and weighted average of 5.3%. Similarly, the statistical analysis conducted on geographies consisting of 140,971,871 people shows a mild positive correlation between the proportion of Barbadians and percentage of population with a disability between the ages 5 and 17 in the United States with a correlation coefficient (R) of 0.370 and weighted average of 5.9%, a difference of 11.6%.
Disability Age 5 to 17 Correlation Summary
| Measurement | Immigrants from Austria | Barbadian |
| Minimum | 1.8% | 2.3% |
| Maximum | 40.0% | 18.2% |
| Range | 38.2% | 15.9% |
| Mean | 7.2% | 7.6% |
| Median | 5.7% | 6.1% |
| Interquartile 25% (IQ1) | 4.6% | 5.1% |
| Interquartile 75% (IQ3) | 7.4% | 8.8% |
| Interquartile Range (IQR) | 2.8% | 3.7% |
| Standard Deviation (Sample) | 6.2% | 4.1% |
| Standard Deviation (Population) | 6.2% | 4.0% |
Similar Demographics by Disability Age 5 to 17
Demographics Similar to Immigrants from Austria by Disability Age 5 to 17
In terms of disability age 5 to 17, the demographic groups most similar to Immigrants from Austria are Immigrants from El Salvador (5.3%, a difference of 0.050%), Immigrants from Europe (5.3%, a difference of 0.050%), Cambodian (5.3%, a difference of 0.090%), Immigrants from Grenada (5.3%, a difference of 0.21%), and Immigrants from Jordan (5.3%, a difference of 0.23%).
| Demographics | Rating | Rank | Disability Age 5 to 17 |
| Mongolians | 99.2 /100 | #91 | Exceptional 5.3% |
| Luxembourgers | 99.2 /100 | #92 | Exceptional 5.3% |
| Immigrants | Peru | 99.1 /100 | #93 | Exceptional 5.3% |
| Immigrants | Jordan | 99.1 /100 | #94 | Exceptional 5.3% |
| Immigrants | Grenada | 99.1 /100 | #95 | Exceptional 5.3% |
| Immigrants | El Salvador | 99.0 /100 | #96 | Exceptional 5.3% |
| Immigrants | Europe | 99.0 /100 | #97 | Exceptional 5.3% |
| Immigrants | Austria | 98.9 /100 | #98 | Exceptional 5.3% |
| Cambodians | 98.8 /100 | #99 | Exceptional 5.3% |
| Nepalese | 98.7 /100 | #100 | Exceptional 5.3% |
| Menominee | 98.7 /100 | #101 | Exceptional 5.3% |
| Nicaraguans | 98.6 /100 | #102 | Exceptional 5.3% |
| Salvadorans | 98.6 /100 | #103 | Exceptional 5.3% |
| Peruvians | 98.5 /100 | #104 | Exceptional 5.3% |
| Immigrants | Italy | 98.4 /100 | #105 | Exceptional 5.3% |
Demographics Similar to Barbadians by Disability Age 5 to 17
In terms of disability age 5 to 17, the demographic groups most similar to Barbadians are Italian (5.9%, a difference of 0.070%), Scandinavian (5.9%, a difference of 0.10%), Honduran (5.9%, a difference of 0.17%), Immigrants from Cambodia (5.9%, a difference of 0.19%), and Polish (5.9%, a difference of 0.22%).
| Demographics | Rating | Rank | Disability Age 5 to 17 |
| Immigrants | Honduras | 1.8 /100 | #247 | Tragic 5.9% |
| British | 1.7 /100 | #248 | Tragic 5.9% |
| Immigrants | Ghana | 1.7 /100 | #249 | Tragic 5.9% |
| Poles | 1.5 /100 | #250 | Tragic 5.9% |
| Immigrants | Cambodia | 1.5 /100 | #251 | Tragic 5.9% |
| Hondurans | 1.5 /100 | #252 | Tragic 5.9% |
| Scandinavians | 1.4 /100 | #253 | Tragic 5.9% |
| Barbadians | 1.3 /100 | #254 | Tragic 5.9% |
| Italians | 1.2 /100 | #255 | Tragic 5.9% |
| Hopi | 1.0 /100 | #256 | Tragic 5.9% |
| Hispanics or Latinos | 1.0 /100 | #257 | Tragic 5.9% |
| Brazilians | 0.9 /100 | #258 | Tragic 5.9% |
| Slavs | 0.9 /100 | #259 | Tragic 5.9% |
| Somalis | 0.8 /100 | #260 | Tragic 5.9% |
| Immigrants | Middle Africa | 0.7 /100 | #261 | Tragic 5.9% |