Turkish vs Barbadian 9th Grade
COMPARE
Turkish
Barbadian
9th Grade
9th Grade Comparison
Turks
Barbadians
95.8%
9TH GRADE
99.5/ 100
METRIC RATING
72nd/ 347
METRIC RANK
93.5%
9TH GRADE
0.0/ 100
METRIC RATING
283rd/ 347
METRIC RANK
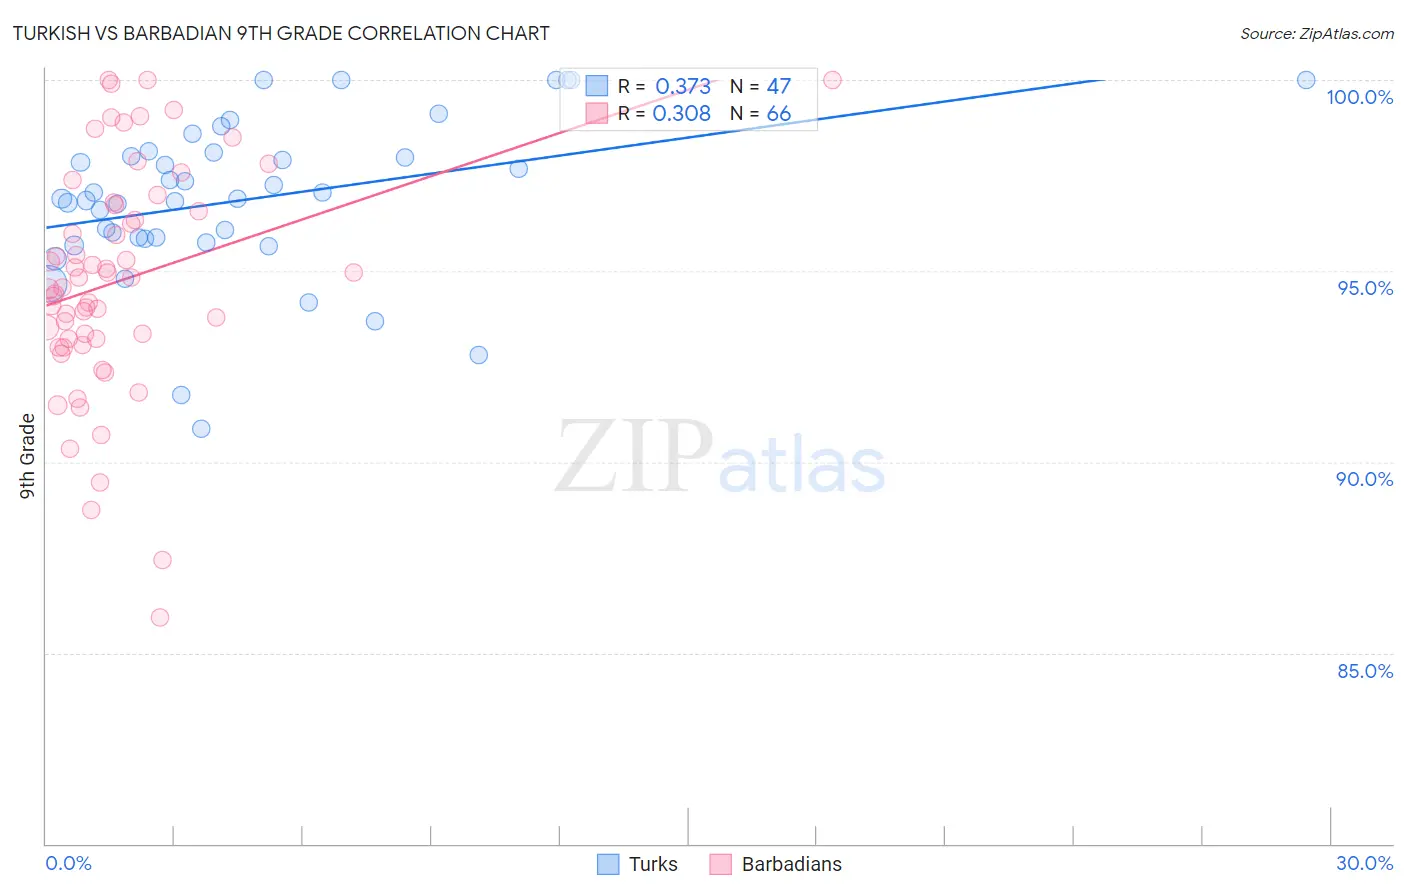
Turkish vs Barbadian 9th Grade Correlation Chart
The statistical analysis conducted on geographies consisting of 271,864,133 people shows a mild positive correlation between the proportion of Turks and percentage of population with at least 9th grade education in the United States with a correlation coefficient (R) of 0.373 and weighted average of 95.8%. Similarly, the statistical analysis conducted on geographies consisting of 141,304,456 people shows a mild positive correlation between the proportion of Barbadians and percentage of population with at least 9th grade education in the United States with a correlation coefficient (R) of 0.308 and weighted average of 93.5%, a difference of 2.5%.
9th Grade Correlation Summary
| Measurement | Turkish | Barbadian |
| Minimum | 90.9% | 85.9% |
| Maximum | 100.0% | 100.0% |
| Range | 9.1% | 14.1% |
| Mean | 96.9% | 94.7% |
| Median | 96.9% | 94.7% |
| Interquartile 25% (IQ1) | 95.9% | 93.2% |
| Interquartile 75% (IQ3) | 98.1% | 96.7% |
| Interquartile Range (IQR) | 2.3% | 3.5% |
| Standard Deviation (Sample) | 2.1% | 3.0% |
| Standard Deviation (Population) | 2.1% | 3.0% |
Similar Demographics by 9th Grade
Demographics Similar to Turks by 9th Grade
In terms of 9th grade, the demographic groups most similar to Turks are Immigrants from Belgium (95.8%, a difference of 0.0%), Immigrants from Singapore (95.8%, a difference of 0.0%), Immigrants from Australia (95.8%, a difference of 0.010%), Thai (95.8%, a difference of 0.010%), and Immigrants from Ireland (95.8%, a difference of 0.020%).
| Demographics | Rating | Rank | 9th Grade |
| Immigrants | England | 99.6 /100 | #65 | Exceptional 95.9% |
| Immigrants | Netherlands | 99.6 /100 | #66 | Exceptional 95.8% |
| Cypriots | 99.6 /100 | #67 | Exceptional 95.8% |
| Immigrants | Ireland | 99.6 /100 | #68 | Exceptional 95.8% |
| Immigrants | Lithuania | 99.6 /100 | #69 | Exceptional 95.8% |
| Immigrants | Australia | 99.5 /100 | #70 | Exceptional 95.8% |
| Immigrants | Belgium | 99.5 /100 | #71 | Exceptional 95.8% |
| Turks | 99.5 /100 | #72 | Exceptional 95.8% |
| Immigrants | Singapore | 99.5 /100 | #73 | Exceptional 95.8% |
| Thais | 99.5 /100 | #74 | Exceptional 95.8% |
| Inupiat | 99.5 /100 | #75 | Exceptional 95.8% |
| Immigrants | Sweden | 99.5 /100 | #76 | Exceptional 95.8% |
| Whites/Caucasians | 99.4 /100 | #77 | Exceptional 95.8% |
| Immigrants | South Africa | 99.4 /100 | #78 | Exceptional 95.8% |
| Romanians | 99.3 /100 | #79 | Exceptional 95.7% |
Demographics Similar to Barbadians by 9th Grade
In terms of 9th grade, the demographic groups most similar to Barbadians are Malaysian (93.5%, a difference of 0.020%), Immigrants from Trinidad and Tobago (93.6%, a difference of 0.070%), Bangladeshi (93.4%, a difference of 0.070%), Taiwanese (93.6%, a difference of 0.11%), and Immigrants from Peru (93.4%, a difference of 0.11%).
| Demographics | Rating | Rank | 9th Grade |
| West Indians | 0.2 /100 | #276 | Tragic 93.7% |
| Immigrants | Philippines | 0.1 /100 | #277 | Tragic 93.7% |
| Immigrants | Eritrea | 0.1 /100 | #278 | Tragic 93.7% |
| Trinidadians and Tobagonians | 0.1 /100 | #279 | Tragic 93.7% |
| Taiwanese | 0.1 /100 | #280 | Tragic 93.6% |
| Immigrants | Trinidad and Tobago | 0.1 /100 | #281 | Tragic 93.6% |
| Malaysians | 0.0 /100 | #282 | Tragic 93.5% |
| Barbadians | 0.0 /100 | #283 | Tragic 93.5% |
| Bangladeshis | 0.0 /100 | #284 | Tragic 93.4% |
| Immigrants | Peru | 0.0 /100 | #285 | Tragic 93.4% |
| Immigrants | Barbados | 0.0 /100 | #286 | Tragic 93.4% |
| Immigrants | St. Vincent and the Grenadines | 0.0 /100 | #287 | Tragic 93.4% |
| Immigrants | South Eastern Asia | 0.0 /100 | #288 | Tragic 93.3% |
| Immigrants | West Indies | 0.0 /100 | #289 | Tragic 93.3% |
| Pennsylvania Germans | 0.0 /100 | #290 | Tragic 93.3% |