Turkish vs Immigrants from Denmark Disability Age 5 to 17
COMPARE
Turkish
Immigrants from Denmark
Disability Age 5 to 17
Disability Age 5 to 17 Comparison
Turks
Immigrants from Denmark
5.1%
DISABILITY AGE 5 TO 17
99.9/ 100
METRIC RATING
51st/ 347
METRIC RANK
5.4%
DISABILITY AGE 5 TO 17
91.4/ 100
METRIC RATING
136th/ 347
METRIC RANK
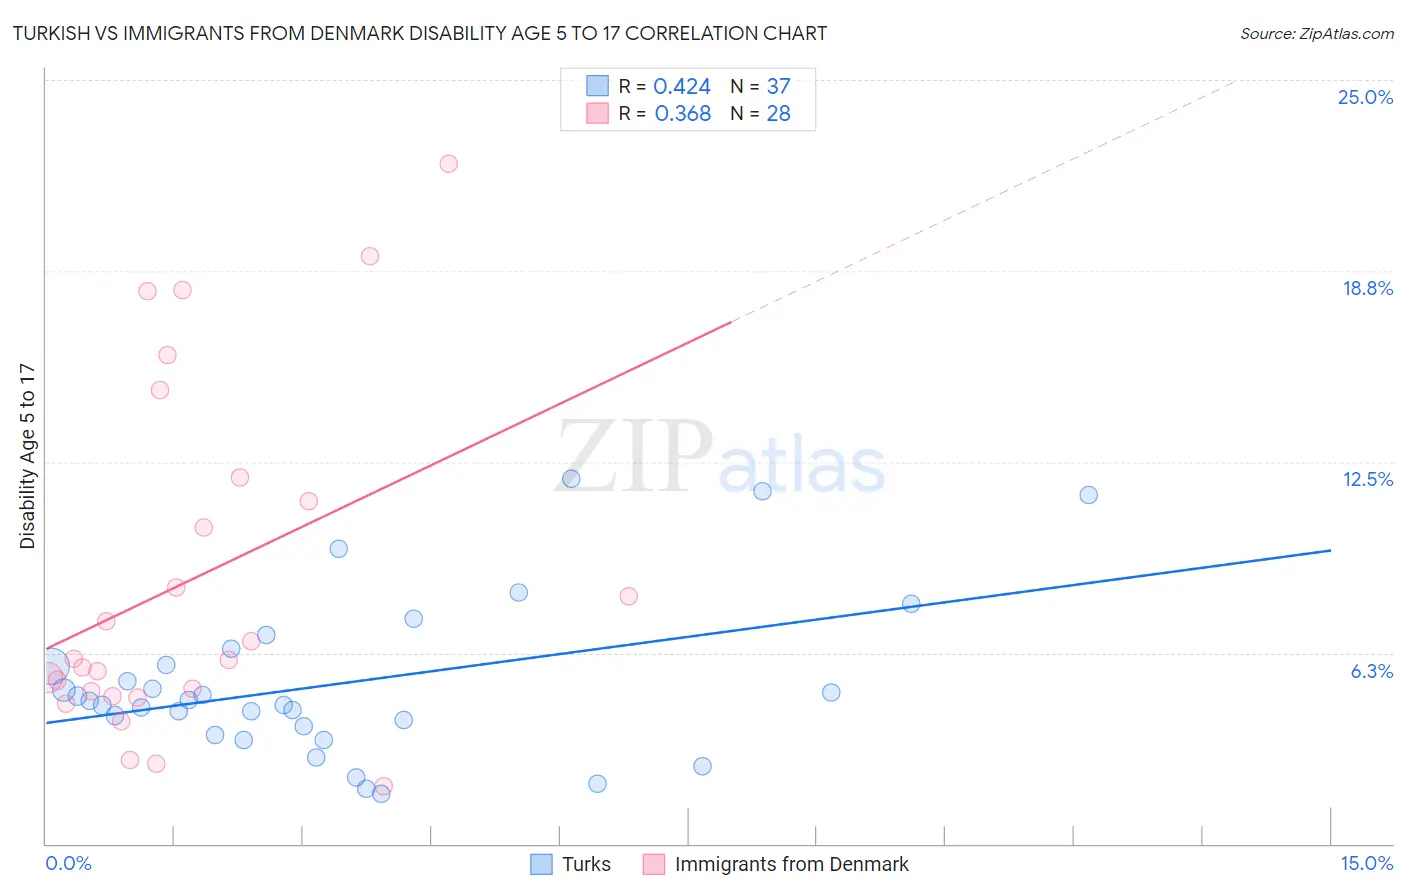
Turkish vs Immigrants from Denmark Disability Age 5 to 17 Correlation Chart
The statistical analysis conducted on geographies consisting of 270,239,204 people shows a moderate positive correlation between the proportion of Turks and percentage of population with a disability between the ages 5 and 17 in the United States with a correlation coefficient (R) of 0.424 and weighted average of 5.1%. Similarly, the statistical analysis conducted on geographies consisting of 135,667,320 people shows a mild positive correlation between the proportion of Immigrants from Denmark and percentage of population with a disability between the ages 5 and 17 in the United States with a correlation coefficient (R) of 0.368 and weighted average of 5.4%, a difference of 6.6%.
Disability Age 5 to 17 Correlation Summary
| Measurement | Turkish | Immigrants from Denmark |
| Minimum | 1.7% | 1.9% |
| Maximum | 12.0% | 22.3% |
| Range | 10.3% | 20.4% |
| Mean | 5.3% | 8.7% |
| Median | 4.7% | 6.0% |
| Interquartile 25% (IQ1) | 3.7% | 4.9% |
| Interquartile 75% (IQ3) | 6.1% | 11.6% |
| Interquartile Range (IQR) | 2.4% | 6.7% |
| Standard Deviation (Sample) | 2.6% | 5.6% |
| Standard Deviation (Population) | 2.6% | 5.5% |
Similar Demographics by Disability Age 5 to 17
Demographics Similar to Turks by Disability Age 5 to 17
In terms of disability age 5 to 17, the demographic groups most similar to Turks are Immigrants from Fiji (5.1%, a difference of 0.090%), Immigrants from Lithuania (5.1%, a difference of 0.14%), Paraguayan (5.1%, a difference of 0.17%), Laotian (5.1%, a difference of 0.22%), and Immigrants from Turkey (5.1%, a difference of 0.23%).
| Demographics | Rating | Rank | Disability Age 5 to 17 |
| Egyptians | 100.0 /100 | #44 | Exceptional 5.0% |
| Tongans | 100.0 /100 | #45 | Exceptional 5.0% |
| Assyrians/Chaldeans/Syriacs | 100.0 /100 | #46 | Exceptional 5.0% |
| Vietnamese | 100.0 /100 | #47 | Exceptional 5.1% |
| Koreans | 100.0 /100 | #48 | Exceptional 5.1% |
| Immigrants | Western Asia | 100.0 /100 | #49 | Exceptional 5.1% |
| Argentineans | 99.9 /100 | #50 | Exceptional 5.1% |
| Turks | 99.9 /100 | #51 | Exceptional 5.1% |
| Immigrants | Fiji | 99.9 /100 | #52 | Exceptional 5.1% |
| Immigrants | Lithuania | 99.9 /100 | #53 | Exceptional 5.1% |
| Paraguayans | 99.9 /100 | #54 | Exceptional 5.1% |
| Laotians | 99.9 /100 | #55 | Exceptional 5.1% |
| Immigrants | Turkey | 99.9 /100 | #56 | Exceptional 5.1% |
| Immigrants | Poland | 99.9 /100 | #57 | Exceptional 5.1% |
| Immigrants | Ukraine | 99.9 /100 | #58 | Exceptional 5.1% |
Demographics Similar to Immigrants from Denmark by Disability Age 5 to 17
In terms of disability age 5 to 17, the demographic groups most similar to Immigrants from Denmark are Immigrants from Belize (5.4%, a difference of 0.050%), Navajo (5.4%, a difference of 0.080%), Immigrants from Oceania (5.4%, a difference of 0.090%), Belizean (5.4%, a difference of 0.090%), and Immigrants from Netherlands (5.4%, a difference of 0.14%).
| Demographics | Rating | Rank | Disability Age 5 to 17 |
| Romanians | 94.1 /100 | #129 | Exceptional 5.4% |
| Immigrants | Bulgaria | 94.0 /100 | #130 | Exceptional 5.4% |
| Arabs | 92.9 /100 | #131 | Exceptional 5.4% |
| Immigrants | Colombia | 92.9 /100 | #132 | Exceptional 5.4% |
| Venezuelans | 92.7 /100 | #133 | Exceptional 5.4% |
| Yuman | 92.3 /100 | #134 | Exceptional 5.4% |
| Immigrants | Belize | 91.7 /100 | #135 | Exceptional 5.4% |
| Immigrants | Denmark | 91.4 /100 | #136 | Exceptional 5.4% |
| Navajo | 90.9 /100 | #137 | Exceptional 5.4% |
| Immigrants | Oceania | 90.8 /100 | #138 | Exceptional 5.4% |
| Belizeans | 90.8 /100 | #139 | Exceptional 5.4% |
| Immigrants | Netherlands | 90.5 /100 | #140 | Exceptional 5.4% |
| South American Indians | 89.3 /100 | #141 | Excellent 5.5% |
| Colombians | 88.0 /100 | #142 | Excellent 5.5% |
| Immigrants | Hungary | 87.9 /100 | #143 | Excellent 5.5% |