Immigrants from Trinidad and Tobago vs Barbadian Disability Age 5 to 17
COMPARE
Immigrants from Trinidad and Tobago
Barbadian
Disability Age 5 to 17
Disability Age 5 to 17 Comparison
Immigrants from Trinidad and Tobago
Barbadians
5.6%
DISABILITY AGE 5 TO 17
47.6/ 100
METRIC RATING
178th/ 347
METRIC RANK
5.9%
DISABILITY AGE 5 TO 17
1.3/ 100
METRIC RATING
254th/ 347
METRIC RANK
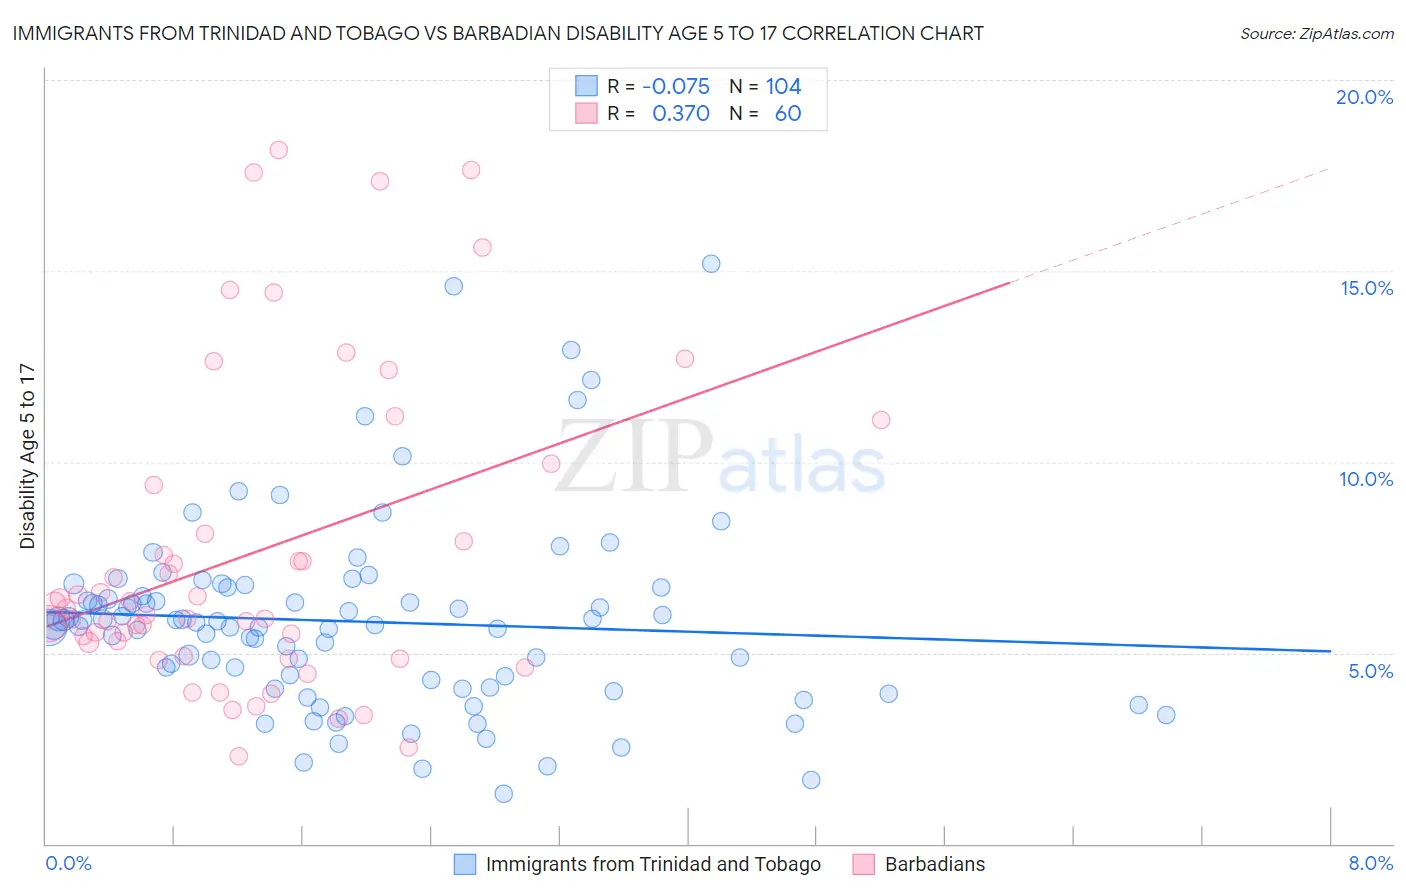
Immigrants from Trinidad and Tobago vs Barbadian Disability Age 5 to 17 Correlation Chart
The statistical analysis conducted on geographies consisting of 222,636,548 people shows a slight negative correlation between the proportion of Immigrants from Trinidad and Tobago and percentage of population with a disability between the ages 5 and 17 in the United States with a correlation coefficient (R) of -0.075 and weighted average of 5.6%. Similarly, the statistical analysis conducted on geographies consisting of 140,971,871 people shows a mild positive correlation between the proportion of Barbadians and percentage of population with a disability between the ages 5 and 17 in the United States with a correlation coefficient (R) of 0.370 and weighted average of 5.9%, a difference of 5.2%.
Disability Age 5 to 17 Correlation Summary
| Measurement | Immigrants from Trinidad and Tobago | Barbadian |
| Minimum | 1.3% | 2.3% |
| Maximum | 15.2% | 18.2% |
| Range | 13.9% | 15.9% |
| Mean | 5.8% | 7.6% |
| Median | 5.8% | 6.1% |
| Interquartile 25% (IQ1) | 4.2% | 5.1% |
| Interquartile 75% (IQ3) | 6.6% | 8.8% |
| Interquartile Range (IQR) | 2.4% | 3.7% |
| Standard Deviation (Sample) | 2.5% | 4.1% |
| Standard Deviation (Population) | 2.5% | 4.0% |
Similar Demographics by Disability Age 5 to 17
Demographics Similar to Immigrants from Trinidad and Tobago by Disability Age 5 to 17
In terms of disability age 5 to 17, the demographic groups most similar to Immigrants from Trinidad and Tobago are Immigrants from Western Europe (5.6%, a difference of 0.010%), Shoshone (5.6%, a difference of 0.090%), Immigrants from Central America (5.6%, a difference of 0.090%), Costa Rican (5.6%, a difference of 0.12%), and Uruguayan (5.6%, a difference of 0.17%).
| Demographics | Rating | Rank | Disability Age 5 to 17 |
| Immigrants | Iraq | 53.9 /100 | #171 | Average 5.6% |
| Ukrainians | 51.5 /100 | #172 | Average 5.6% |
| Uruguayans | 51.0 /100 | #173 | Average 5.6% |
| Costa Ricans | 50.0 /100 | #174 | Average 5.6% |
| Shoshone | 49.4 /100 | #175 | Average 5.6% |
| Immigrants | Central America | 49.4 /100 | #176 | Average 5.6% |
| Immigrants | Western Europe | 47.8 /100 | #177 | Average 5.6% |
| Immigrants | Trinidad and Tobago | 47.6 /100 | #178 | Average 5.6% |
| Immigrants | Barbados | 40.5 /100 | #179 | Average 5.6% |
| Immigrants | Uruguay | 37.7 /100 | #180 | Fair 5.6% |
| Immigrants | England | 36.4 /100 | #181 | Fair 5.6% |
| Mexican American Indians | 35.2 /100 | #182 | Fair 5.6% |
| Immigrants | Latin America | 34.3 /100 | #183 | Fair 5.6% |
| Syrians | 33.8 /100 | #184 | Fair 5.6% |
| Immigrants | Mexico | 33.7 /100 | #185 | Fair 5.6% |
Demographics Similar to Barbadians by Disability Age 5 to 17
In terms of disability age 5 to 17, the demographic groups most similar to Barbadians are Italian (5.9%, a difference of 0.070%), Scandinavian (5.9%, a difference of 0.10%), Honduran (5.9%, a difference of 0.17%), Immigrants from Cambodia (5.9%, a difference of 0.19%), and Polish (5.9%, a difference of 0.22%).
| Demographics | Rating | Rank | Disability Age 5 to 17 |
| Immigrants | Honduras | 1.8 /100 | #247 | Tragic 5.9% |
| British | 1.7 /100 | #248 | Tragic 5.9% |
| Immigrants | Ghana | 1.7 /100 | #249 | Tragic 5.9% |
| Poles | 1.5 /100 | #250 | Tragic 5.9% |
| Immigrants | Cambodia | 1.5 /100 | #251 | Tragic 5.9% |
| Hondurans | 1.5 /100 | #252 | Tragic 5.9% |
| Scandinavians | 1.4 /100 | #253 | Tragic 5.9% |
| Barbadians | 1.3 /100 | #254 | Tragic 5.9% |
| Italians | 1.2 /100 | #255 | Tragic 5.9% |
| Hopi | 1.0 /100 | #256 | Tragic 5.9% |
| Hispanics or Latinos | 1.0 /100 | #257 | Tragic 5.9% |
| Brazilians | 0.9 /100 | #258 | Tragic 5.9% |
| Slavs | 0.9 /100 | #259 | Tragic 5.9% |
| Somalis | 0.8 /100 | #260 | Tragic 5.9% |
| Immigrants | Middle Africa | 0.7 /100 | #261 | Tragic 5.9% |