Turkish vs Ottawa Disability Age 5 to 17
COMPARE
Turkish
Ottawa
Disability Age 5 to 17
Disability Age 5 to 17 Comparison
Turks
Ottawa
5.1%
DISABILITY AGE 5 TO 17
99.9/ 100
METRIC RATING
51st/ 347
METRIC RANK
6.8%
DISABILITY AGE 5 TO 17
0.0/ 100
METRIC RATING
335th/ 347
METRIC RANK
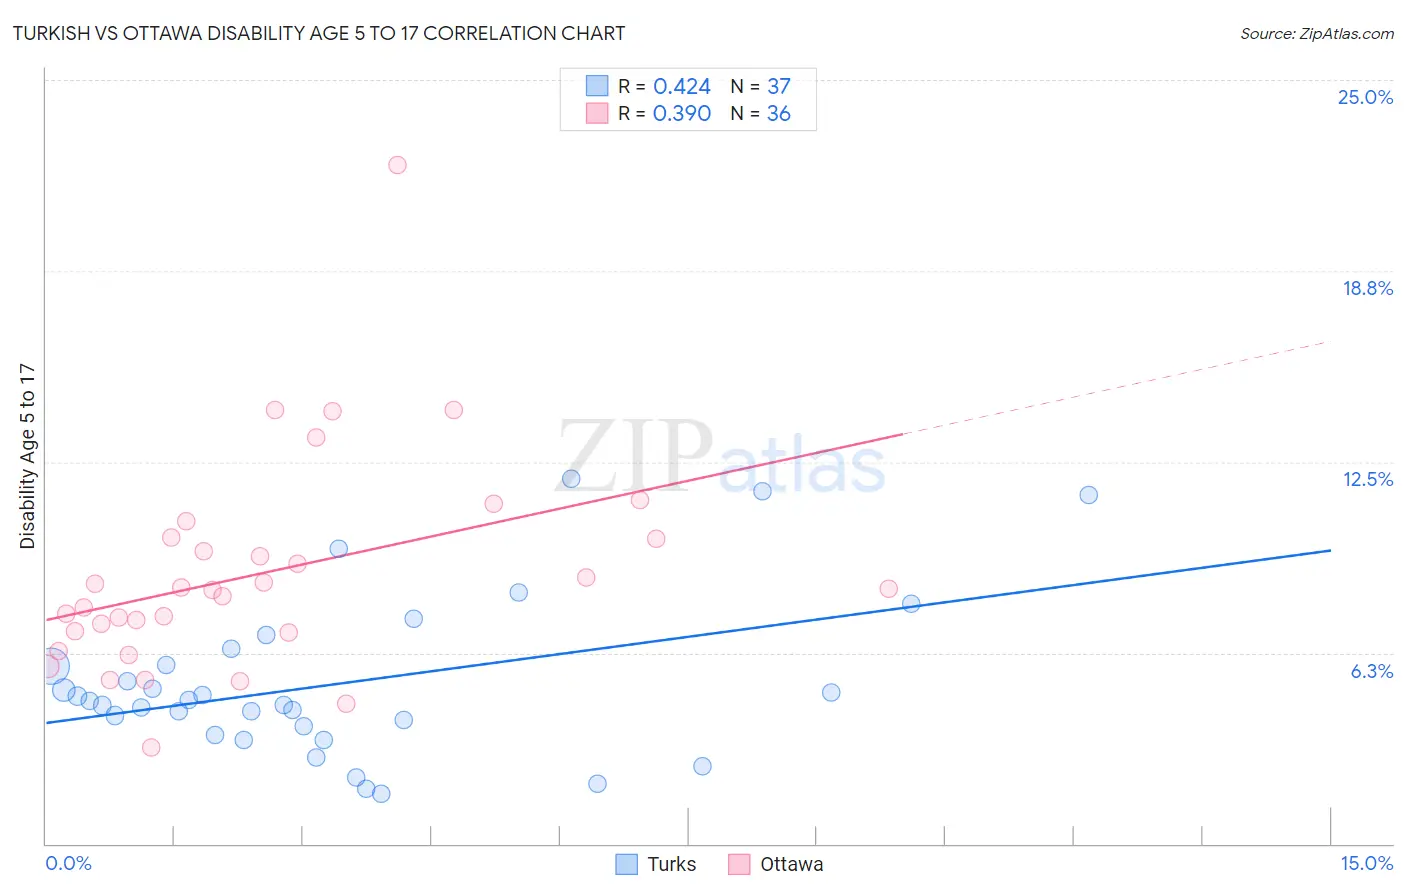
Turkish vs Ottawa Disability Age 5 to 17 Correlation Chart
The statistical analysis conducted on geographies consisting of 270,239,204 people shows a moderate positive correlation between the proportion of Turks and percentage of population with a disability between the ages 5 and 17 in the United States with a correlation coefficient (R) of 0.424 and weighted average of 5.1%. Similarly, the statistical analysis conducted on geographies consisting of 49,831,425 people shows a mild positive correlation between the proportion of Ottawa and percentage of population with a disability between the ages 5 and 17 in the United States with a correlation coefficient (R) of 0.390 and weighted average of 6.8%, a difference of 33.4%.
Disability Age 5 to 17 Correlation Summary
| Measurement | Turkish | Ottawa |
| Minimum | 1.7% | 3.1% |
| Maximum | 12.0% | 22.2% |
| Range | 10.3% | 19.1% |
| Mean | 5.3% | 8.8% |
| Median | 4.7% | 8.3% |
| Interquartile 25% (IQ1) | 3.7% | 6.9% |
| Interquartile 75% (IQ3) | 6.1% | 10.0% |
| Interquartile Range (IQR) | 2.4% | 3.1% |
| Standard Deviation (Sample) | 2.6% | 3.5% |
| Standard Deviation (Population) | 2.6% | 3.5% |
Similar Demographics by Disability Age 5 to 17
Demographics Similar to Turks by Disability Age 5 to 17
In terms of disability age 5 to 17, the demographic groups most similar to Turks are Immigrants from Fiji (5.1%, a difference of 0.090%), Immigrants from Lithuania (5.1%, a difference of 0.14%), Paraguayan (5.1%, a difference of 0.17%), Laotian (5.1%, a difference of 0.22%), and Immigrants from Turkey (5.1%, a difference of 0.23%).
| Demographics | Rating | Rank | Disability Age 5 to 17 |
| Egyptians | 100.0 /100 | #44 | Exceptional 5.0% |
| Tongans | 100.0 /100 | #45 | Exceptional 5.0% |
| Assyrians/Chaldeans/Syriacs | 100.0 /100 | #46 | Exceptional 5.0% |
| Vietnamese | 100.0 /100 | #47 | Exceptional 5.1% |
| Koreans | 100.0 /100 | #48 | Exceptional 5.1% |
| Immigrants | Western Asia | 100.0 /100 | #49 | Exceptional 5.1% |
| Argentineans | 99.9 /100 | #50 | Exceptional 5.1% |
| Turks | 99.9 /100 | #51 | Exceptional 5.1% |
| Immigrants | Fiji | 99.9 /100 | #52 | Exceptional 5.1% |
| Immigrants | Lithuania | 99.9 /100 | #53 | Exceptional 5.1% |
| Paraguayans | 99.9 /100 | #54 | Exceptional 5.1% |
| Laotians | 99.9 /100 | #55 | Exceptional 5.1% |
| Immigrants | Turkey | 99.9 /100 | #56 | Exceptional 5.1% |
| Immigrants | Poland | 99.9 /100 | #57 | Exceptional 5.1% |
| Immigrants | Ukraine | 99.9 /100 | #58 | Exceptional 5.1% |
Demographics Similar to Ottawa by Disability Age 5 to 17
In terms of disability age 5 to 17, the demographic groups most similar to Ottawa are Chickasaw (6.8%, a difference of 0.50%), Seminole (6.8%, a difference of 0.70%), Black/African American (6.8%, a difference of 0.75%), Creek (6.9%, a difference of 0.93%), and Iroquois (6.9%, a difference of 1.2%).
| Demographics | Rating | Rank | Disability Age 5 to 17 |
| Pennsylvania Germans | 0.0 /100 | #328 | Tragic 6.6% |
| Blackfeet | 0.0 /100 | #329 | Tragic 6.6% |
| Dutch West Indians | 0.0 /100 | #330 | Tragic 6.7% |
| French Canadians | 0.0 /100 | #331 | Tragic 6.7% |
| Immigrants | Azores | 0.0 /100 | #332 | Tragic 6.7% |
| Blacks/African Americans | 0.0 /100 | #333 | Tragic 6.8% |
| Seminole | 0.0 /100 | #334 | Tragic 6.8% |
| Ottawa | 0.0 /100 | #335 | Tragic 6.8% |
| Chickasaw | 0.0 /100 | #336 | Tragic 6.8% |
| Creek | 0.0 /100 | #337 | Tragic 6.9% |
| Iroquois | 0.0 /100 | #338 | Tragic 6.9% |
| Choctaw | 0.0 /100 | #339 | Tragic 6.9% |
| Cherokee | 0.0 /100 | #340 | Tragic 6.9% |
| Cape Verdeans | 0.0 /100 | #341 | Tragic 7.0% |
| Chippewa | 0.0 /100 | #342 | Tragic 7.1% |